Avicenna J Environ Health Eng. 11(2):91-103.
doi: 10.34172/ajehe.5473
Original Article
Ultrasonic-Assisted Amine Grafted on Super-Hydrophobic Silica Aerogel Derived from Pumice for Arsenate Adsorption
Mansur Zarrabi 1, * 
Author information:
1Department of Environmental Health Engineering, Research Center for Health, Safety, and Environment, Alborz University of Medical Sciences, Karaj, Iran
Abstract
A highly stable and high-density amino group (6.54 µmol/m2) was loaded on super-hydrophobic silica aerogel derived from pumice by the ultrasonic method and used to remove arsenate (As). After ultrasonic amine grafting, the specific surface area did not change, as 832 m2 /g of a specific surface, a hole volume of 3.84 cm3 /g, and an average hole diameter of 12.39 nm were observable. The selected parameters were directly dependent on As adsorption (100% As removal at the pH rate of 6.85, reaction time of 120 minutes, and initial solute concentration of 95.21 µg/L based on multiple non-linear regression analyses). The kinetics of As adsorption was best explained by the pseudo-first-order kinetic, which is proof of the chemical adsorption mechanism. The heterogeneous surface with multilayer adsorption sites for As adsorption was obtained from various isotherm models. The maximum uptake capacity of 42.2 mg/g was observed based on the Khan model. The spent adsorbent was successfully regenerated and reused by HCl, but a substantial reduction in adsorption capacity was detected after five regeneration-reuse cycles. Based on the results, the ultrasonic method was found to be more effective, economical, and environmentally friendly compared to conventional sol-gel methods for the surface amine functionalization of silica aerogel to remove As from the aqueous solution.
Keywords: Arsenate, Ultrasonic, Silica aerogel, Box-Benkin,
Copyright and License Information
© 2024 The Author(s); Published by Hamadan University of Medical Sciences.
This is an open-access article distributed under the terms of the Creative Commons Attribution License (
https://creativecommons.org/licenses/by/4.0), which permits unrestricted use, distribution, and reproduction in any medium, provided the original work is properly cited.
Please cite this article as follows: Zarrabi M. Ultrasonic-assisted amine grafted on super-hydrophobic silica aerogel derived from pumice for arsenate adsorption. Avicenna J Environ Health Eng. 2024;11(2):91-103. doi:10.34172/ajehe.5473
1. Introduction
High levels of surface and groundwater pollution with arsenate (As) have been widely reported in many countries, such as India, Bangladesh, and other parts of the world (1). It has been estimated that more than 230 million people are globally subjected to the poisoning level of As (2). Even at extremely low concentrations, As is considered a serious threat to human health, such as peel, bellows, and other types of living body cancer (3). For this reason, WHO set 10 µg/L of As in water as the permissible limit (4). Arsenic exists as arsenite (As(III)) and As(V) in water; among them, arsenite is 5–10 times more toxic than As (5). Therefore, the removal of As has received more attention among researchers. Conventional water treatment processes, such as chemical precipitation, advanced oxidation processes, electrochemical processes, membrane filtration, and adsorption process, have been tested for As removal (6). Among them, the applicability of advanced oxidation process, membrane filtration, chemical precipitation, and electrochemical process has been limited due to their process complexities, energy costs, and production of secondary sludge. Nonetheless, adsorption is the most convenient method for the removal of various pollutants due to its simplicity, cost-effectiveness, environmentally friendly nature, and frequent reusability (7). Recently, silica aerogel as a new adsorbent has attracted more attention due to its exclusive characteristics, such as the vast area to mass (500–1200 m2/g), numerous porosity rates (80%–99.8%), and slight density (∼0.003 g/cm3) (8). However, the negative charge in silica-derived materials (an isoelectric point of less than 3.5) limited their application for capturing electron-impaired materials, such as inbred and cationic compounds (9). By organic and inorganic surface modification, one can develop an adsorbent that can be used for capturing anionic and cationic species in wide solution pH rates (10). In this regard, 3-aminopropyl triethoxysilane (APTES) has priority for surface modification of silica-derived materials due to its fast hydrolysis nature and abilities to render three reactive ethoxy bonds per molecule and form polymers and oligomers that increase the adsorption of pollutants by silica-based materials (11). Considering that the aminopropyl bond (R-NH2) has a pKa of 10.8, the adsorbent surface retains a positive charge up to a pH value of 11, which is favorable for anchoring various organic and inorganic species (12). Considering the unique properties of silica aerogel and amine-coated silica aerogel, we previously reported the adsorption properties of ibuprofen and cefixime (8,13) by sol-gel amine functionalized pumice-derived silica aerogel (AMPDSA). The work seeks to demonstrate the ultrasonic method for grafting amine on pumice-derived silica aerogel (PDSA) due to its inexpensiveness, environmentally friendly nature, and simplicity and use it for the adsorption of As from an aqueous environment.
2. Materials and Methods
2.1. Chemicals
Materials were of analytical grade and used without any refinement. Natural pumice was collected from Tikmedash areas (East Azerbaijan, Iran). The mentioned materials included hydrogen form resin (Amberlite@IR120), APTES (99%), hexamethyldisilazane (HMDS, ≥ 99%), anhydrous toluene (99.9%, > 0.005% water), hydroxybenzaldehyde (salicylaldehyde, purity > 99%), and caustic soda (extra pure). The other materials were ammonia solution (25%), n-hexane (99%), disodium hydrogen As heptahydrate (Na2HAsO4.7H2O) (purity > 99%), and ethanol (99.9%), all of which were obtained from Sigma–Aldrich Company (St. Louis, MO, USA).
2.2. Synthesis of Pumice-Derived Silica Aerogel
Water glass was obtained and utilized for silica aerogel synthesis as in our previously published works (8,13); however, HMDS was used instead of trimethoxymethylsilane. The sodium silicate solution was prepared by mixing 2.50 g of pumice in 250 mL of the 1 M hydroxide sodium solution for 6 hours at 100 °C. After cooling to room temperature, the suspension was filtered and employed as the silica source. To separate the sodium ions, an equal volume of Amberlite@IR120 resin and the prepared silicate solution was shaken until the solution pH fell to below 3, which is evidence of Na+ replacement with H+ and the formation of silicic acid. About 50 mL of the derived silicic acid was transferred to a 100 mL beaker, and while stirring slowly, the ammonium solution (0.5 M) was added dropwise until a bright gel was obtained. The gel was aged in anhydrous ethanol for 72 hours in a water bath at 60 °C. Then, the ethanol in gel pores was replaced with n-hexane at ambient temperature for 24 hours. Next, the gel was introduced to a mixture of the HMDS/n-hexane solution (2%, v/v) to reduce capillary stress and avoid structural contraction during standard pressure drying. Finally, the surface-silylated gel was eluted several times with normal hexane to remove excessive HMDS and dried in an oven at 40 °C, 60 °C, 80 °C, 120 °C, and 180 °C for 2 hours (14).
2.3. Amine Grafting on Pumice-Derived Silica Aerogel
Instead of using the conventional refluxing method, the ultrasonic method (a simple, time-consuming, and more effective method) was used for the grafting of amine on the PDSA surface. To achieve a high amine loading rate, the effect of temperature (20°C, 40°C, and 80°C) and the presence/absence of 10 mL tetraethylorthosilicate (TEOS) as a co-hydrolyzer agent underwent investigation. For this purpose, about 5.0 g of PDSA was added to 100 mL of toluene containing 2.50 mL of APTES and then sonicated at a frequency of 80 kHz and power of 100% by one of the following methods for 1 hour:
-
Sample 1: Adding 10 mL TEOS as the prepared mixture sonicated at 80 °C
-
Sample 2: Preparing a mixture sonicated at 80 °C in the absence of TEOS
-
Sample 3: Adding 10 mL TEOS as the prepared mixture sonicated at 40 °C
-
Sample 4: Using as a prepared mixture sonicated at 40 °C in the absence of TEOS
-
Sample 5: Adding 10 mL TEOS as the prepared mixture sonicated at 20 °C
-
Sample 6: Using as a prepared mixture sonicated at 20 °C in the absence of TEOS
After sonication, the samples were filtered and washed three times with toluene and dried at 120 °C for 24 hours. From the above list, samples with the lowest amine release were selected, named AMPDSA, and used as the As adsorbent.
2.4. Materials Characterization
Methylene iodide and water as the dispersive liquid (5 µL on a 1 cm2 surface) and the regular liquid, respectively, were used to measure the surface energy and hydrophobicity using an OCA 15 plus instrument. The X-ray diffraction (XRD) pattern of PDSA and AMPDSA was recorded by CuKα radiation (1.54056 A˚) under 40 kV and 30 mA with a step width of 0.02° and scan rate of 1°/s (PHILIPS, model PW-1730, Netherlands). The morphology was studied using transmission electron microscopy and field emission scanning electron microscopy (FESEM) equipped with energy dispersive X-ray spectroscopy (FESEM-TESCAN, Model MIRA 3, Czech Republic). Functional species on the surface of natural pumice, PDSA, and AMPDSA were studied by Fourier-transformed infrared (FTIR) spectroscopy (Perkin Elmer-spectrum 65, the USA) in the wavenumber range of 400–4000 cm-1. Nitrogen adsorption-desorption isotherm at 77 K was collected using a BET setup (Belsorp Mini, Japan) to determine the specific surface area and pore size distribution (BJH). All the samples were degassed at 150°C for 4 hours for BET tests. The Schiff base reaction was used to investigate the amount and bond type of grafted amine on prepared silica aerogel (15). To this end, each sample from the above-mentioned route was dissolved in 100 mL ethanol and stirred for 2 hours at 500 rpm. The sample was then filtered, and 500 µL of salicylaldehyde was added to 5 mL of the supernatant. Amine reacted with salicylaldehyde and formed a light-yellow color that had the maximum absorbance at 404 nm (Shimadzu-1700, Japan). The intensity of that color was proportional to the released amine from the AMPDSA adsorbent. The 209 F1 instrument with a heating rate of 10 °C/min under N2 atmosphere was utilized to study the thermogravimetric analysis of samples.
2.5. Batch Adsorption Test
Disodium hydrogen As heptahydrate was used to prepare a stock As solution in drinking water to simulate the real condition. The target As solution was achieved by diluting the stock solution. Central composite design (CCD) based on response surface methodology was employed to identify the interactions between the variables, such as solution pH (4.50–8.50), contact time (20–140 minutes), and As concentration (20–120 µg/L), and optimize the responses shaped under the influence of process variables. All batch experiments were conducted at a constant 0.05 g/L adsorbent mass. The number of experiments was determined using Eq. (1):
Where k and Co are the number of parameters and center points, respectively. Using Eq. (1), the number, order, and removal efficiency of As based on the CCD method are presented in Table 1. All 20 runs were executed randomly and then analyzed using Eq. (2) as follows:
Table 1.
Parameters of Kinetic Models
|
Kinetic Model
|
Parameters
|
0.05 mg/L
|
0.1 mg/L
|
| Pseudo-first-order
|
k1 |
0.060 |
0.070 |
| qe,Exp |
9.81 |
19.71 |
| qe,Cal |
9.95 |
19.56 |
| R2 |
0.99 |
0.99 |
| RSS |
1.49 |
3.74 |
| Pseudo-second-order
|
K2 |
0.005 |
0.070 |
| qe,Exp |
9.81 |
19.71 |
| qe,Cal |
12.36 |
23.48 |
| R2 |
0.99 |
0.99 |
| RSS |
1.62 |
4.15 |
Note. RSS: Residual sum of squares.
(2)
Where Y and K denote the dependent variable (removal efficiency) and digit of the variables, respectively. Moreover, i and j are the figures for patterns, and βo is the intercept term. In addition, X1, X2,...,Xk represent the coded autonomous parameters, and βi indicates the first-order (linear) main effect. Further, βii and βij demonstrate the quadratic (squared) effect and the interaction effect, respectively, and ε implies the random error or allows for discrepancies or uncertainties between predicted and measured values. The open-source R software was used for experimental design and model fitting. The significance of independent variables in the system and their interactions was studied by the analysis of variance. Additionally, an α level of 0.05 was selected to identify the statistical significance of all results. According to Table S1, 100 mL of the As solution was prepared with a defined concentration and solution pH (adjusted using 0.1 M NaOH or HCl solutions). Afterward, a certain amount of the adsorbent was added to the solutions, agitated for the desired adsorption time, and then filtered through a 0.45 µm membrane filter. At the end of each run, the final As concentration was detected by an ICP-MASS spectrometer (Agilent 7500 ICP-MS).
3. Results and Discussion
3.1. Material Characterization
Fig. 1 depicts the water contact angle of the prepared silica aerogel. As expected, the prepared sample revealed a super-hydrophobic surface of 151.4o water contact angle, which was higher than those obtained with 10% MTMS (143o) in our previous works (8,13). A higher water contact angle well demonstrates the good silylating process of silica aerogel due to the more methyl groups in the structure of HDMS. According to Young’s equation, Eq. (3), the surface energy and hydrophobicity of any matter have a straight and oblique relationship with the water contact angle:
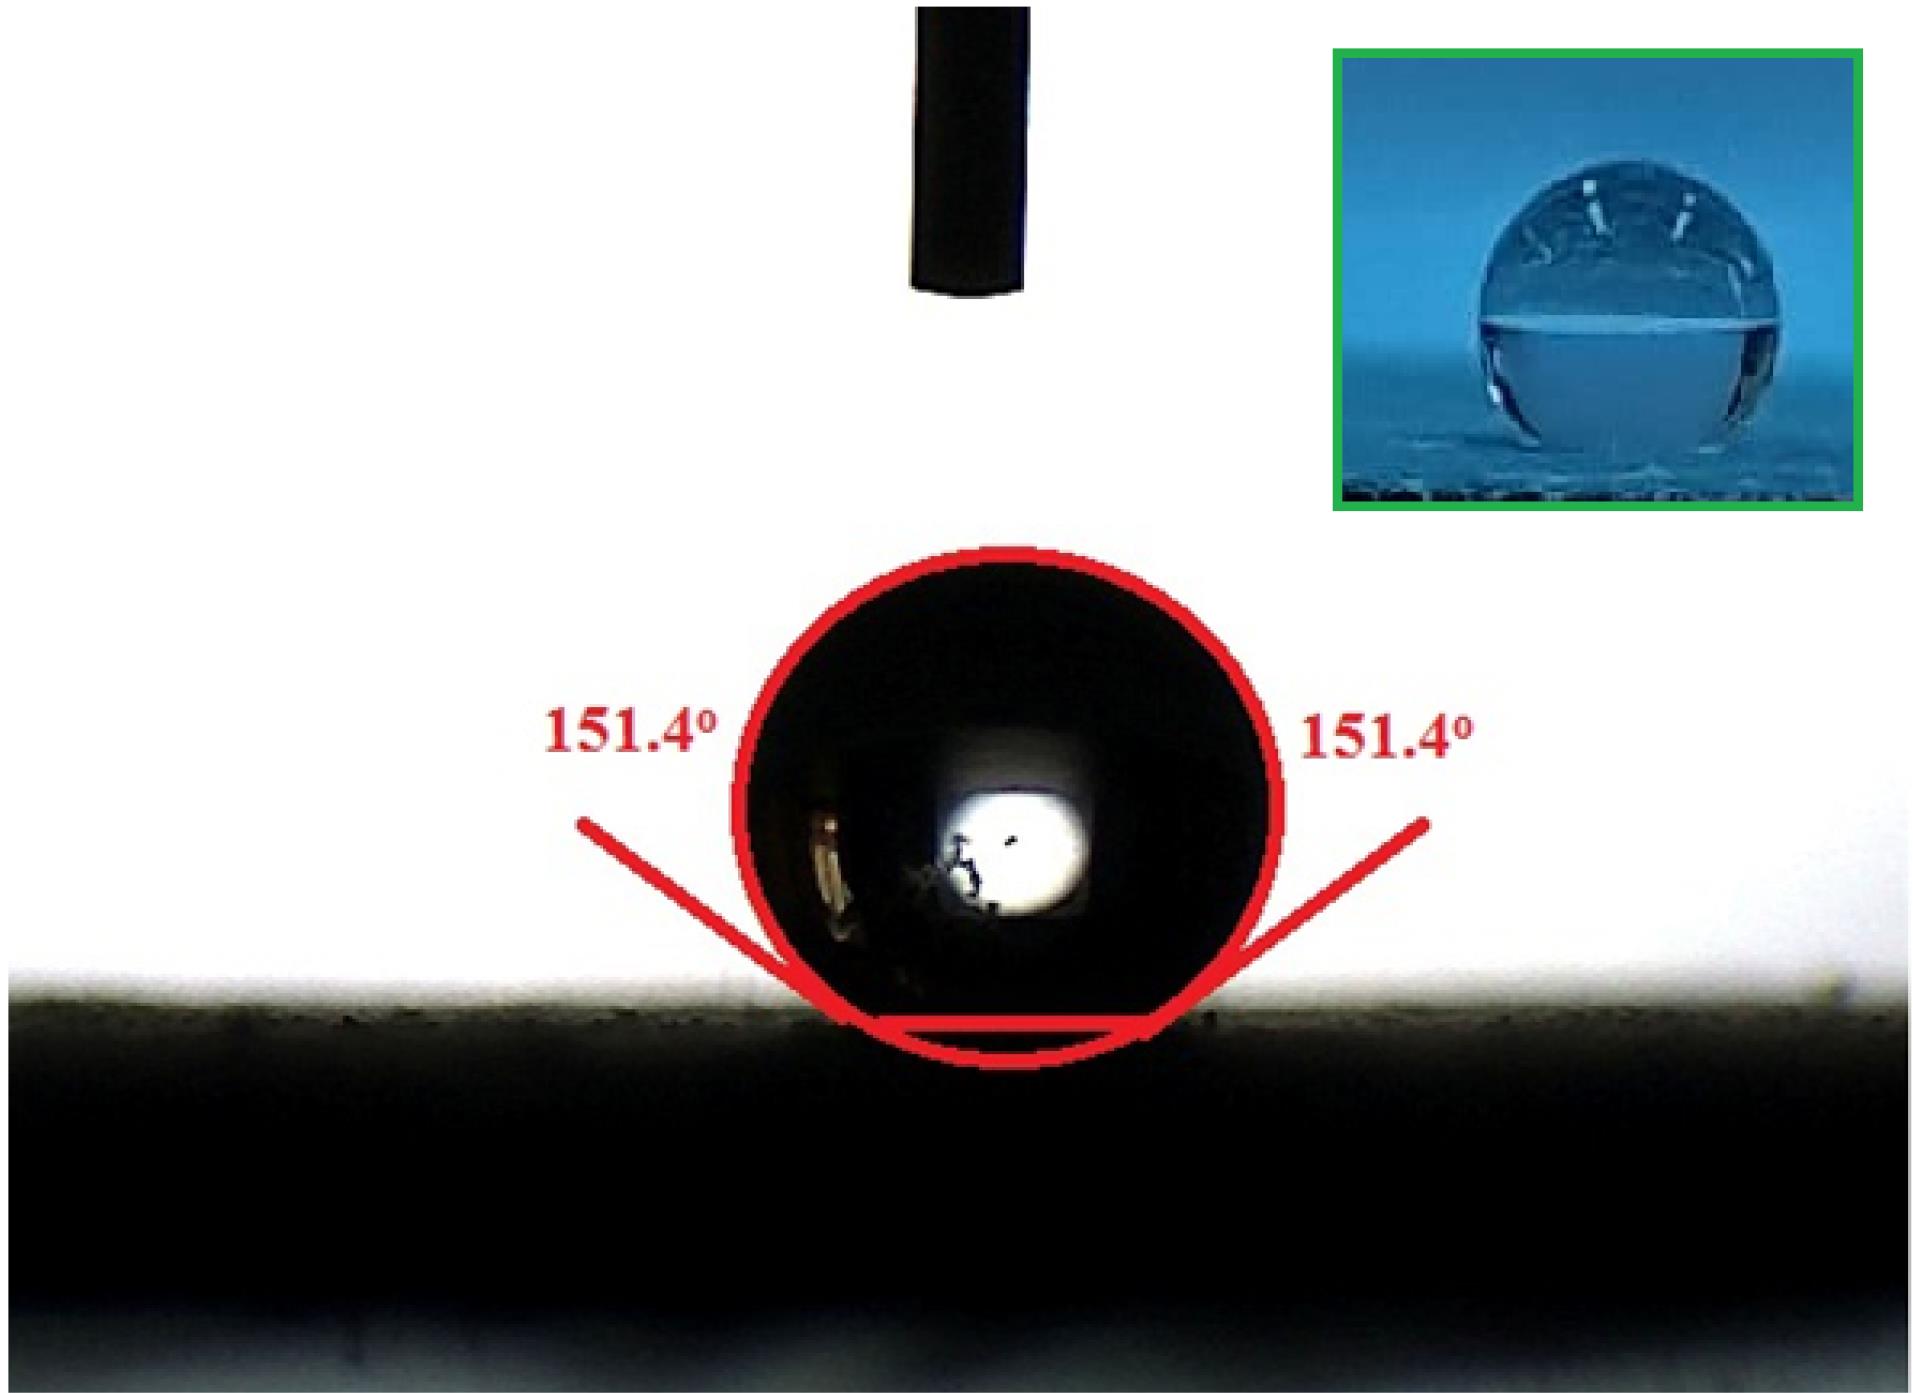
Fig. 1.
Water Contact Angle of Prepared Silica Aerogel
.
Water Contact Angle of Prepared Silica Aerogel
Where γsv and γsl represent the solid-vapor and the solid–liquid, respectively, and γlv denotes the vapor-liquid interfacial energies. The θ parameter shows the angle of the solid surface and water drop. Accordingly, solids with contact angles smaller than 90° have higher surface energy, indicating that the water droplet dispersed on the surface. On the other hand, water droplets will make a contact angle superior to 90° in the materials with lower surface energy (16). Surface-free energy and hydrophobicity are associated reversely. Therefore, materials with lower surface-free energy will be aquaphobic, while hydrophilic materials will have higher surface energy. Surface-free energy can be calculated from Fowkes theory (17). For this purpose, the angle of contact of completely dispersive liquid (e.g., di-iodomethane) and frigid solvents (e.g., water) was obtained, and the total surface-free energy was calculated using Eqs. (4) and (5):
Where
is the surface energies related to methylene iodide, and
represents the surface energies related to water. Moreover, θd and θp are the angles of contact of methylene iodide and water, respectively. The total interfacial free energy will be the sum of Eqs. (4) and (5). The angle of contact of methylene iodide on silica aerogel was 81.36o, which corresponds to 54.59 mJ/m2 surface free energy.
The Schiff base reaction was conducted to investigate the density of loaded amine and amine release rate from prepared samples (Section 2.3). As was reported in our previous works (8,13), the pure 2.5% APTES (0.01M) solution had a 3.84 maximum absorbance peak at 404 nm. According to this reaction, lower absorbance is in accordance with the higher durability of synthesized adsorbent in water environments and decreased released amine in the solution. The ultraviolet-visible spectra of the supernatant of samples 1–6 after reacting with ethanol are shown in Fig. S1 and compared with the pure 2.5% APTES solution. According to experimental results, the order of released amine was as sample 1 > sample 3 > sample 5 > sample 4 > sample 6 > sample 2. The maximum absorbance value for sample 2 was 0.01, demonstrating that only 0.026% of grafted amine was released into the solution. Based on the results, sample 2 revealed extremely low amine release (the maximum absorbance of 0.01), indicating the high stability of the loaded amine and the desirable performance of the employed grafting method. Overall, our findings well prove that the APTES successfully loaded on PDSA with an insignificant percolating and high durability by the time-consuming, simple, and inexpensive ultrasonic method. Complete grafting of the 2.50% APTES could extend the surface coverage of 6.54 μmol/m2 (18). In this regard, the grafting method for sample 2 rendered about 6.54 micromoles amine per square meter of PDSA surface. This high loading value is indicative of the attached APTES to the surface of aerogel via both ionic and covalent bonding (19). On the other hand, in the monolayer coverage, each APTES molecule occupies about 50 square angstroms (3.32 μmol/m2). Therefore, it could be assumed that the multilayer APTES coverage of the PDSA occurred in our experiments (20). This can be attributed to the fact that the fast hydrolysis and condensation of APTES in the polar solution decrease the activity of APTES, followed by the agglomeration of APTES oligomers. Thus, the use of a non-polar solvent, such as toluene, can be helpful (12). The second reason is the ultrasound irradiation at elevated temperatures, which could facilitate the fast hydrolysis of APTES, render more available ethoxy groups, expand the PDSA pores, and penetrate APTES molecules to the endmost attaching sites (21). Hence, using the proposed ultrasonic method, higher amounts of amine will be grafted on the PDSA surface than that reported in previously published studies (18). Due to the high amine density and stability, sample 2 was selected and used in our future experiment.
Fig. S2 illustrates the XRD pattern of prepared samples (PDSA and AMPDSA). Accordingly, a sharp peak at 2θ = 27.9o of samples is related to phillipsite, a natural zeolite present in the sample. XRD patterns with a hump between 2θ = 20° and 40° also indicate the amorphous structure of both samples (14). After APTES grafting, the pattern did not change, implying that the APTES grafting step had no effect on phase structure (22).
Fig. 2 displays the N2 adsorption-desorption curve and hole size extension of prepared samples (PDSA and AMPDSA). The specific surface area of 989 m2/g, hole volume of 5.29 cm3/g, and average pore diameter of 21.67 nm were recorded for PDSA. In agreement with the International Union of Pure and Applied Chemistry guidelines, a type IV isotherm pattern with H3 hysteresis loops was observed, which is a common specification of mesoporous adsorbents having notch-shaped holes or disc-like particles. The pore size distribution of PDSA varied between 1 nm and 100 nm, with a peak at 22 nm, which further demonstrates the mesoporous structure of the sample (23). In addition, the desorption isotherm did not reach zero and stayed continually at p/po = 0.3. This may be due to the trapped nitrogen in aerogel pores (24). A specific surface of 832 m2/g, a hole volume of 3.84 cm3/g, and an average pore diameter of 12.39 nm were detected after amine grafting. These reductions are due to the filling of AMPDSA pores with the APTES molecules (12). No additional change was observed in the adsorption-desorption isotherm and hysteresis loops of AMPDSA, indicating that ultrasonic grafting did not result in any gas adsorption behavior. On the other hand, the presence of hysteresis loops in both samples revealed that capillary pucker happening in the mesoporous of the samples resulted in the finite uptake of gas at a relatively high pressure (22). Furthermore, the presence of point B demonstrated infinite multilayer-monolayer adsorption, at which monolayer adsorption was finished but multilayer adsorption was initiated (14).
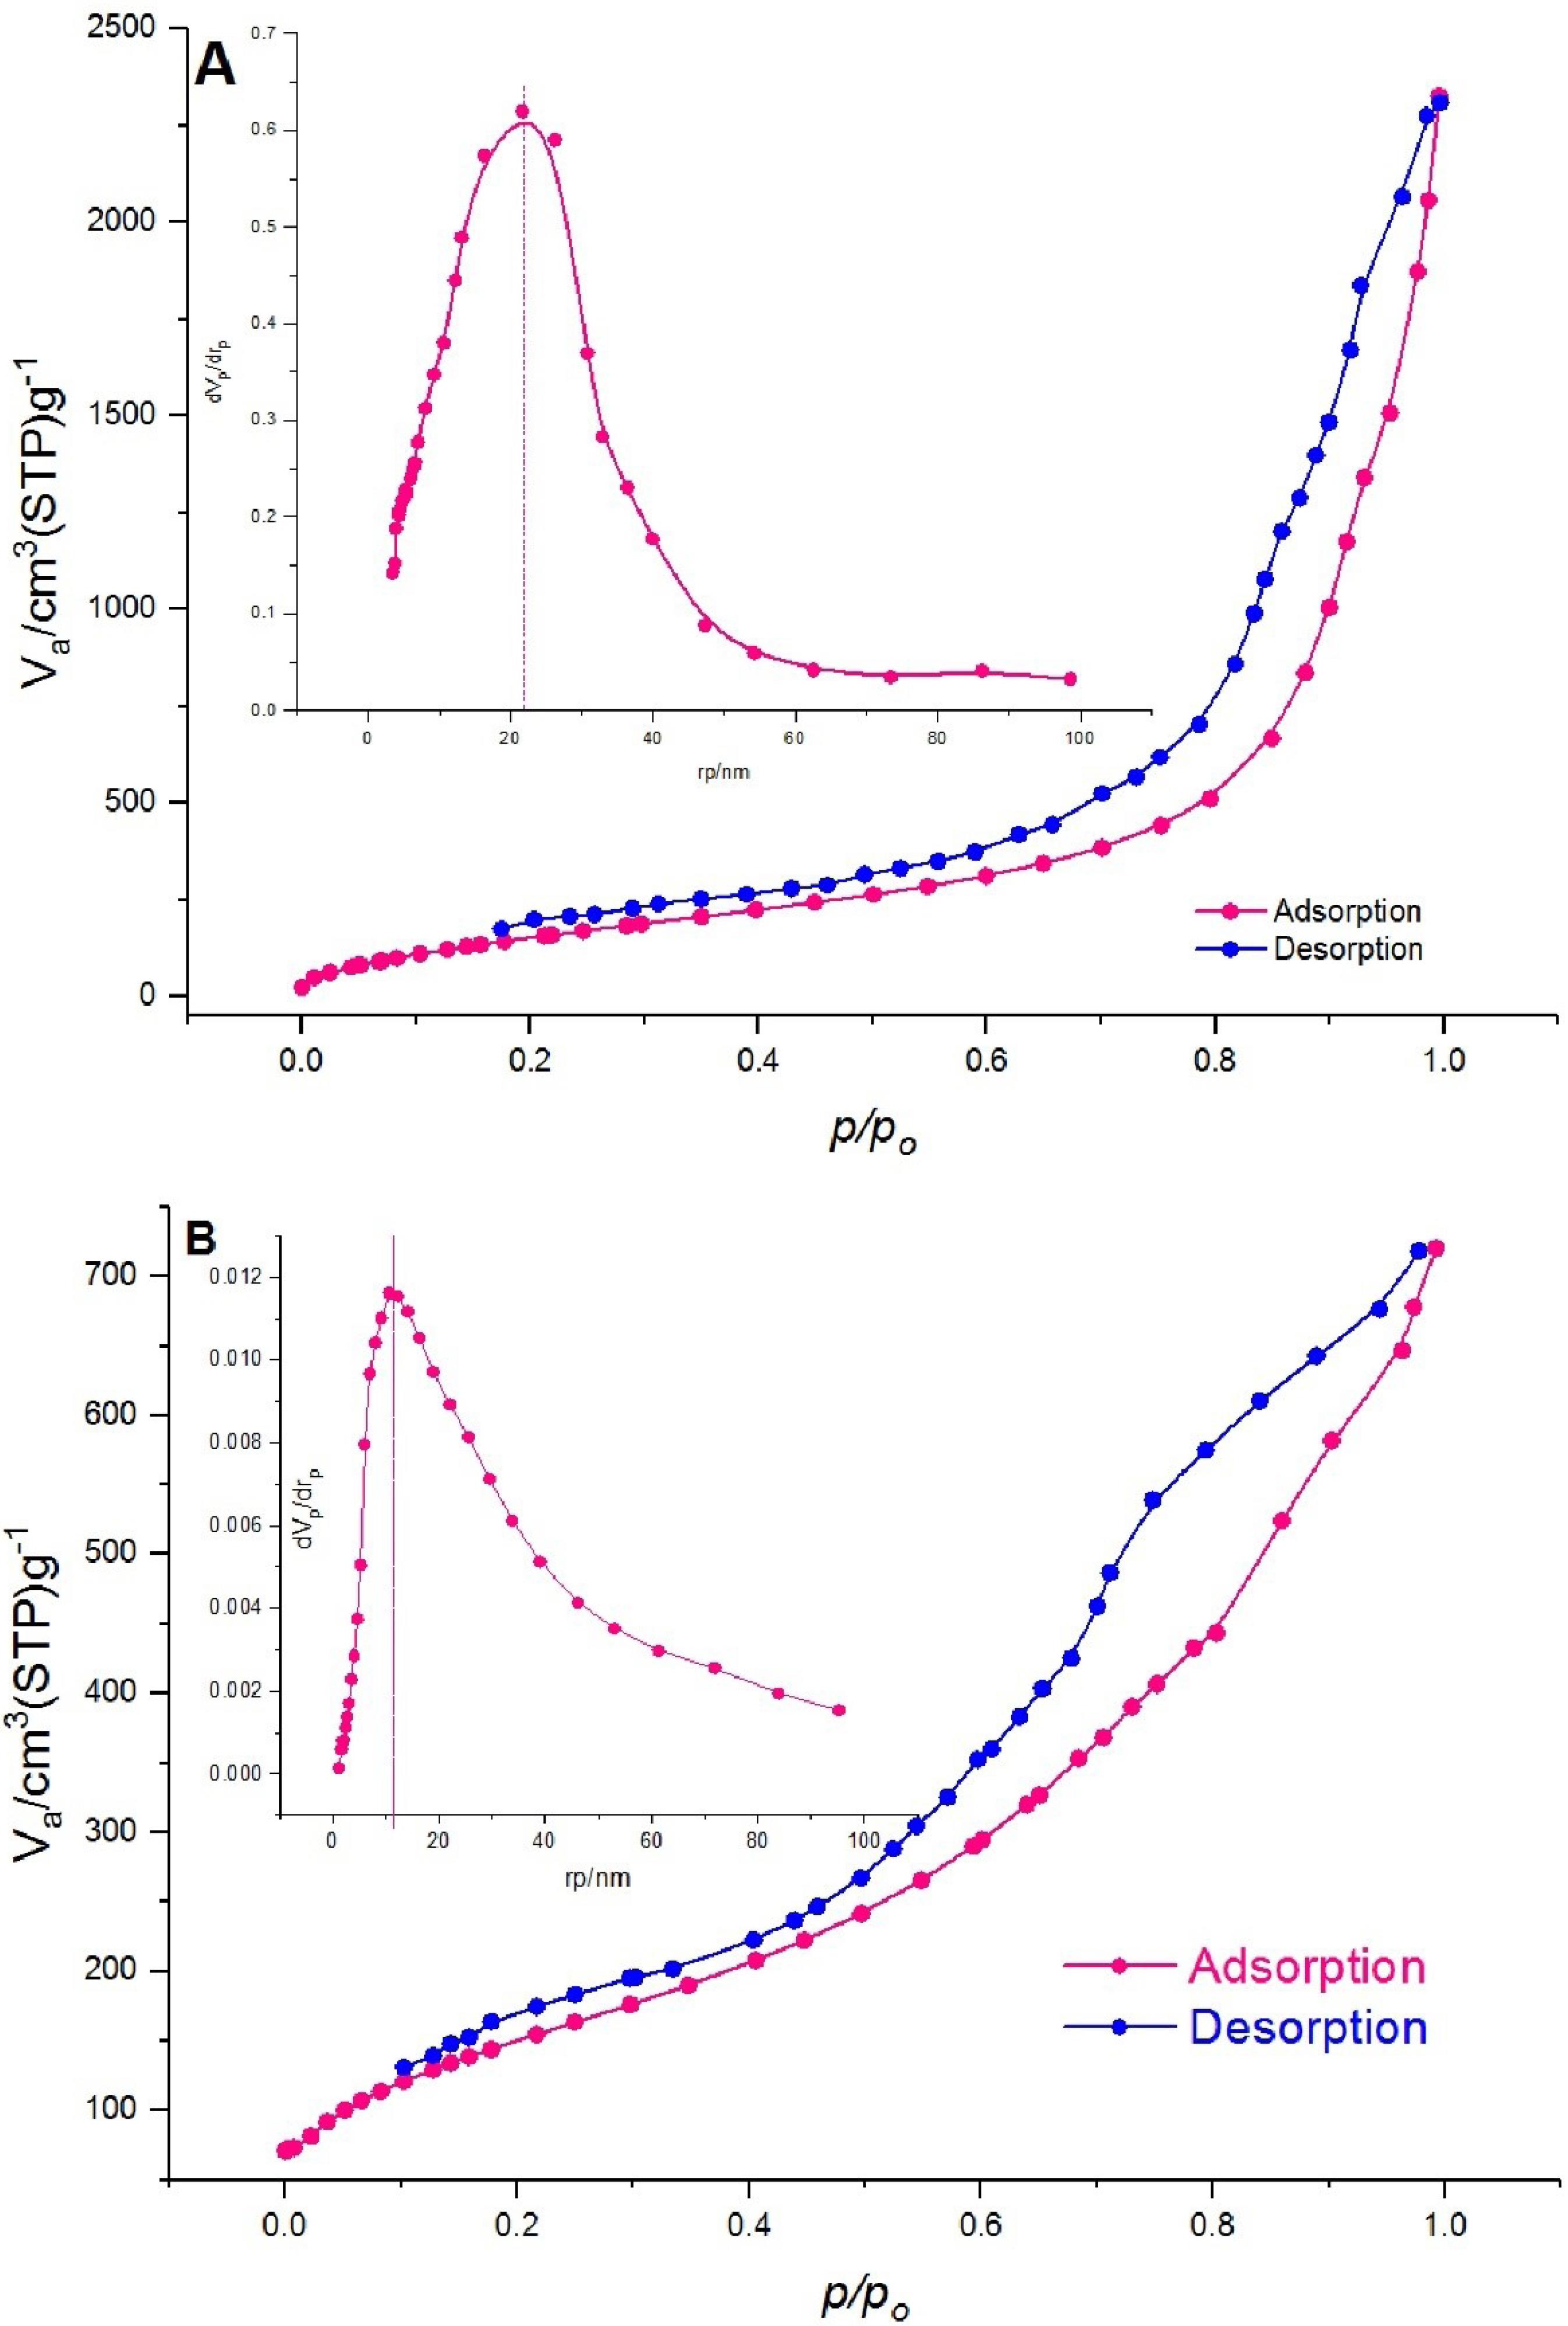
Fig. 2.
Nitrogen Adsorption-Desorption Isotherm of PDSA (A) and AMPDSA (B). Note. PDSA: Pumice-derived silica aerogel; AMPDSA: Amine-functionalized pumice-derived silica aerogel
.
Nitrogen Adsorption-Desorption Isotherm of PDSA (A) and AMPDSA (B). Note. PDSA: Pumice-derived silica aerogel; AMPDSA: Amine-functionalized pumice-derived silica aerogel
Fig. 3 depicts the FESEM, TEM, and mapping of prepared samples (PDSA and AMPDSA). The textural properties of PDSA and sol-gel prepared AMPDSA were well described in our previous works (8,13). Similarly, more sphere-like morphology with an average diameter of less than 25 nm and any aggregation was observed in the present work due to the well surface treatment and more methyl groups of HMDS, preventing pucker and aggregation (Fig. 3A). Fig. 3B shows the surface morphology of ultrasonic-assisted amine-grafted PDSA. As expected, the morphology of the modified PDSA did not change under 80 kHz frequency and 100% power. Despite the slight reduction in specific surface (Fig. 2B), sonication led to more bridge formation between the aerogel spinal column and APTES groups (3). Figs. 3C and 3D depict the TEM of PDSA and AMPDSA. The TEM image displays the more specified pearl-like structure for PDSA, which is stated for water glass-based aerogel (Fig. 3C). Subsequently, more agglomeration and heterogeneity were observed for AMPDSA (Fig. 3D). Figs. 3E and 3F illustrate the mapping of PDSA and AMPDSA, respectively. The presence of nitrogen was well demonstrated in the structure of AMPDSA, confirming the ultrasonic grafting method.
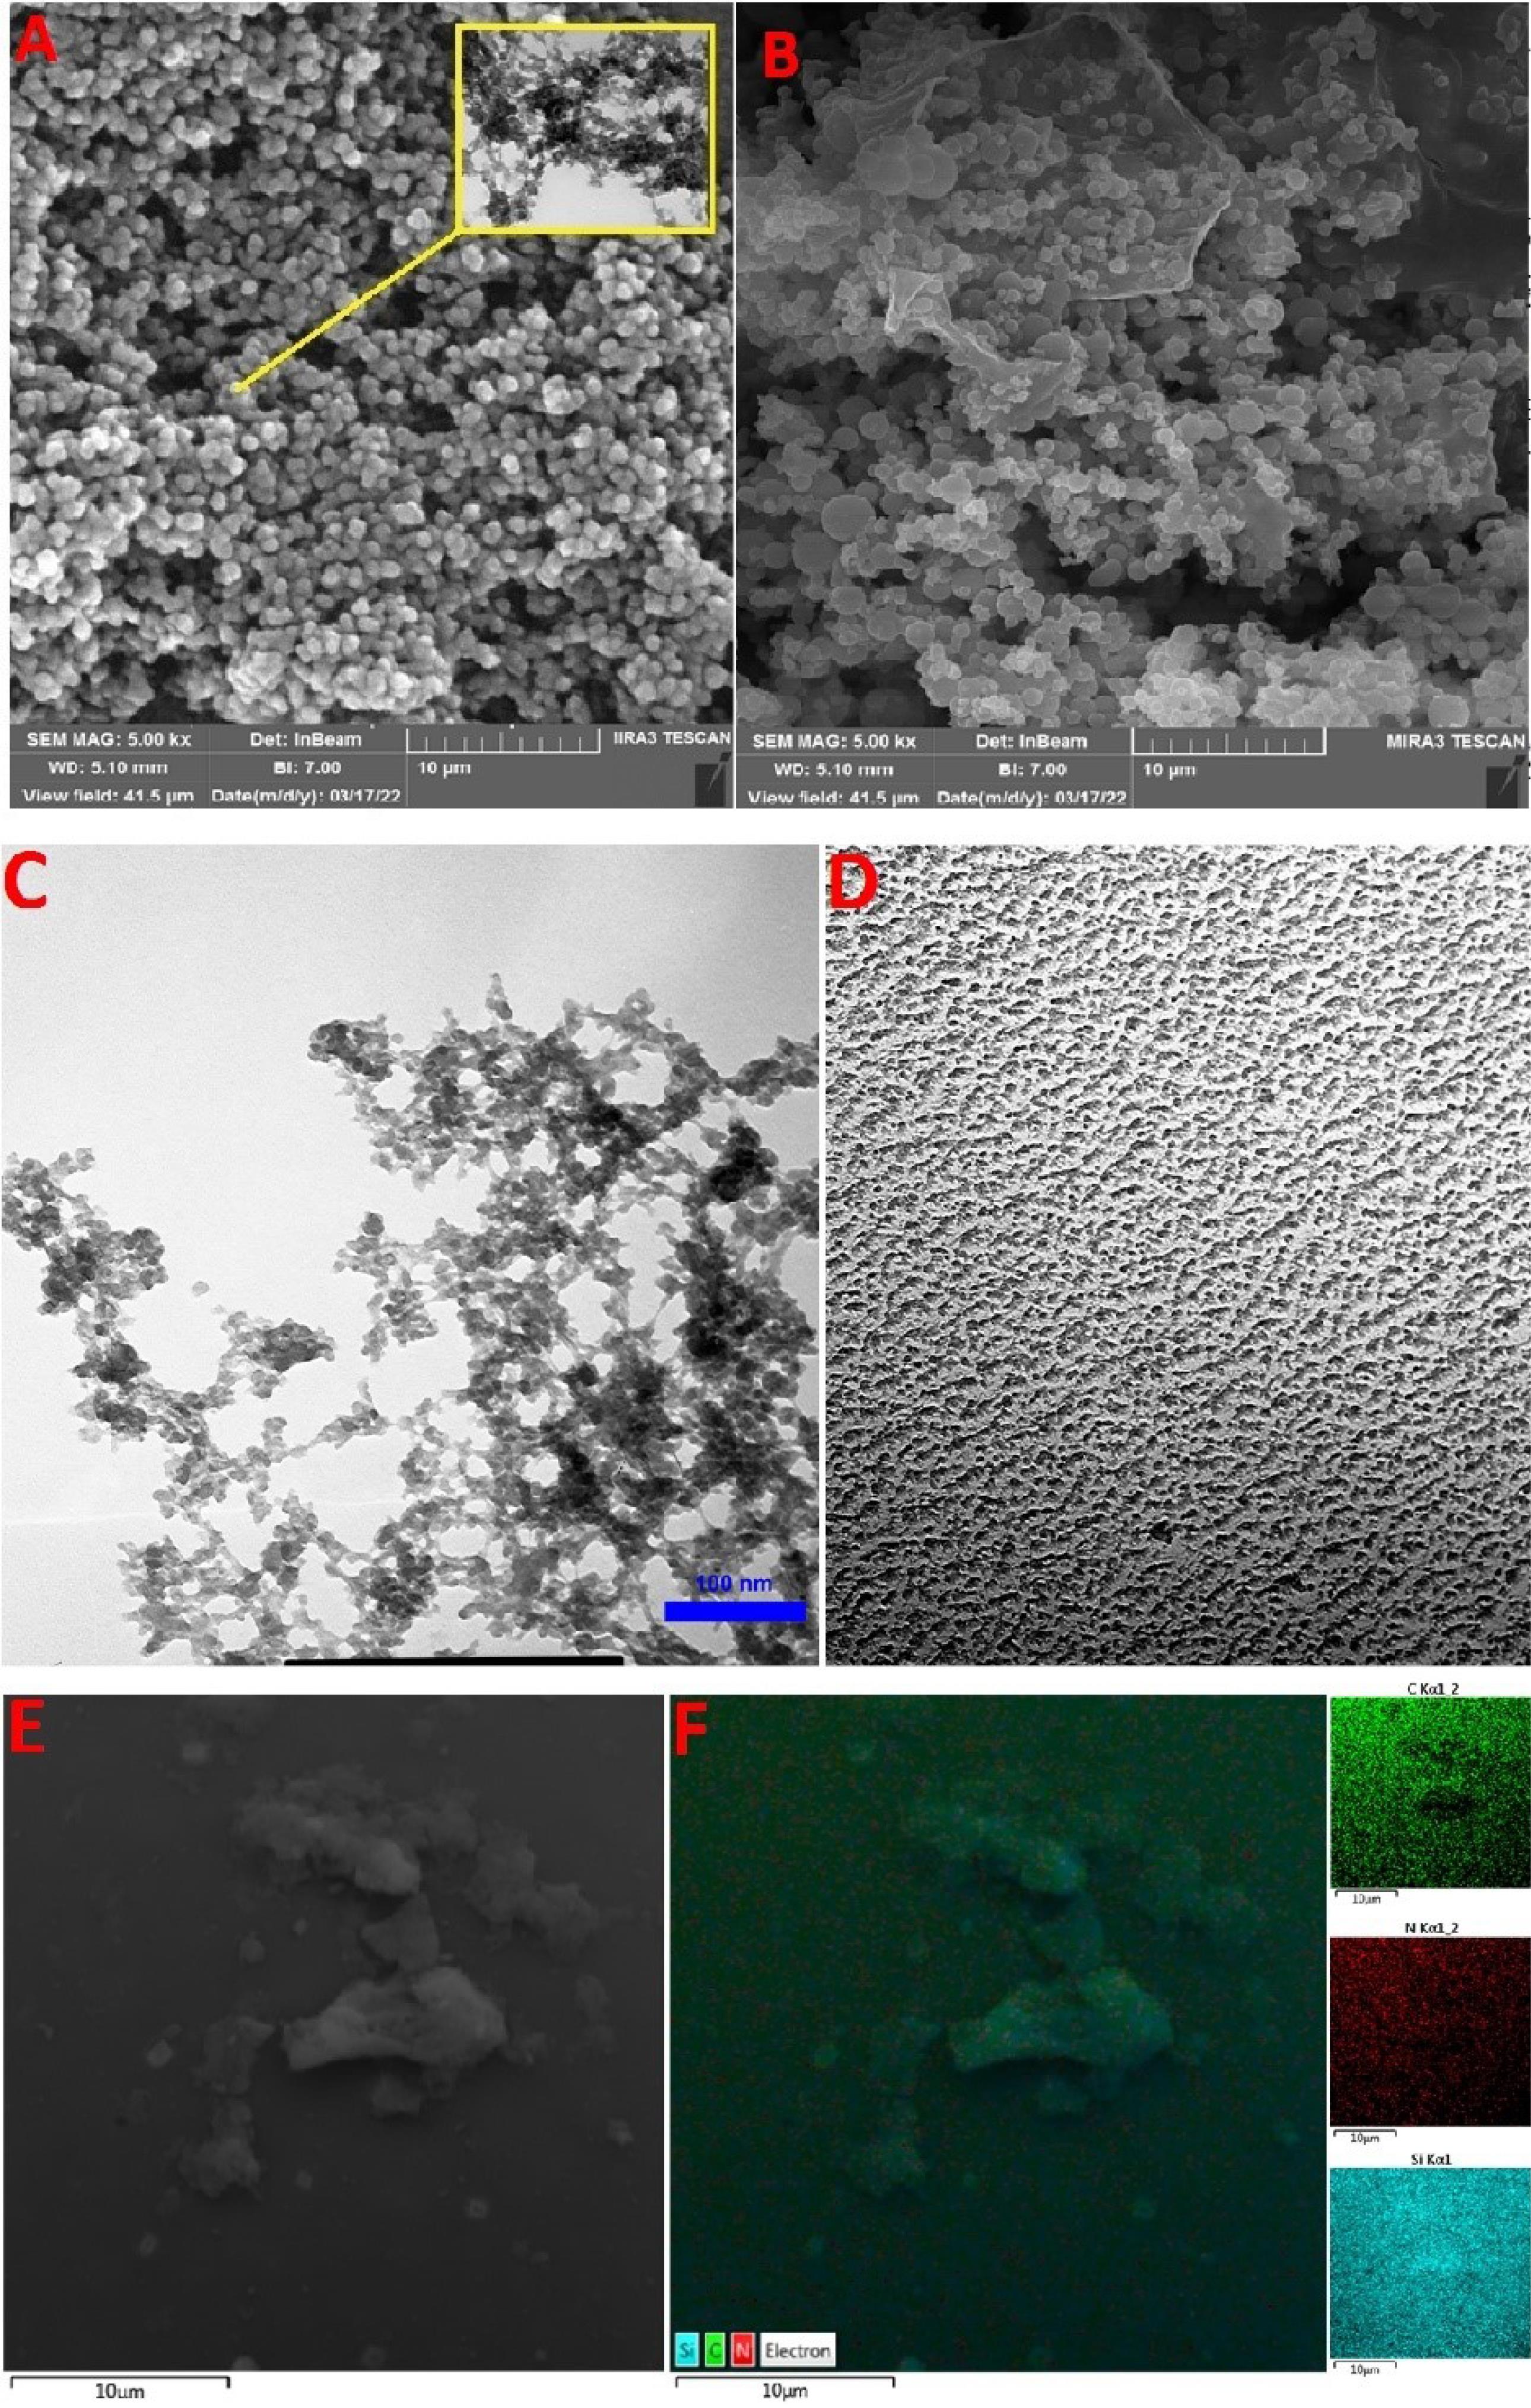
Fig. 3.
FESEM of PDSA (A), AMPDSA (B), TEM of PDSA (C), AMPDSA (D), Mapping of PDSA (E), and AMPDSA (F). Note. FESEM: Field emission scanning electron microscopy; PDSA: Pumice-derived silica aerogel; AMPDSA: Amine functionalized pumice-derived silica aerogel; TEM: Transmission electron microscopy
.
FESEM of PDSA (A), AMPDSA (B), TEM of PDSA (C), AMPDSA (D), Mapping of PDSA (E), and AMPDSA (F). Note. FESEM: Field emission scanning electron microscopy; PDSA: Pumice-derived silica aerogel; AMPDSA: Amine functionalized pumice-derived silica aerogel; TEM: Transmission electron microscopy
The FTIR spectrum of PDSA and AMDPSA is shown in Fig. S3. According to the results, the PDSA had characteristic peaks at the wavenumbers of 775.24 cm-1, 1079.08 cm-1, 1276.64 cm-1, and 2900–3000 cm-1. The peaks at 775.24 cm-1 and 1276.64 cm-1 can be related to Si–CH3 groups of HMDS on the PDSA surface (3). In addition, the characteristic peak at 1079.08 cm-1 can be assigned to the symmetric bending of the Si-O-Si groups. Moreover, the narrow and weak peaks observed at 2900–3000 cm-1 are attributed to the Si–OH and Si–H2O groups and the physisorbed water molecules on the surface of the silica-based aerogel (9). After APTES grafting, various characteristic peaks were detected, which can be related to the stretching and binding vibration of aliphatic carbon and amine groups in the structure of loaded APTES. The peak at 461.39 cm-1 is due to the symmetric stretching vibration of the Si-O-Si groups. A sharp peak appeared at 1043.10 cm-1, which can be attributed to the unhydrolyzed ethoxy (–OCH2 CH3) groups of APTES molecules (10). A narrow peak that appeared at 1632.77 cm-1 is due to a symmetric vibration of the NH2 groups in the APTES structure. Additionally, the peaks developed at 2352.72 cm-1 in PDSA and AMPDSA samples are due to the Si–H stretching vibrations (11). A wide and relatively sharp peak at 3433.52 cm-1 can be specified for the N-H stretch of amino groups (15).
3.2. Arsenate Adsorption Modeling
Table S1 provides the predicted and experimental data with percent errors of responses for all batch experiments as well as with definite residuals. By fitting the designed parameters and the responses given in Table S1 onto multiple non-linear regression analyses, the second-order polynomial equations in un-coded form (real values) were obtained for modeling As adsorption using Eq. (6) as follows:
(6)
The analysis of variance was performed to test the significance of the fit of the second-order polynomial equation on adsorption data, the results of which are listed in Table S2. The analysis of the variance of the regression models well confirmed the high significance of quadratic models, as was obvious from the Fisher F-test conducted (F = 72.91) with a very small P value (P < 0.05). In addition, the model, which was not remarkable based on a lack of fit (11.23 > 0.05), well demonstrated the good fitness of the model.
The residuals between predicted and experimental values were extremely small, which is evident from the good compromise between predicted and observed values, as well as the points raceme around the oblique line (Fig. S4).
To better describe the concepts of independent variables (A, B, and C) and their interactions (A vs. B, A vs. C, and B vs. C) on dependent variables (Y = As removal efficiency), 2D and 3D plots for the computed responses were also developed based on uncoded equations (Eq. 6). The results are depicted in Figs. 4 to 6. As shown, all studied values demonstrated a significant effect on As removal. As adsorption capacity increased with increasing contact time and the initial As concentration. This phenomenon is most presumably due to the development of the running force gradient from the liquid toward the surface adsorbent to prevail over the mass transfer resistance at higher As concentrations and more available adoption sites at higher adsorbent mass (1). On the other hand, As adsorption increased with increasing solution pH from 4.5 to about 7 and then decreased by increasing pH to 8.5. As reported in our previous works (8,13), the pure surface charge of the AMPDSA was positive at pH below 7.4 and negative at pH above 7.4 according to pHzpc. On the other hand, As(V) was in the anionic form (
and
) at pH below 6.97. Therefore, electrostatic interaction between the anionic species of As and the positive surface of AMPDSA was responsible for As adsorption (2). According to the used model and optimization of variables in Solver Add-Ins, complete removal of As (100%) was obtained at 120 minutes of contact time, an initial As concentration of 95.21 µg/L, and a solution pH rate of 6.85.
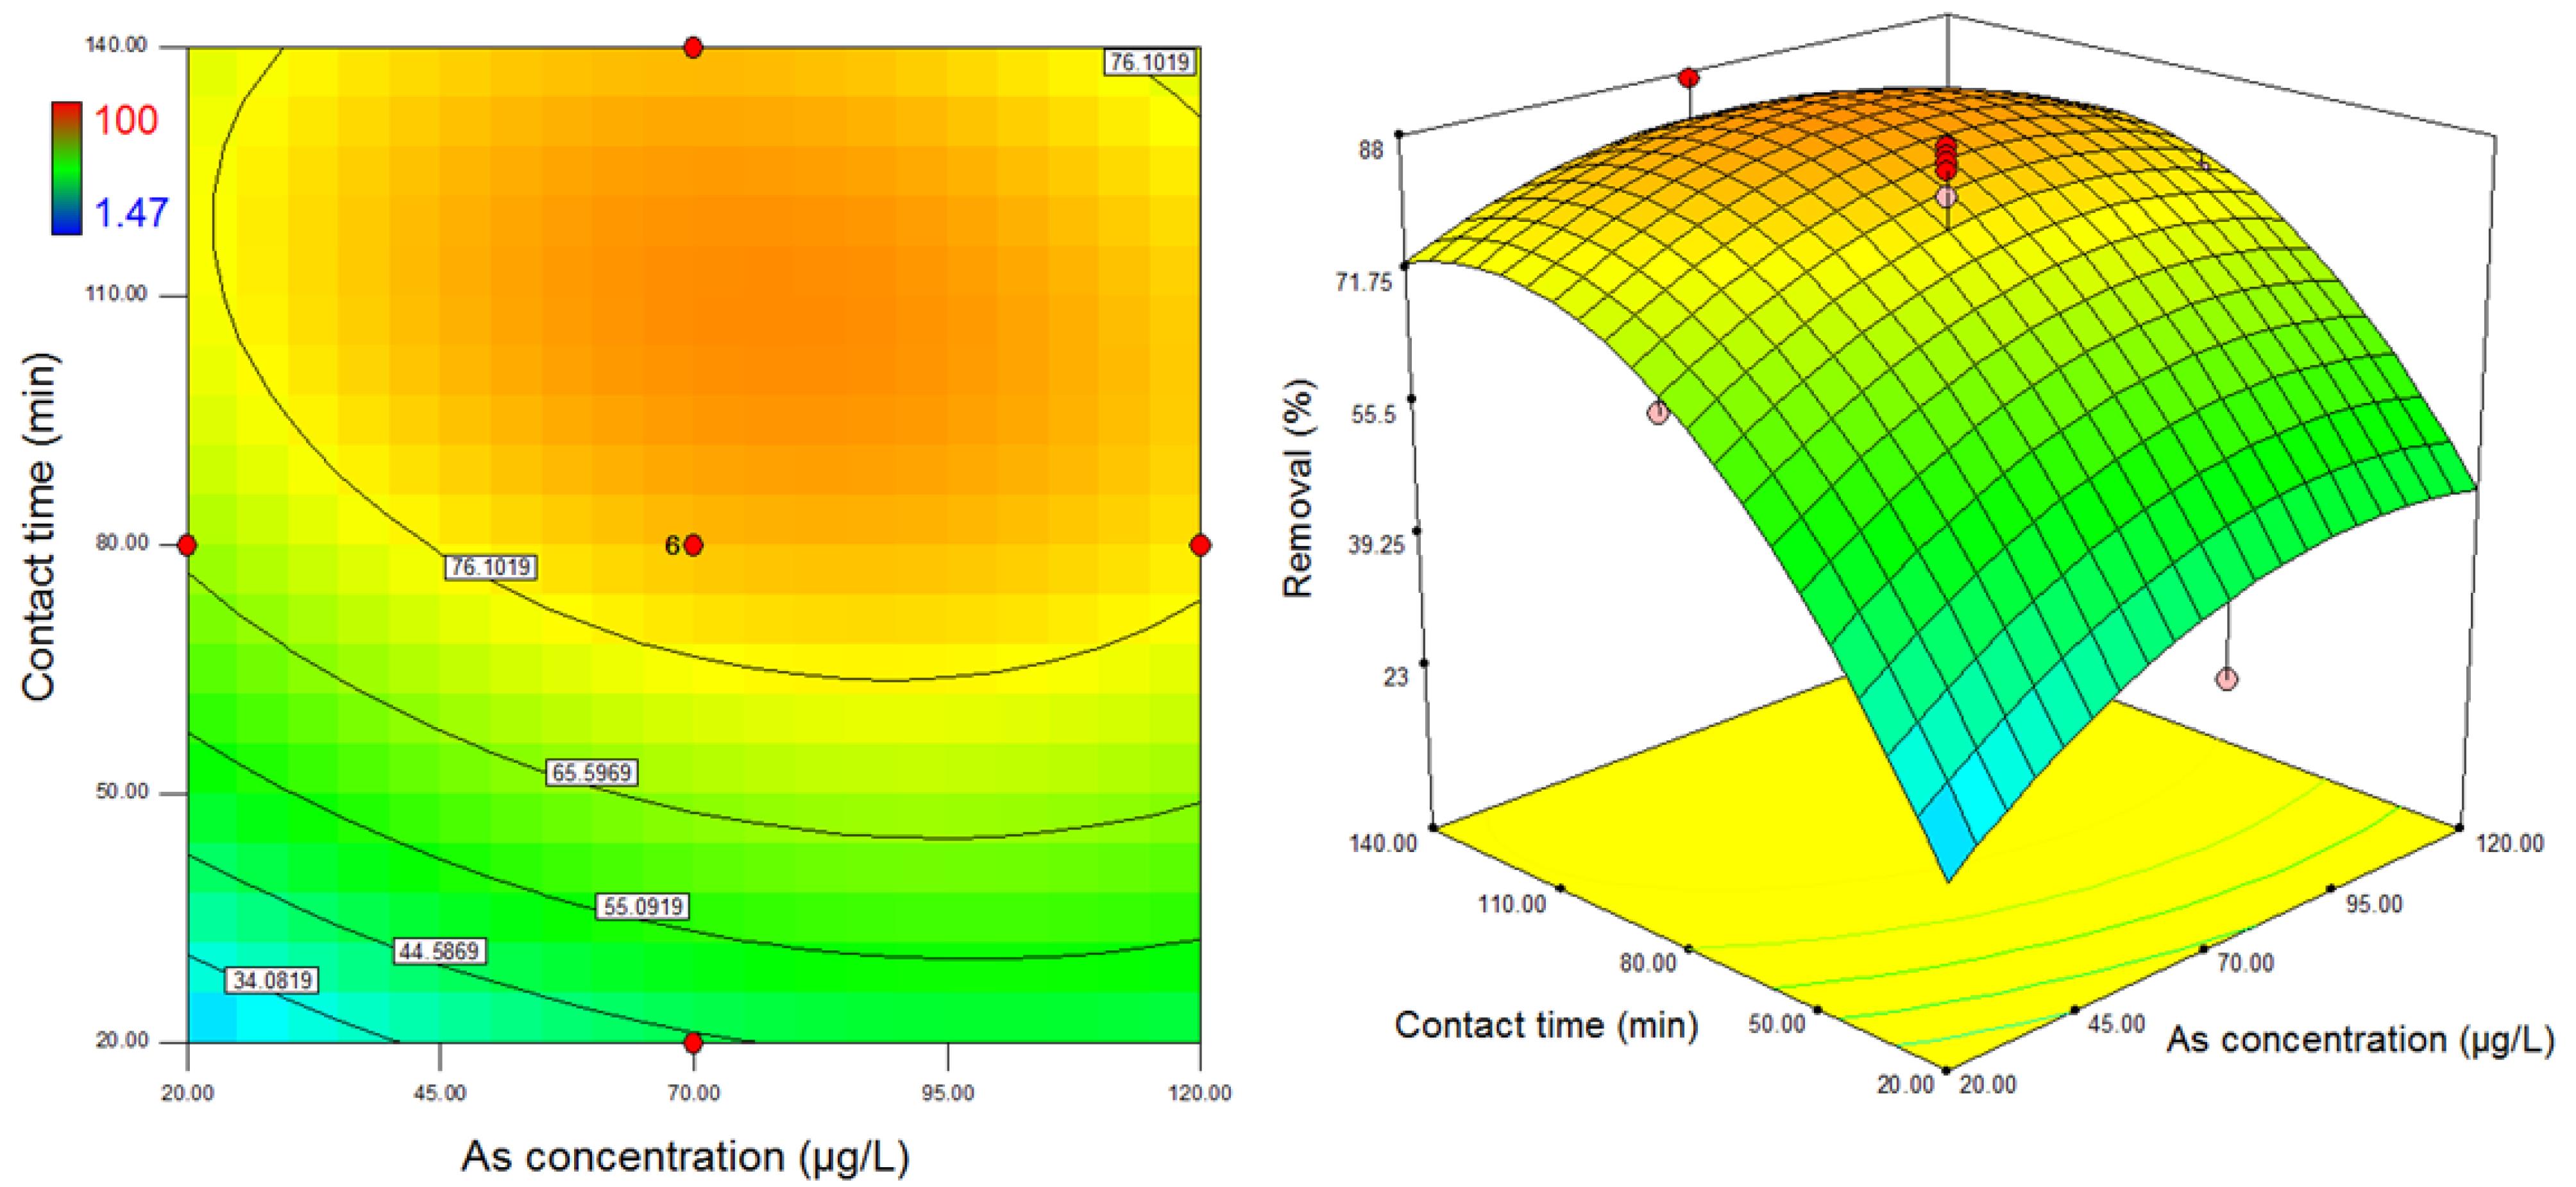
Fig. 4.
Two-Dimensional and Three-Dimensional Response Surface Diagrams Showing the Effects of Contact Time and Initial Arsenate Concentration at a pH Rate of 6.5
.
Two-Dimensional and Three-Dimensional Response Surface Diagrams Showing the Effects of Contact Time and Initial Arsenate Concentration at a pH Rate of 6.5
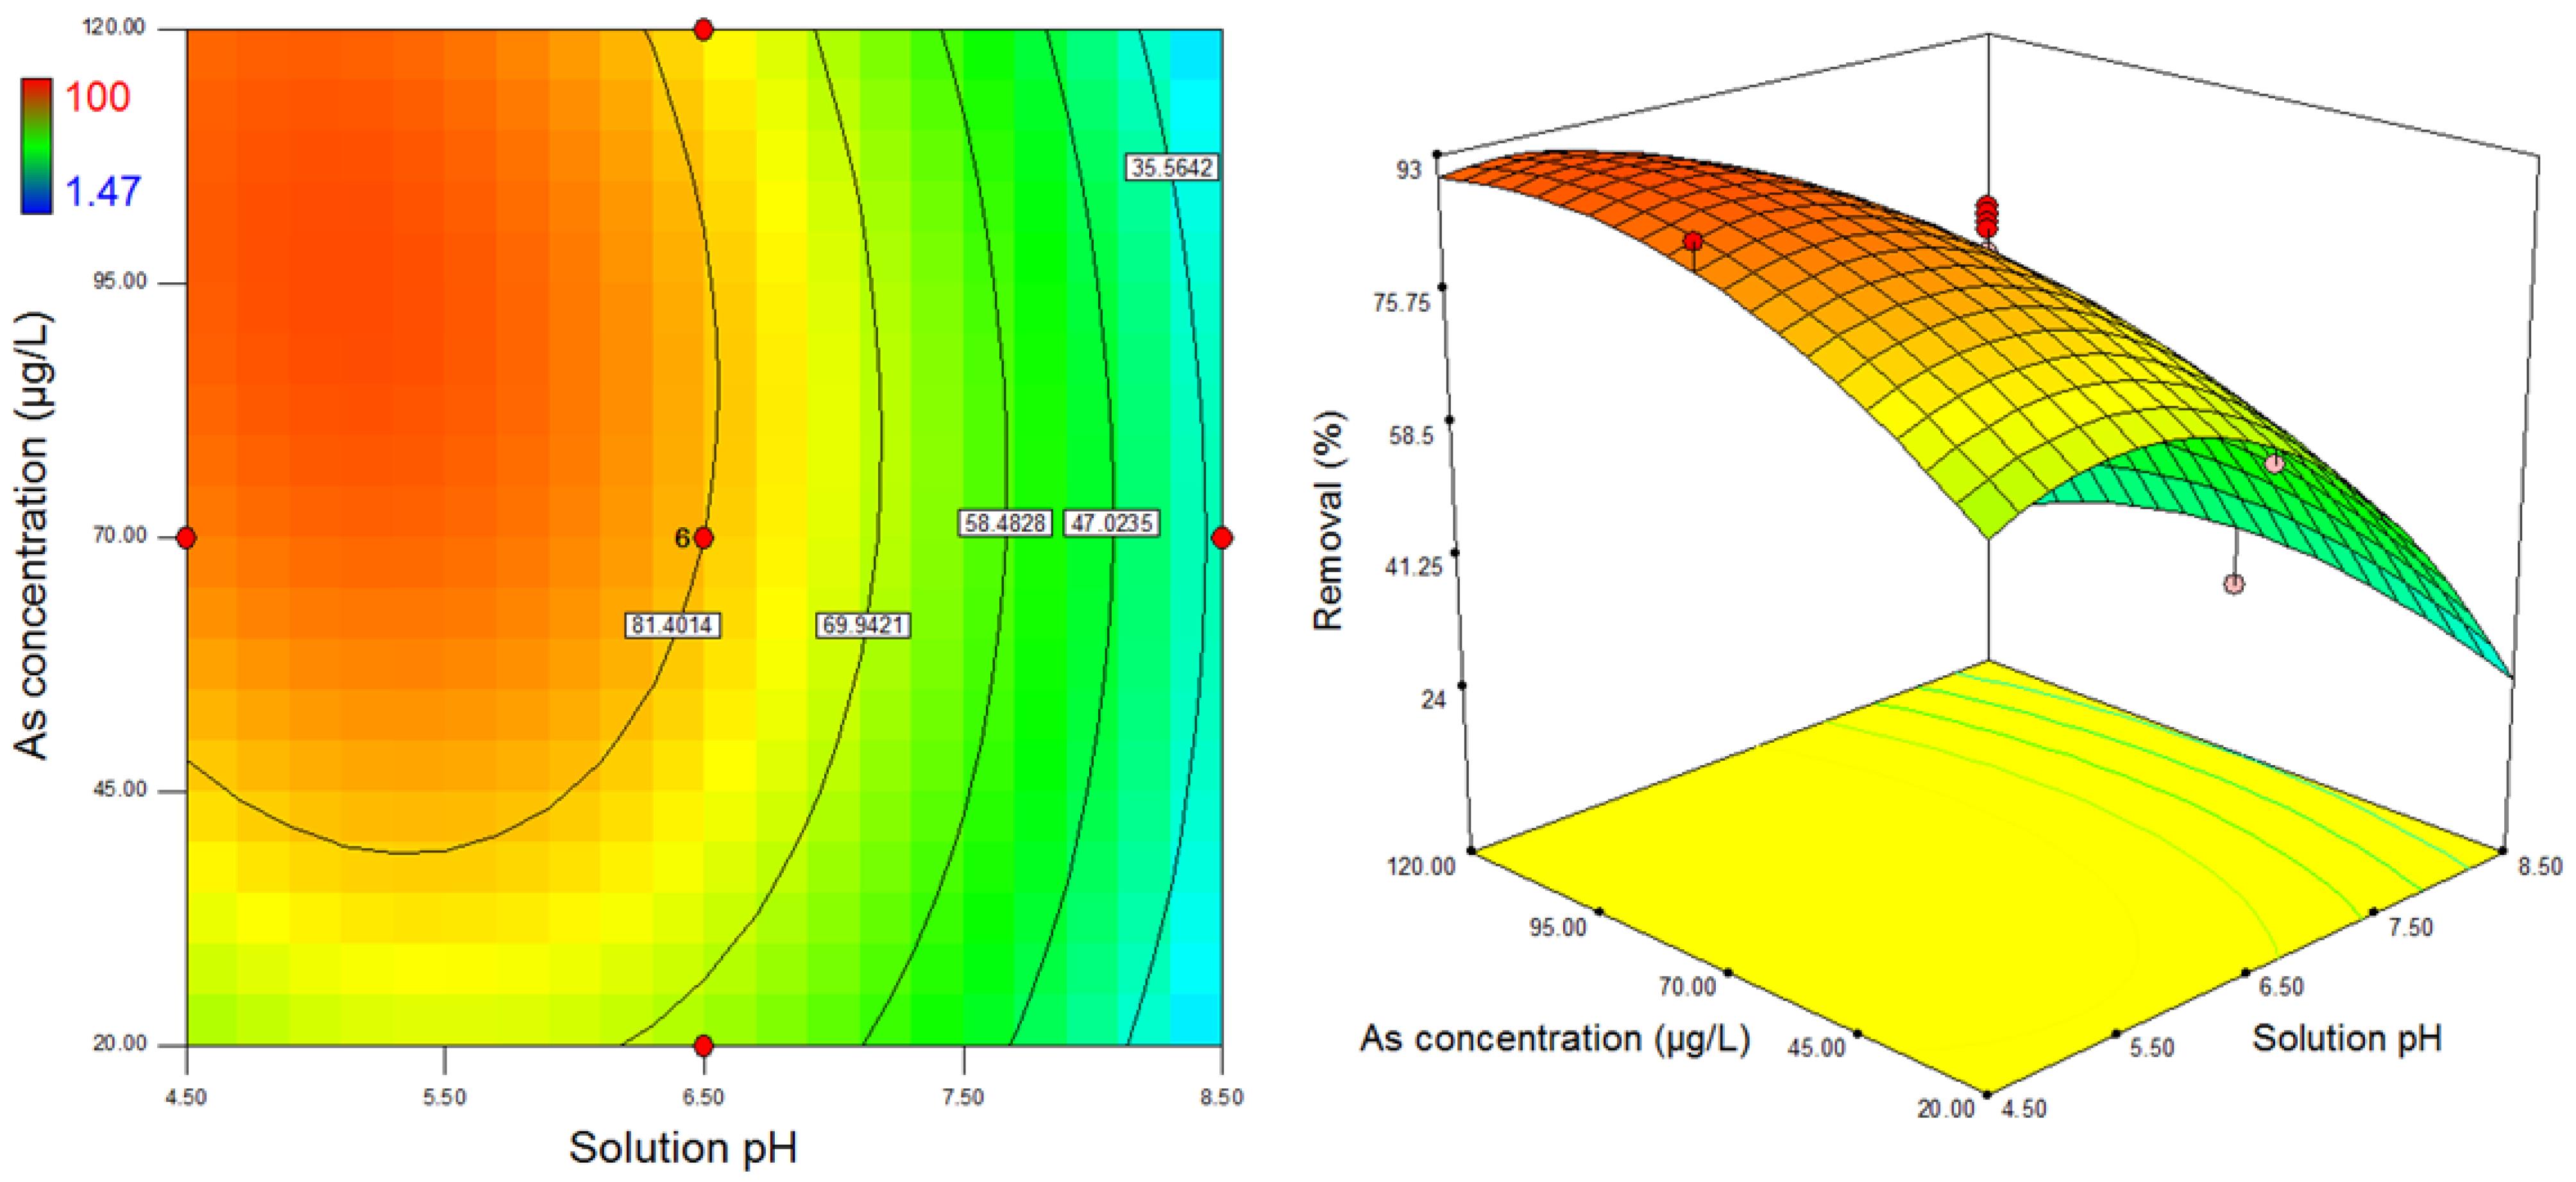
Fig. 5.
Two-Dimensional and Three-Dimensional Response Surface Diagrams Displaying the Effects of Solution pH and Initial Arsenate Concentration at the 80-Minute Reaction Time
.
Two-Dimensional and Three-Dimensional Response Surface Diagrams Displaying the Effects of Solution pH and Initial Arsenate Concentration at the 80-Minute Reaction Time
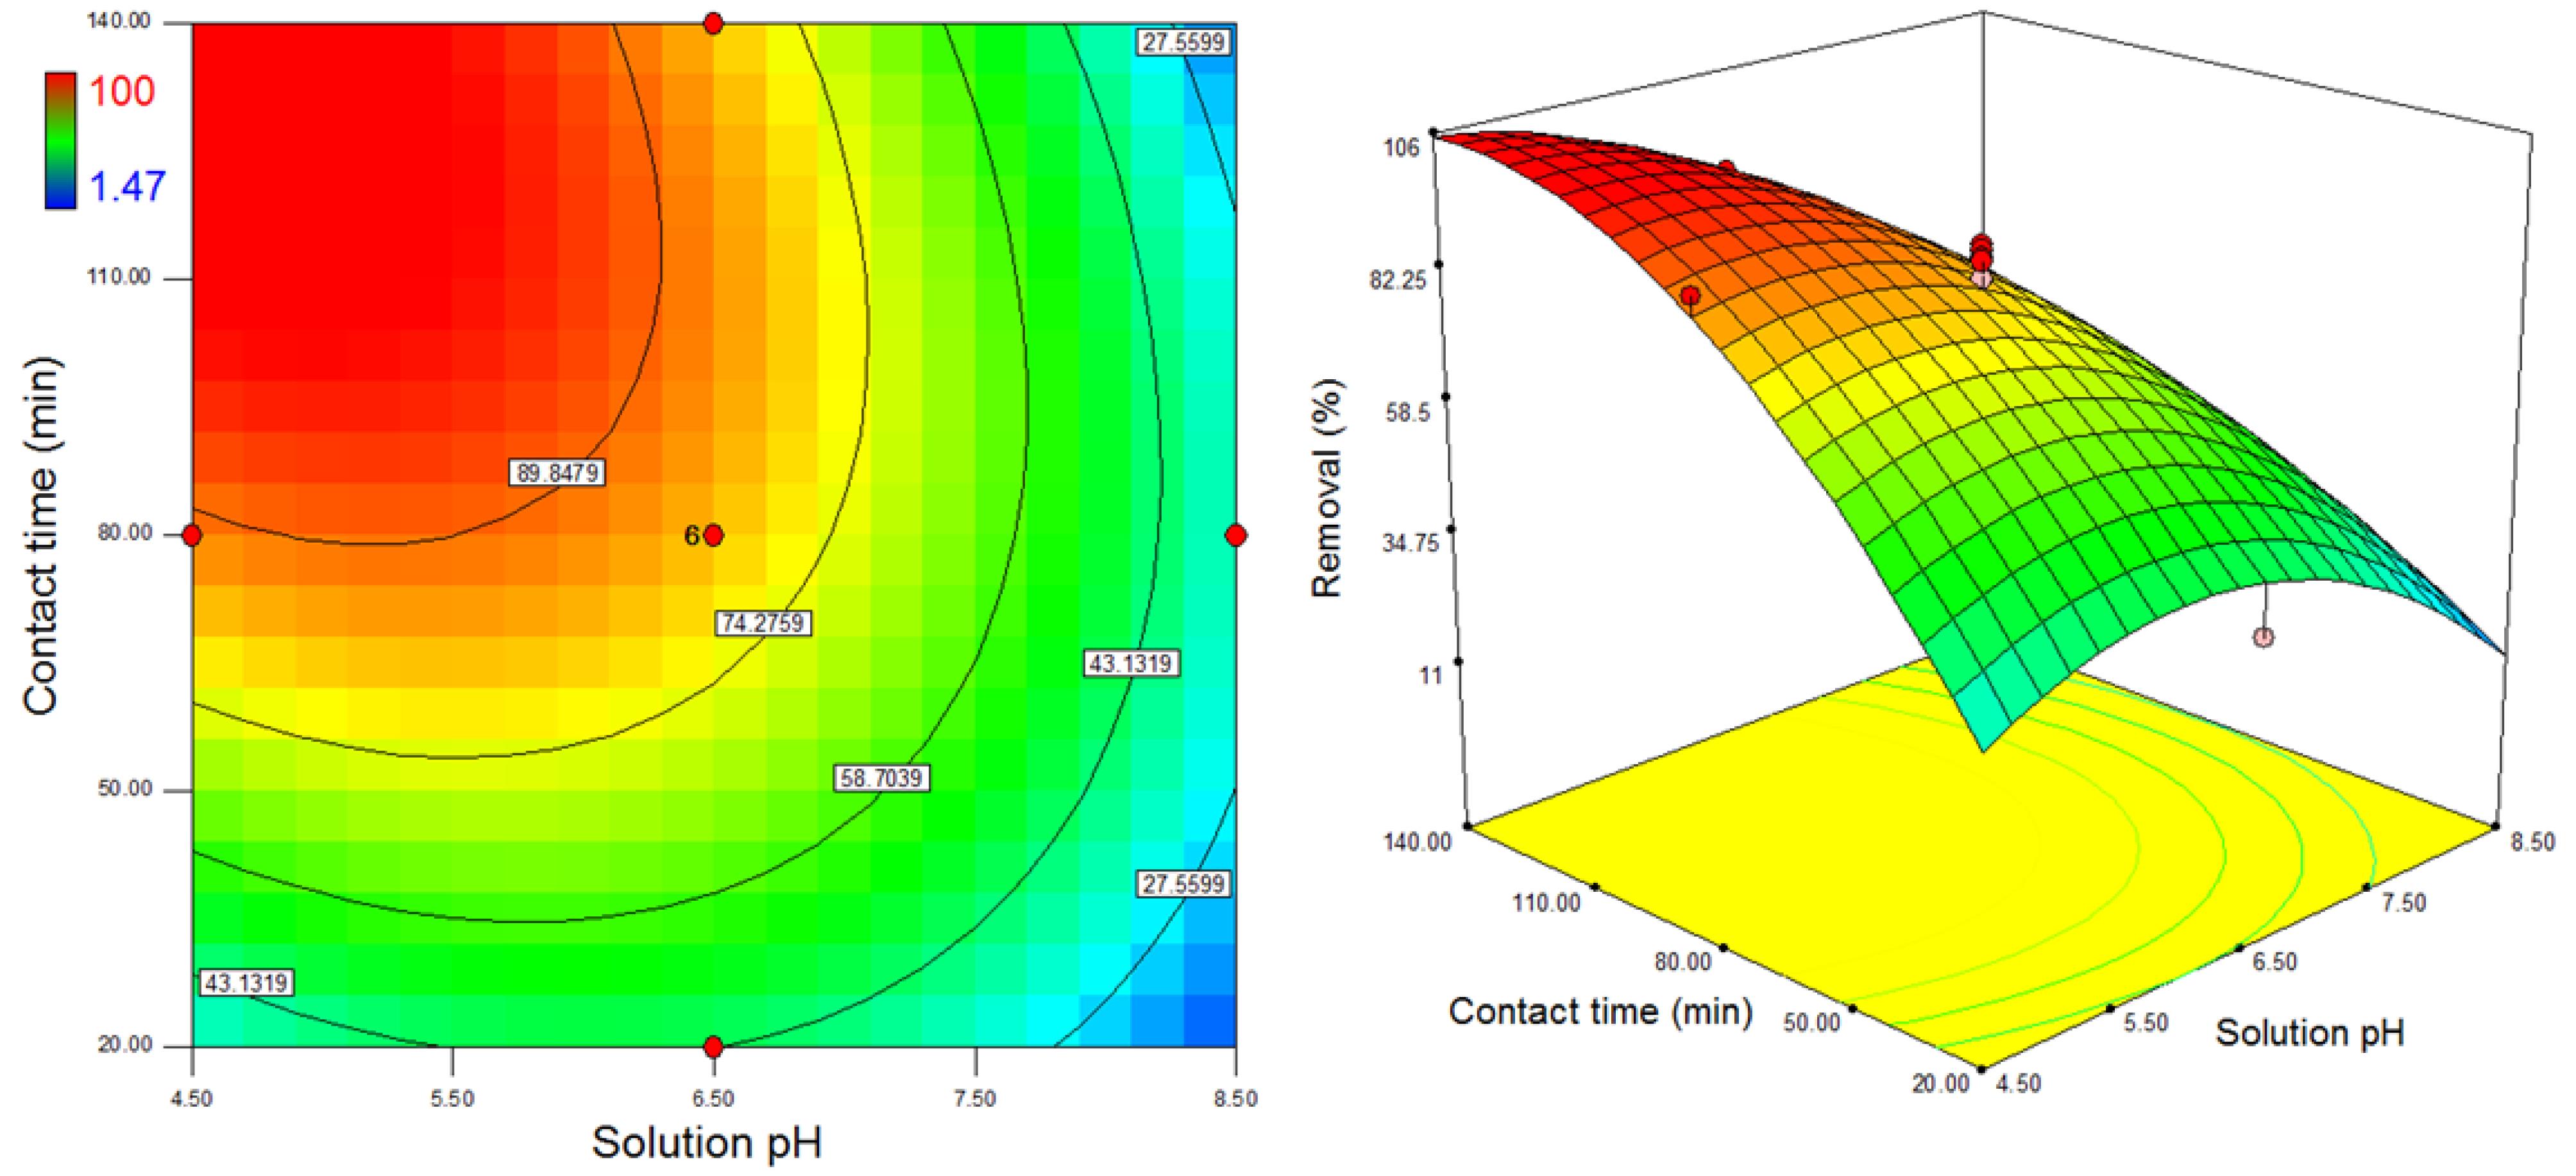
Fig. 6.
Two-Dimensional and Three-Dimensional Response Surface Diagrams Depicting the Effects of Solution pH and Reaction Time at the 70 µg/L Arsenate Concentration
.
Two-Dimensional and Three-Dimensional Response Surface Diagrams Depicting the Effects of Solution pH and Reaction Time at the 70 µg/L Arsenate Concentration
3.3. Kinetic Modeling of Arsenate Adsorption
The non-linear form of pseudo-first-order (25) and pseudo-second-order (26) kinetic models were used for better understanding the retention behavior of AMPDSA, the results of which are summarized in Table 1. As uptake rate was rapid in the first 30 minutes and reached equilibrium in 120 minutes (Fig. 7). The higher adsorption rate at the initial stage is mostly due to the strong electrostatic attraction between anionic species of As and the positive surface of AMPDSA, enhancing the formation of an inner coordination sphere. However, the two models demonstrated a higher correlation coefficient, while the pseudo-first-order model showed a lower residual sum of squares (RSS) value (Table 1). In addition, the closeness of experimental and calculated equilibrium values is another evidence that adsorption uptake obeys the pseudo-first-order model. Accordingly, chemical adsorption is most likely responsible for the retention of As(V) on the adsorption site of AMPDSA (27).
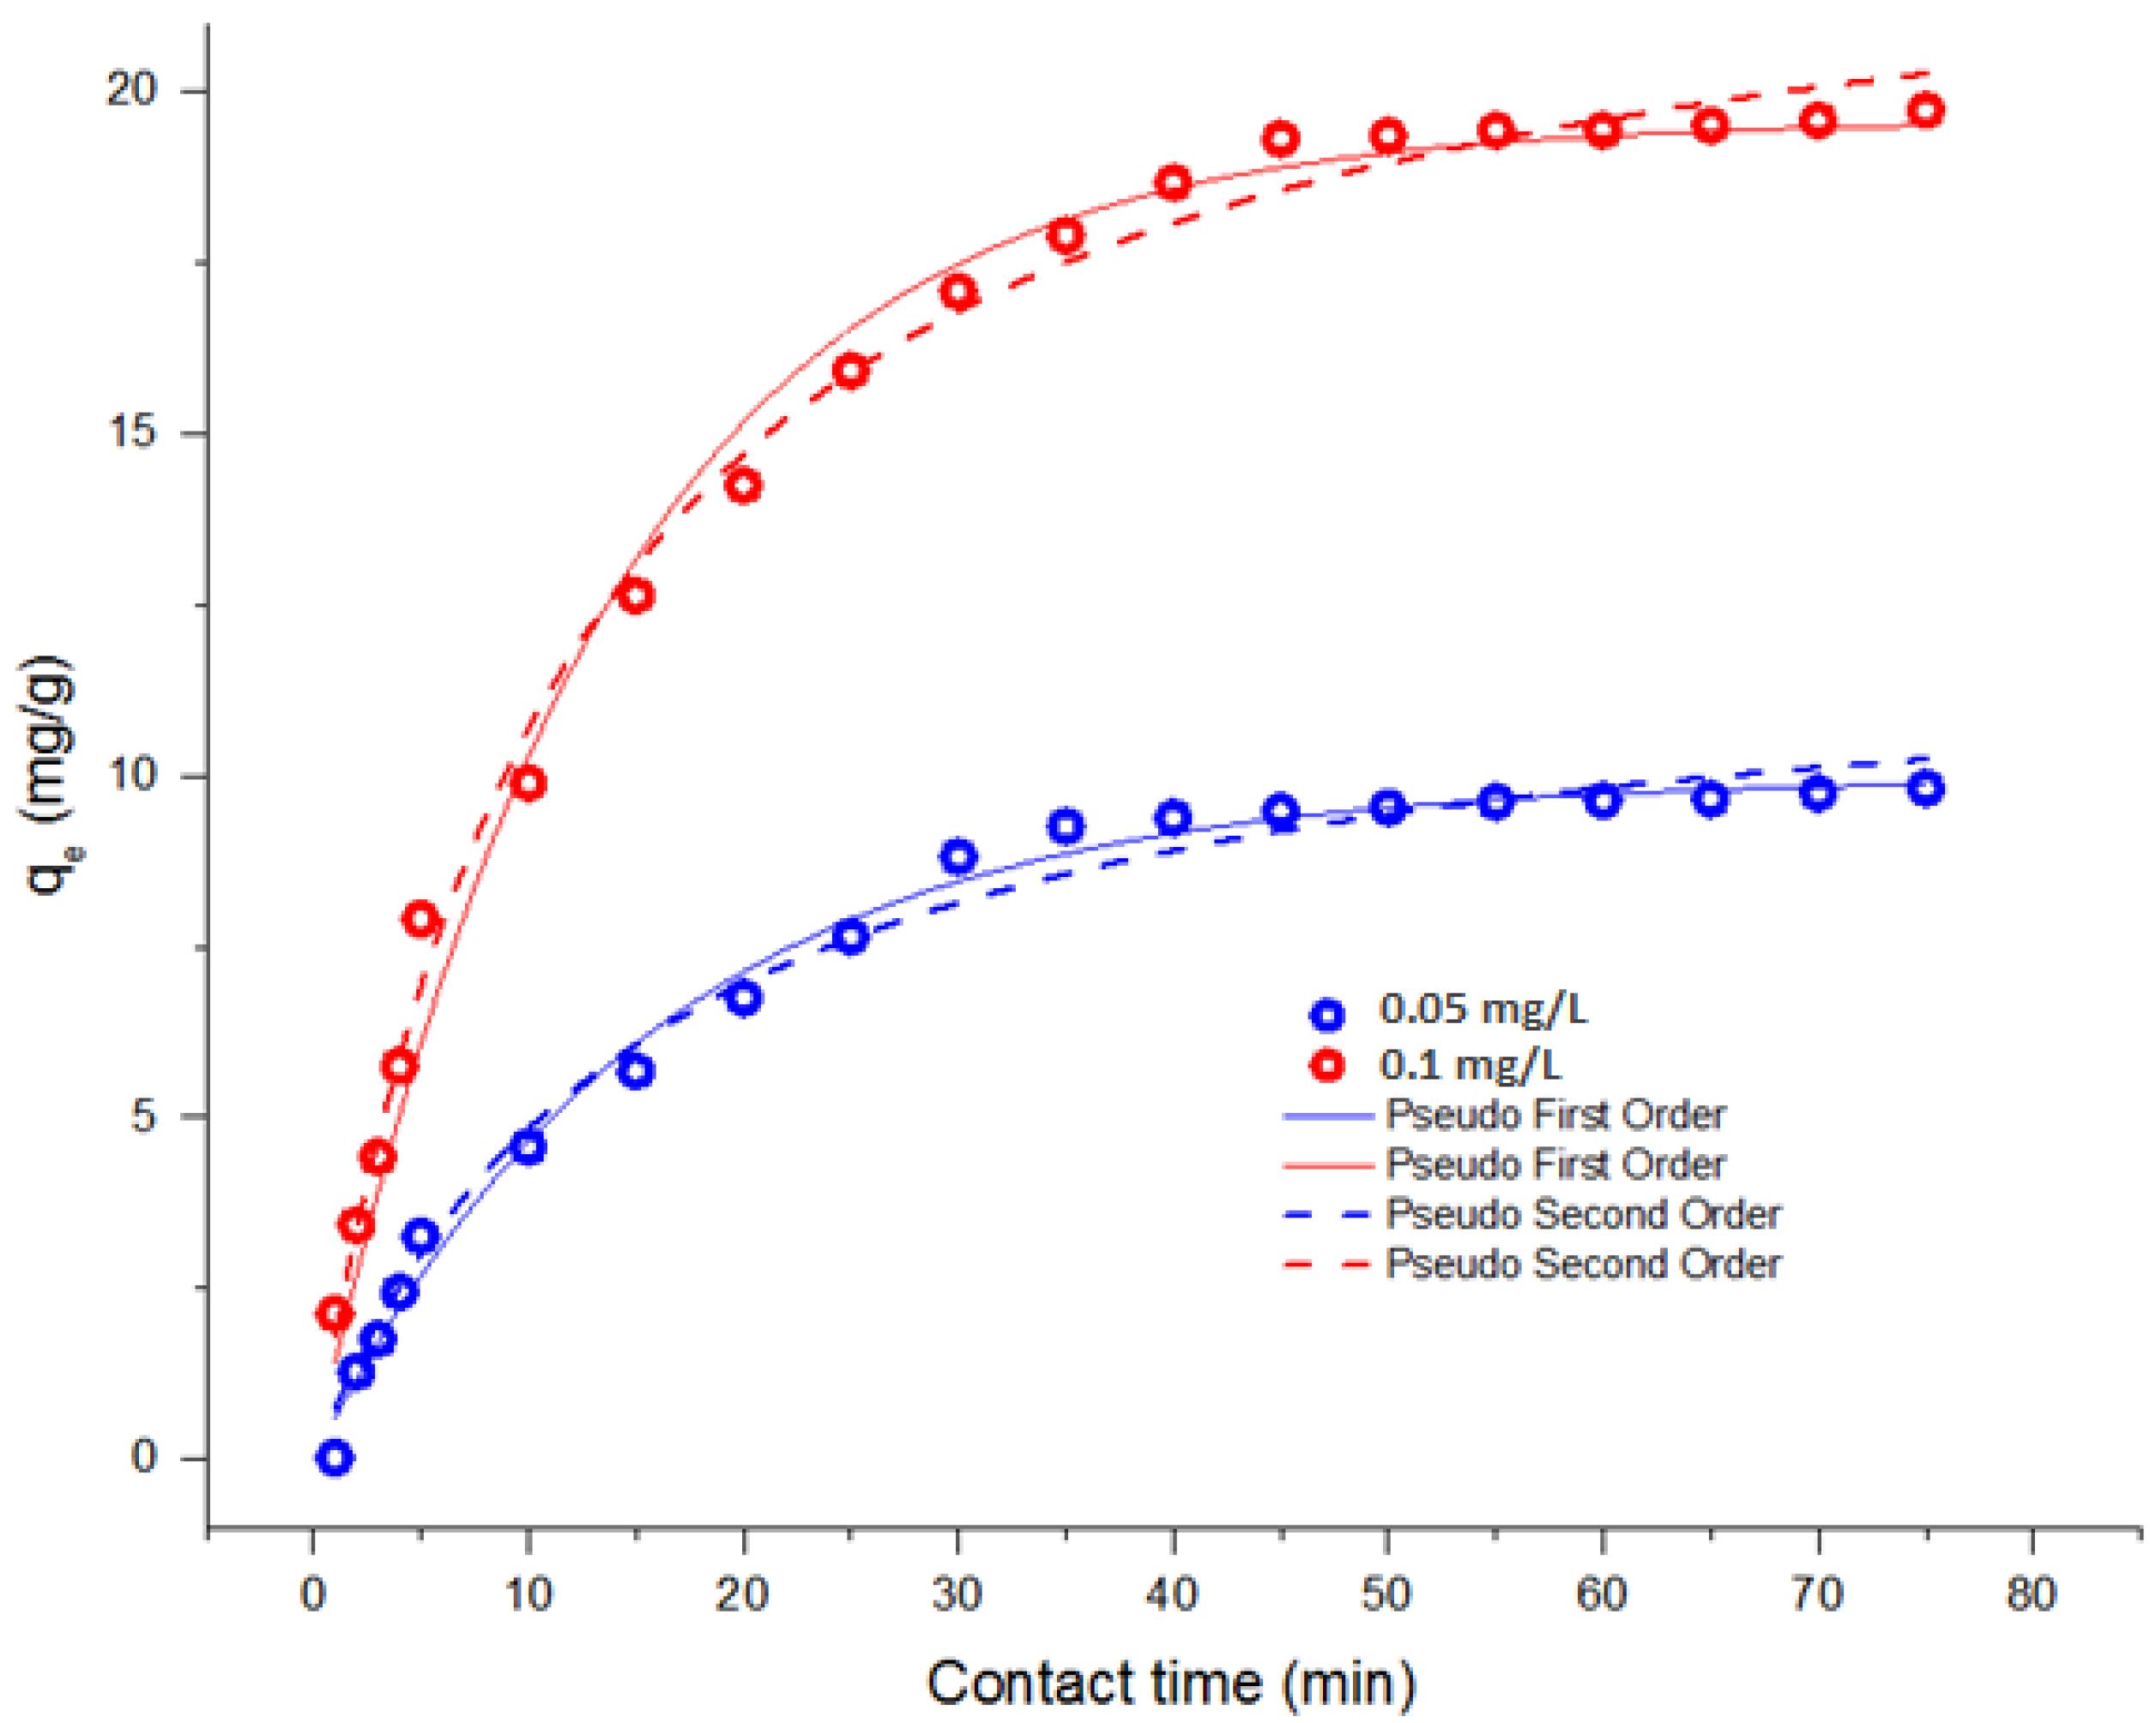
Fig. 7.
Fitting of Equilibrium Data Onto Pseudo-First-Order and Pseudo-Second-Order Kinetic Models
.
Fitting of Equilibrium Data Onto Pseudo-First-Order and Pseudo-Second-Order Kinetic Models
3.4. Isotherm of Arsenate Adsorption
The adsorption type and the relationship between As and the adsorbent were studied with the non-linear form of various two- and three-variable isotherm models. The results are illustrated in Figs. 8 and 9, and related parameters are listed in Tables 2 and 3. All studied isotherm models were best fitted onto equilibrium data; however, a higher correlation coefficient with related lower RSS was observed for the Khan equation, which is a blend of Langmuir and Freundlich equations. It is helpful for explaining multi- and single-ingredient adsorption environments (28). Therefore, this model suggests monolayer and multilayer adsorption of As(V) on the heterogeneous surface of the AMPDSA by physical or chemical sorption (27). According to the Temkin equation, a high value of adsorption heat (b1) and equilibrium binding constant (kt) represents fast endothermic adsorption of As at the initial stage and the strong bonding of the solute onto the medium. The equilibrium data were fitted with the Dubinin-Radushkevich model to investigate whether As uptake was controlled by a physical or chemical process. The parameter kad(mol2/kJ2) is the average free energy of adsorption per mole of the solute. The value lower than 8 (kJ/mol) demonstrates physical adsorption. The calculated kad parameter was 1.58, suggesting that physiosorption predominantly controlled As uptake. However, the lower correlation coefficient value for this model indicates that such physical forces during sorption at such As concentrations have a slight effect (29). The Jovanovich model was fitted to the equilibrium data to confirm that adsorption holes increase exponentially with the adsorption of solute, which is evidence of multilayer adsorption. The heterogeneous surface of the AMPDSA and multilayer adsorption can thus be derived according to this model (30). In addition to the Khan equation, the Redlich-Peterson model shows a higher correlation coefficient but lower RSS. This model incorporates elements from the Freundlich and Langmuir equations and recompenses the errors. According to this model, the adsorption mechanism is hybrid, and therefore, it varies from the real monolayer adsorption (31). The multilayer sorption of As onto the AMPDSA adsorbent is well demonstrated based on this model. In summary, the correlation of the equilibrium data onto various isotherm modes suggests the heterogeneous surface of AMPDSA with multilayer adsorption sites for retaining As species.
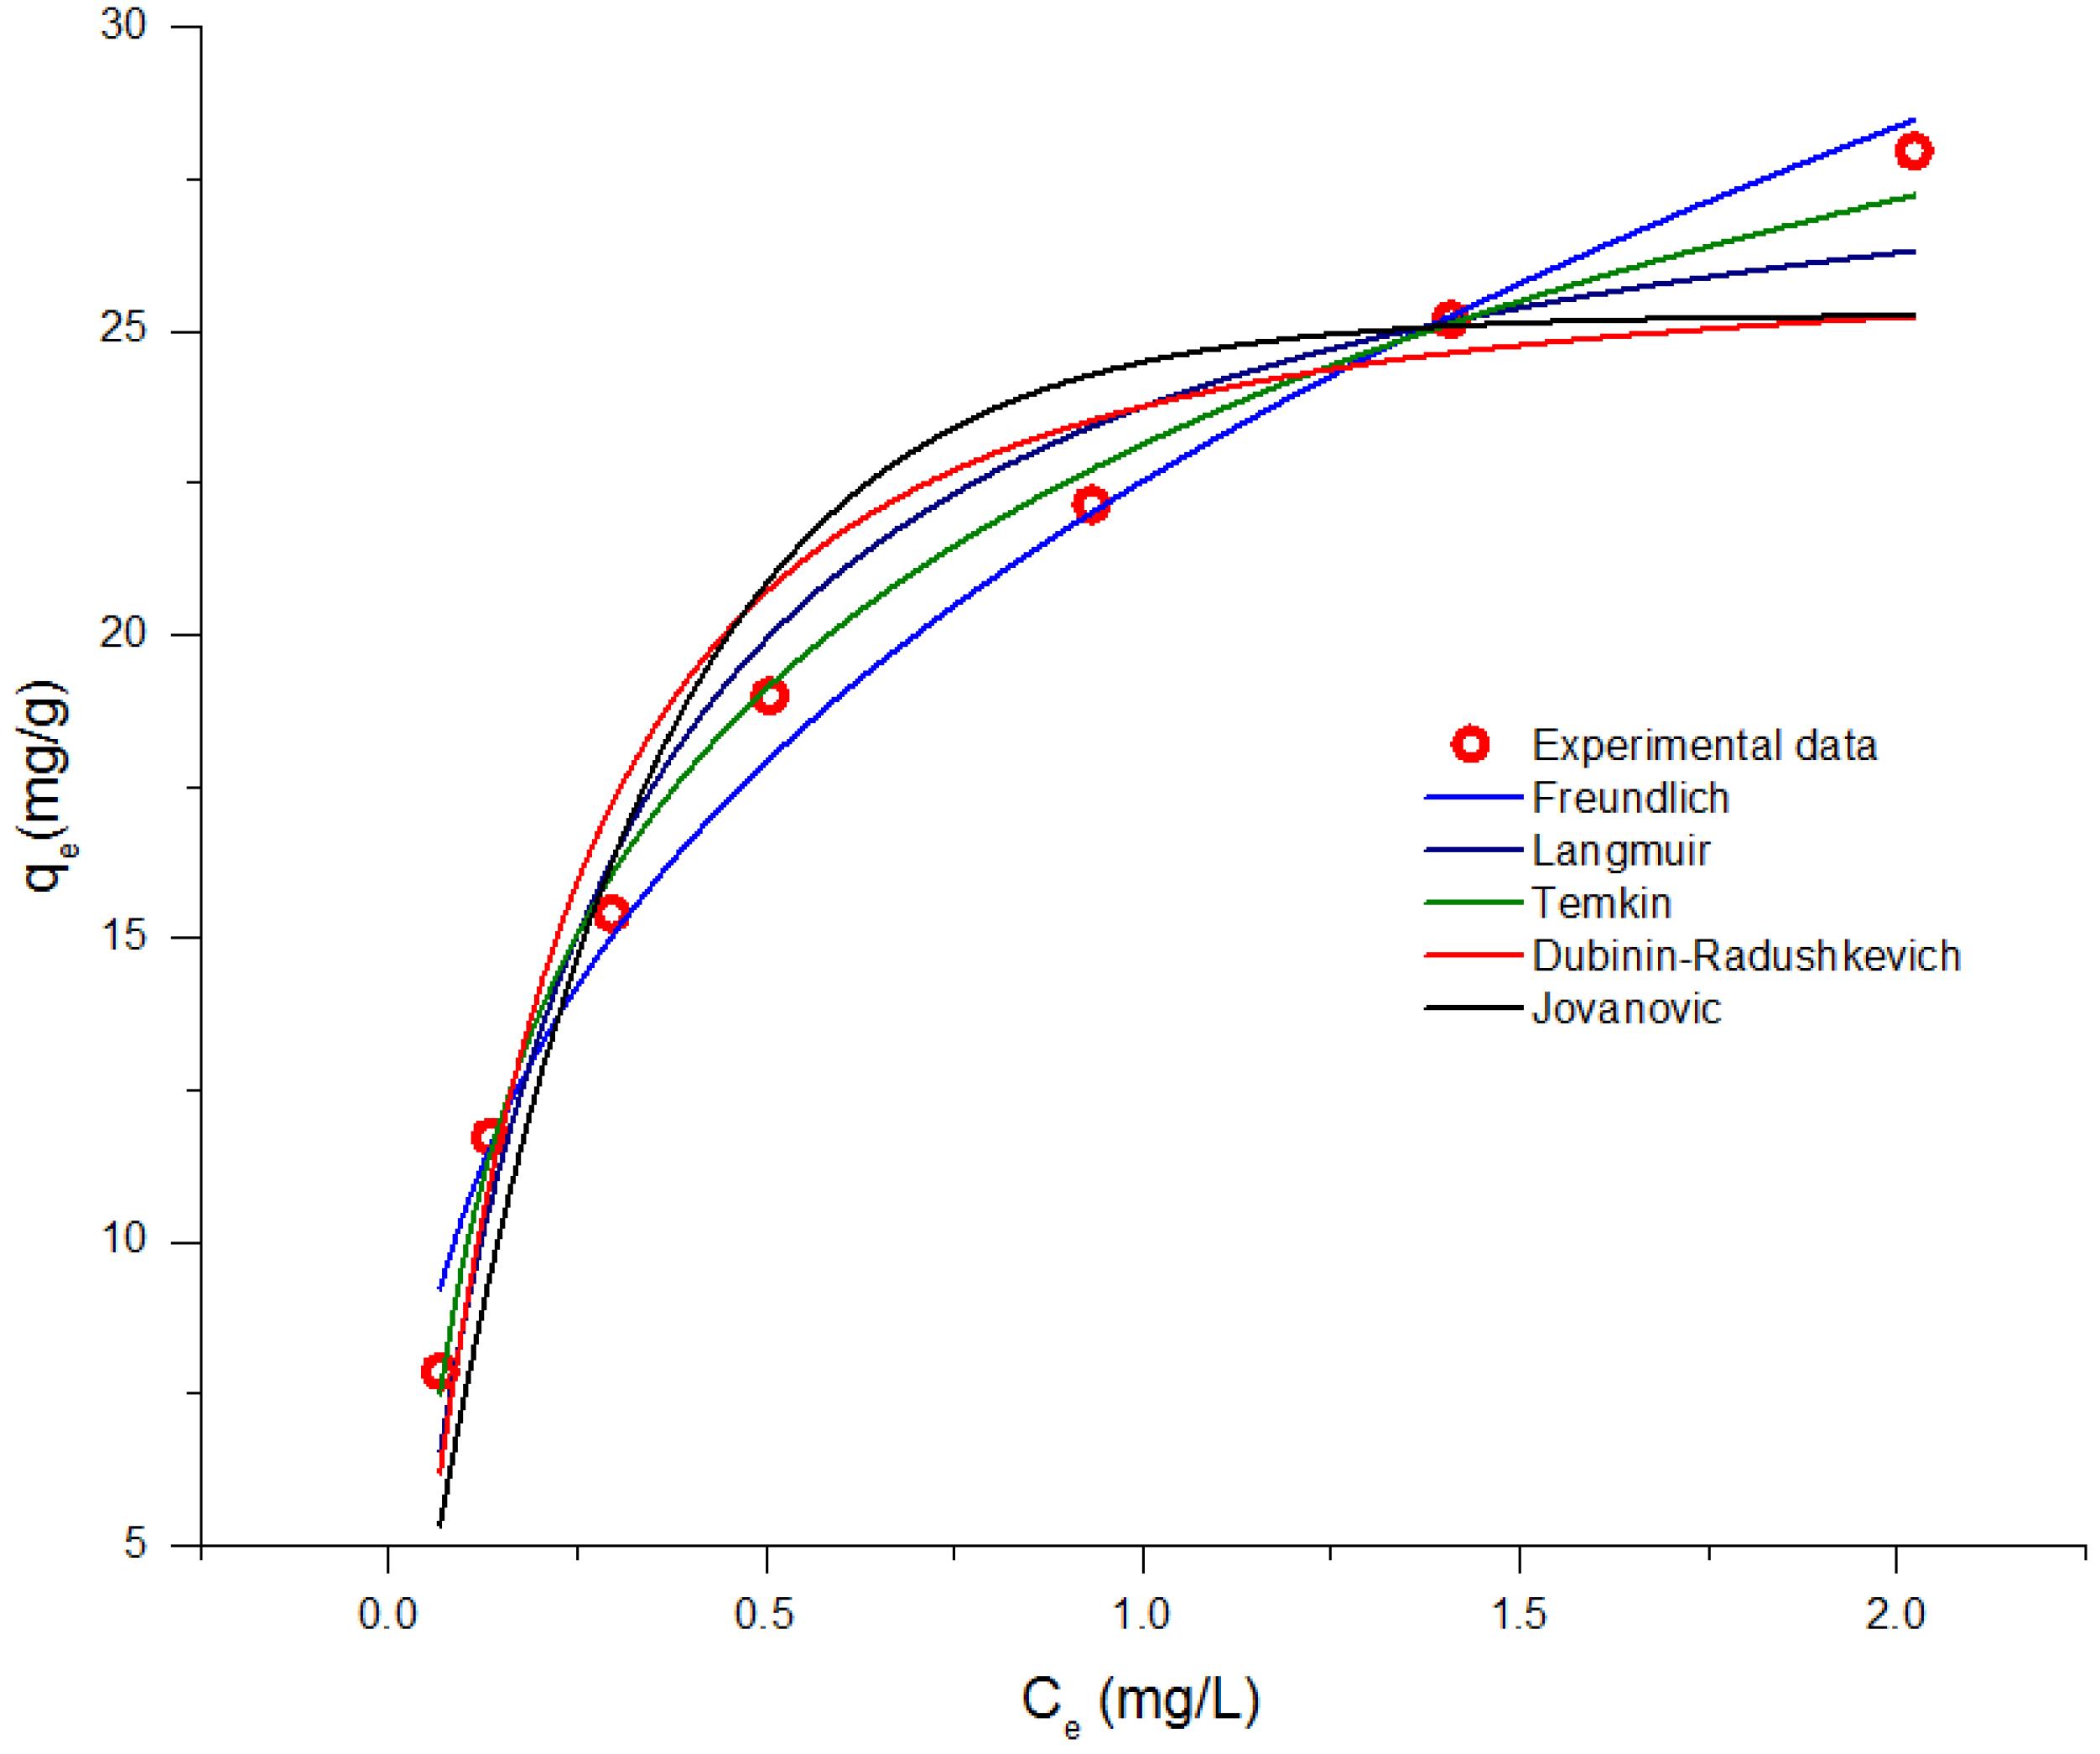
Fig. 8.
Fitting of Equilibrium Data Onto Two-Parameter Isotherm Models
.
Fitting of Equilibrium Data Onto Two-Parameter Isotherm Models
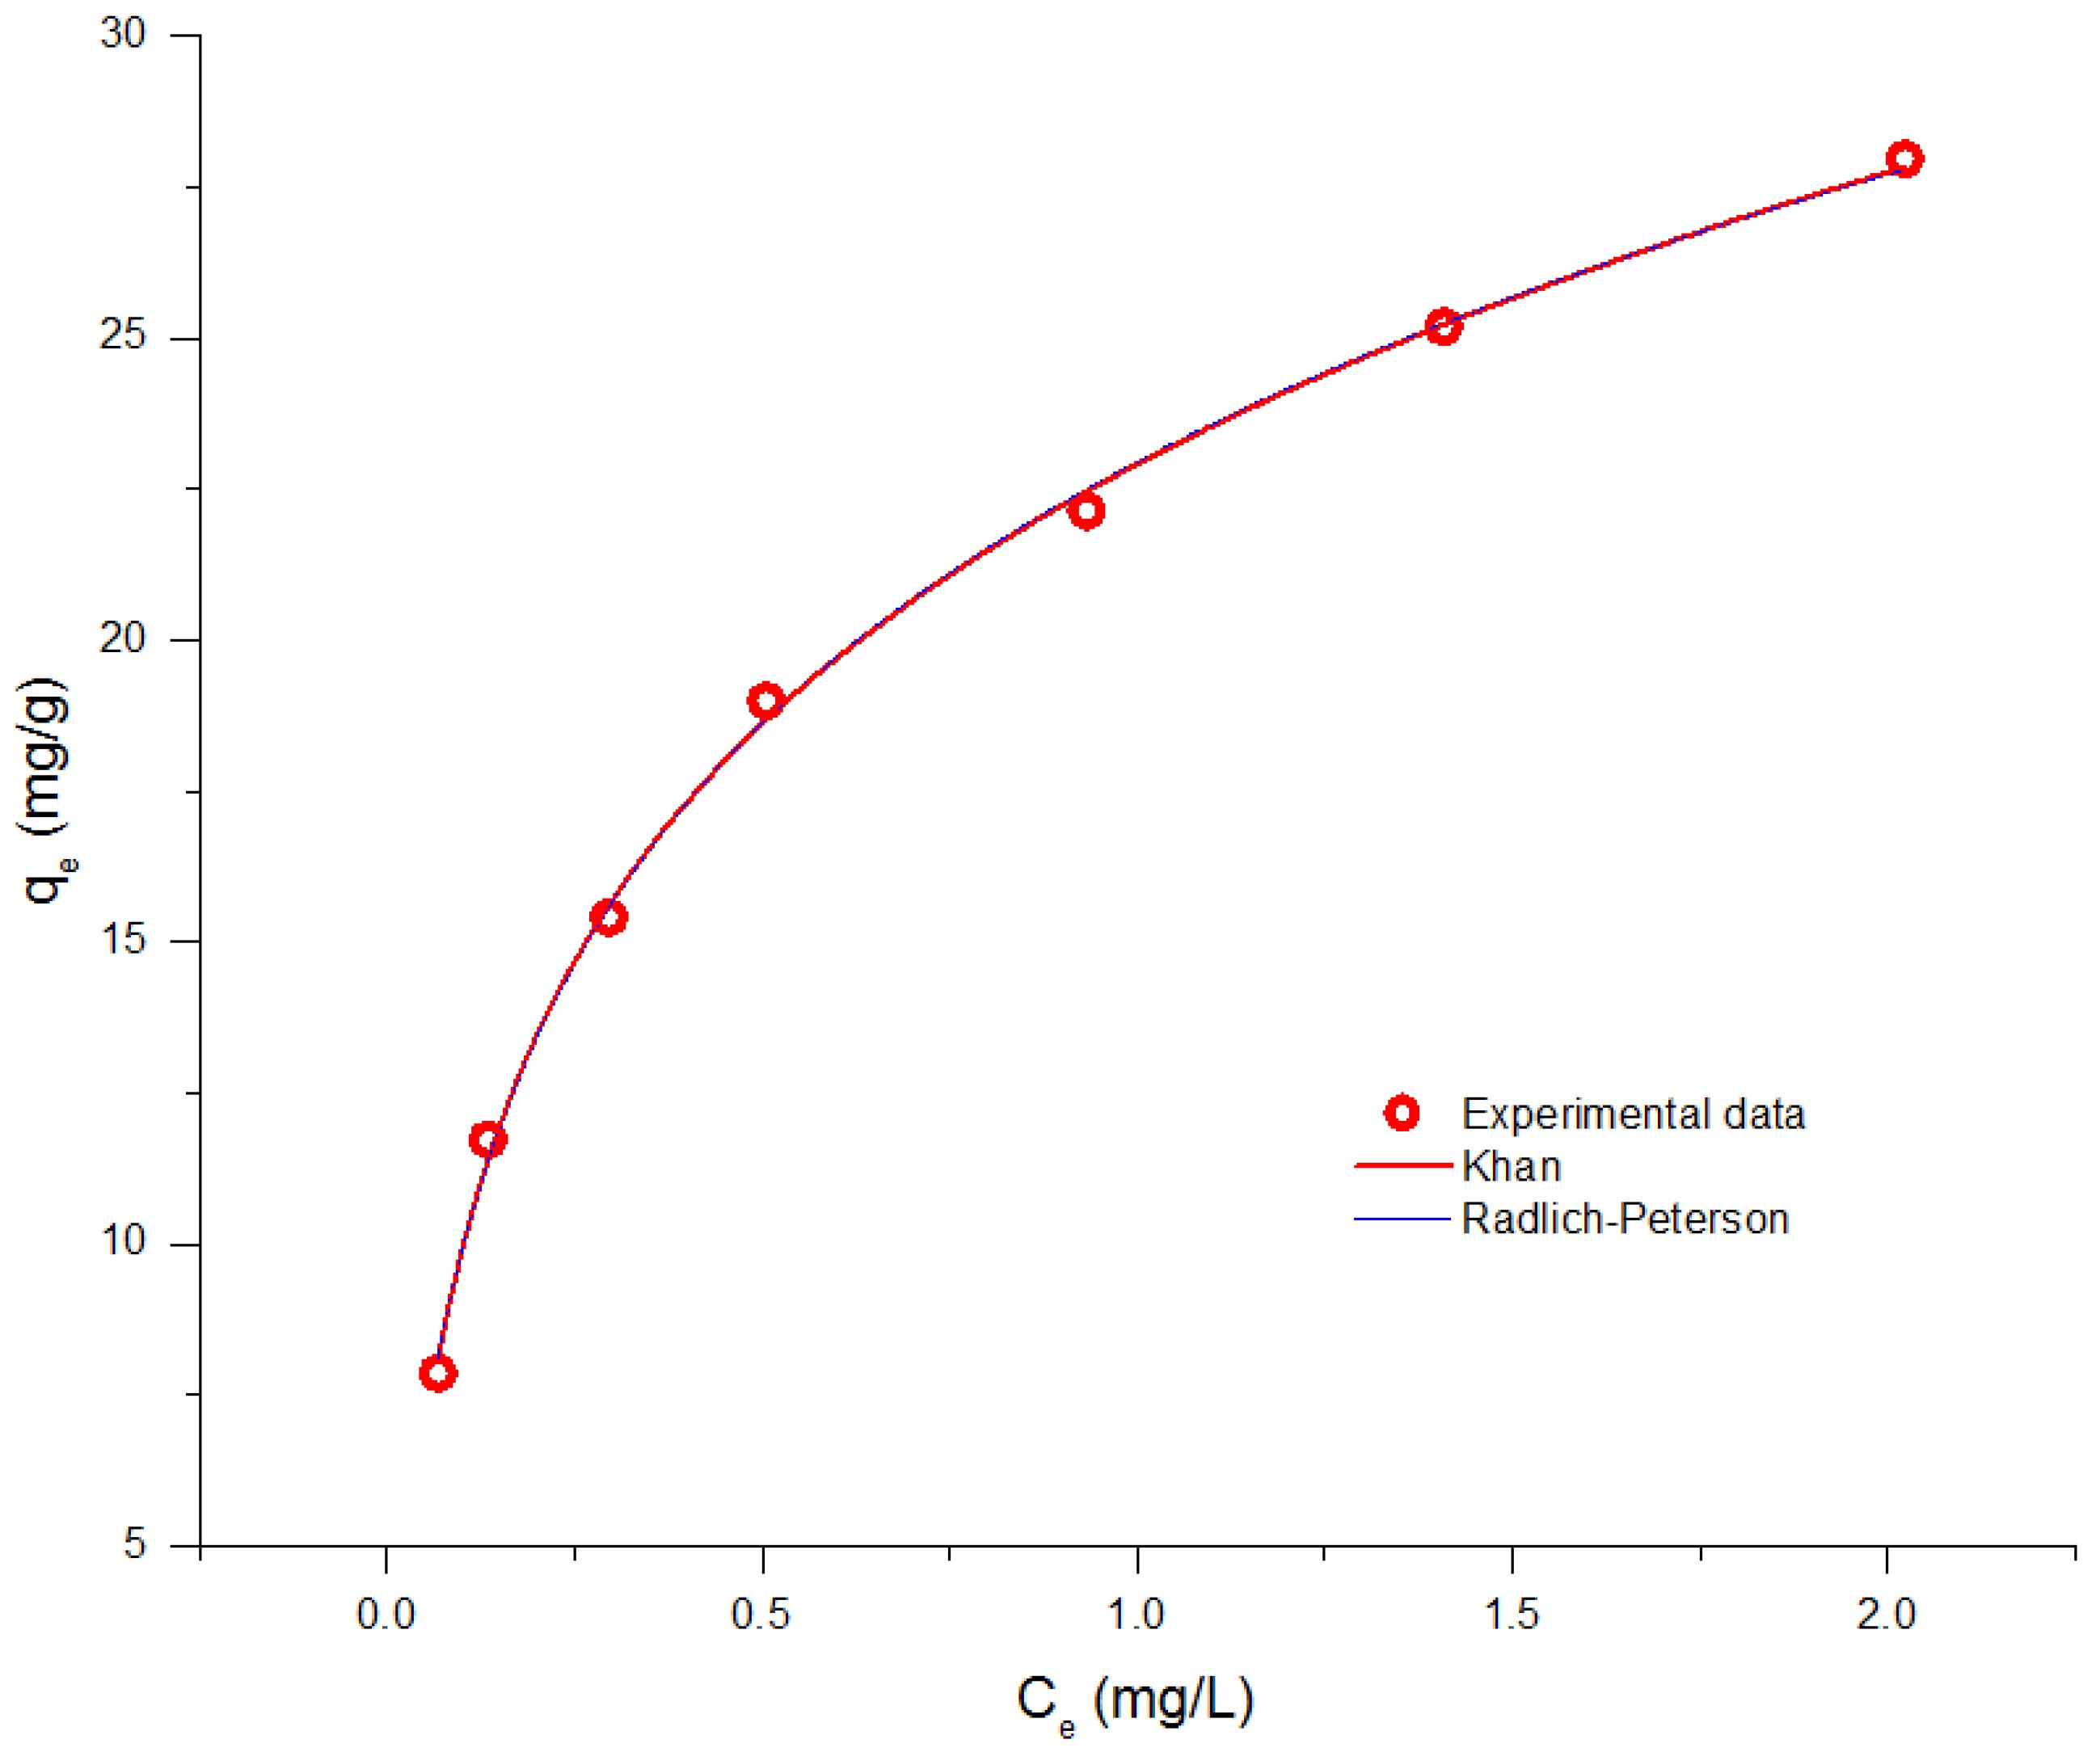
Fig. 9.
Fitting of Equilibrium Data Onto Three-Parameter Isotherm Models
.
Fitting of Equilibrium Data Onto Three-Parameter Isotherm Models
Table 2.
Parameters of Two-Parameter Isotherm Models
|
Isotherm Model
|
Isotherm Parameters
|
| Freundlich
|
Kf |
n |
R2 |
RSS |
| 22.52 |
3.00 |
0.99 |
3.40 |
| Langmuir
|
qm |
B |
R2 |
RSS |
| 39.42 |
4.20 |
0.99 |
4.10 |
| Temkin
|
BT |
AT |
R2 |
RSS |
| 5.80 |
53.11 |
0.99 |
4.50 |
| Dubinin-Radushkevich
|
Qs |
kad |
R2 |
RSS |
| 26.02 |
0.20 |
0.95 |
9.27 |
| Jovanovich
|
qmax |
Kj |
R2 |
RSS |
| 35.26 |
3.48 |
0.96 |
17.82 |
Note. RSS: Residual sum of squares.
Table 3.
Parameters of Three-Parameter Isotherm Models
|
Isotherm Model
|
Isotherm Parameters
|
| Khan
|
qm (mg/g) |
bk |
ak |
R2 |
RSS |
| 42.20 |
20.25 |
0.75 |
0.99 |
0.41 |
| Redlich-Peterson
|
KRP |
pe |
g |
R2 |
RSS |
| 294.20 |
11.80 |
0.77 |
0.99 |
0.50 |
Note. RSS: Residual sum of squares.
3.5. Fourier-Transformed Infrared After Adsorption
Fig. 10 displays the FTIR of the adsorbent after As adsorption in optimal conditions. As shown, new peaks have appeared on the adsorbent after the adsorption of As. A broad pattern at 3880.60 cm-1, 2923.55 cm-1, and 2852.20 cm-1 can be assigned to a decrement in symmetric stretching and asymmetric modes of CH2 groups in the structure of amino groups after As adsorption (2). A new peak at 1091.51 cm-1 and798.38 cm-1 corresponds to As-O and As = O bonds, respectively (1).
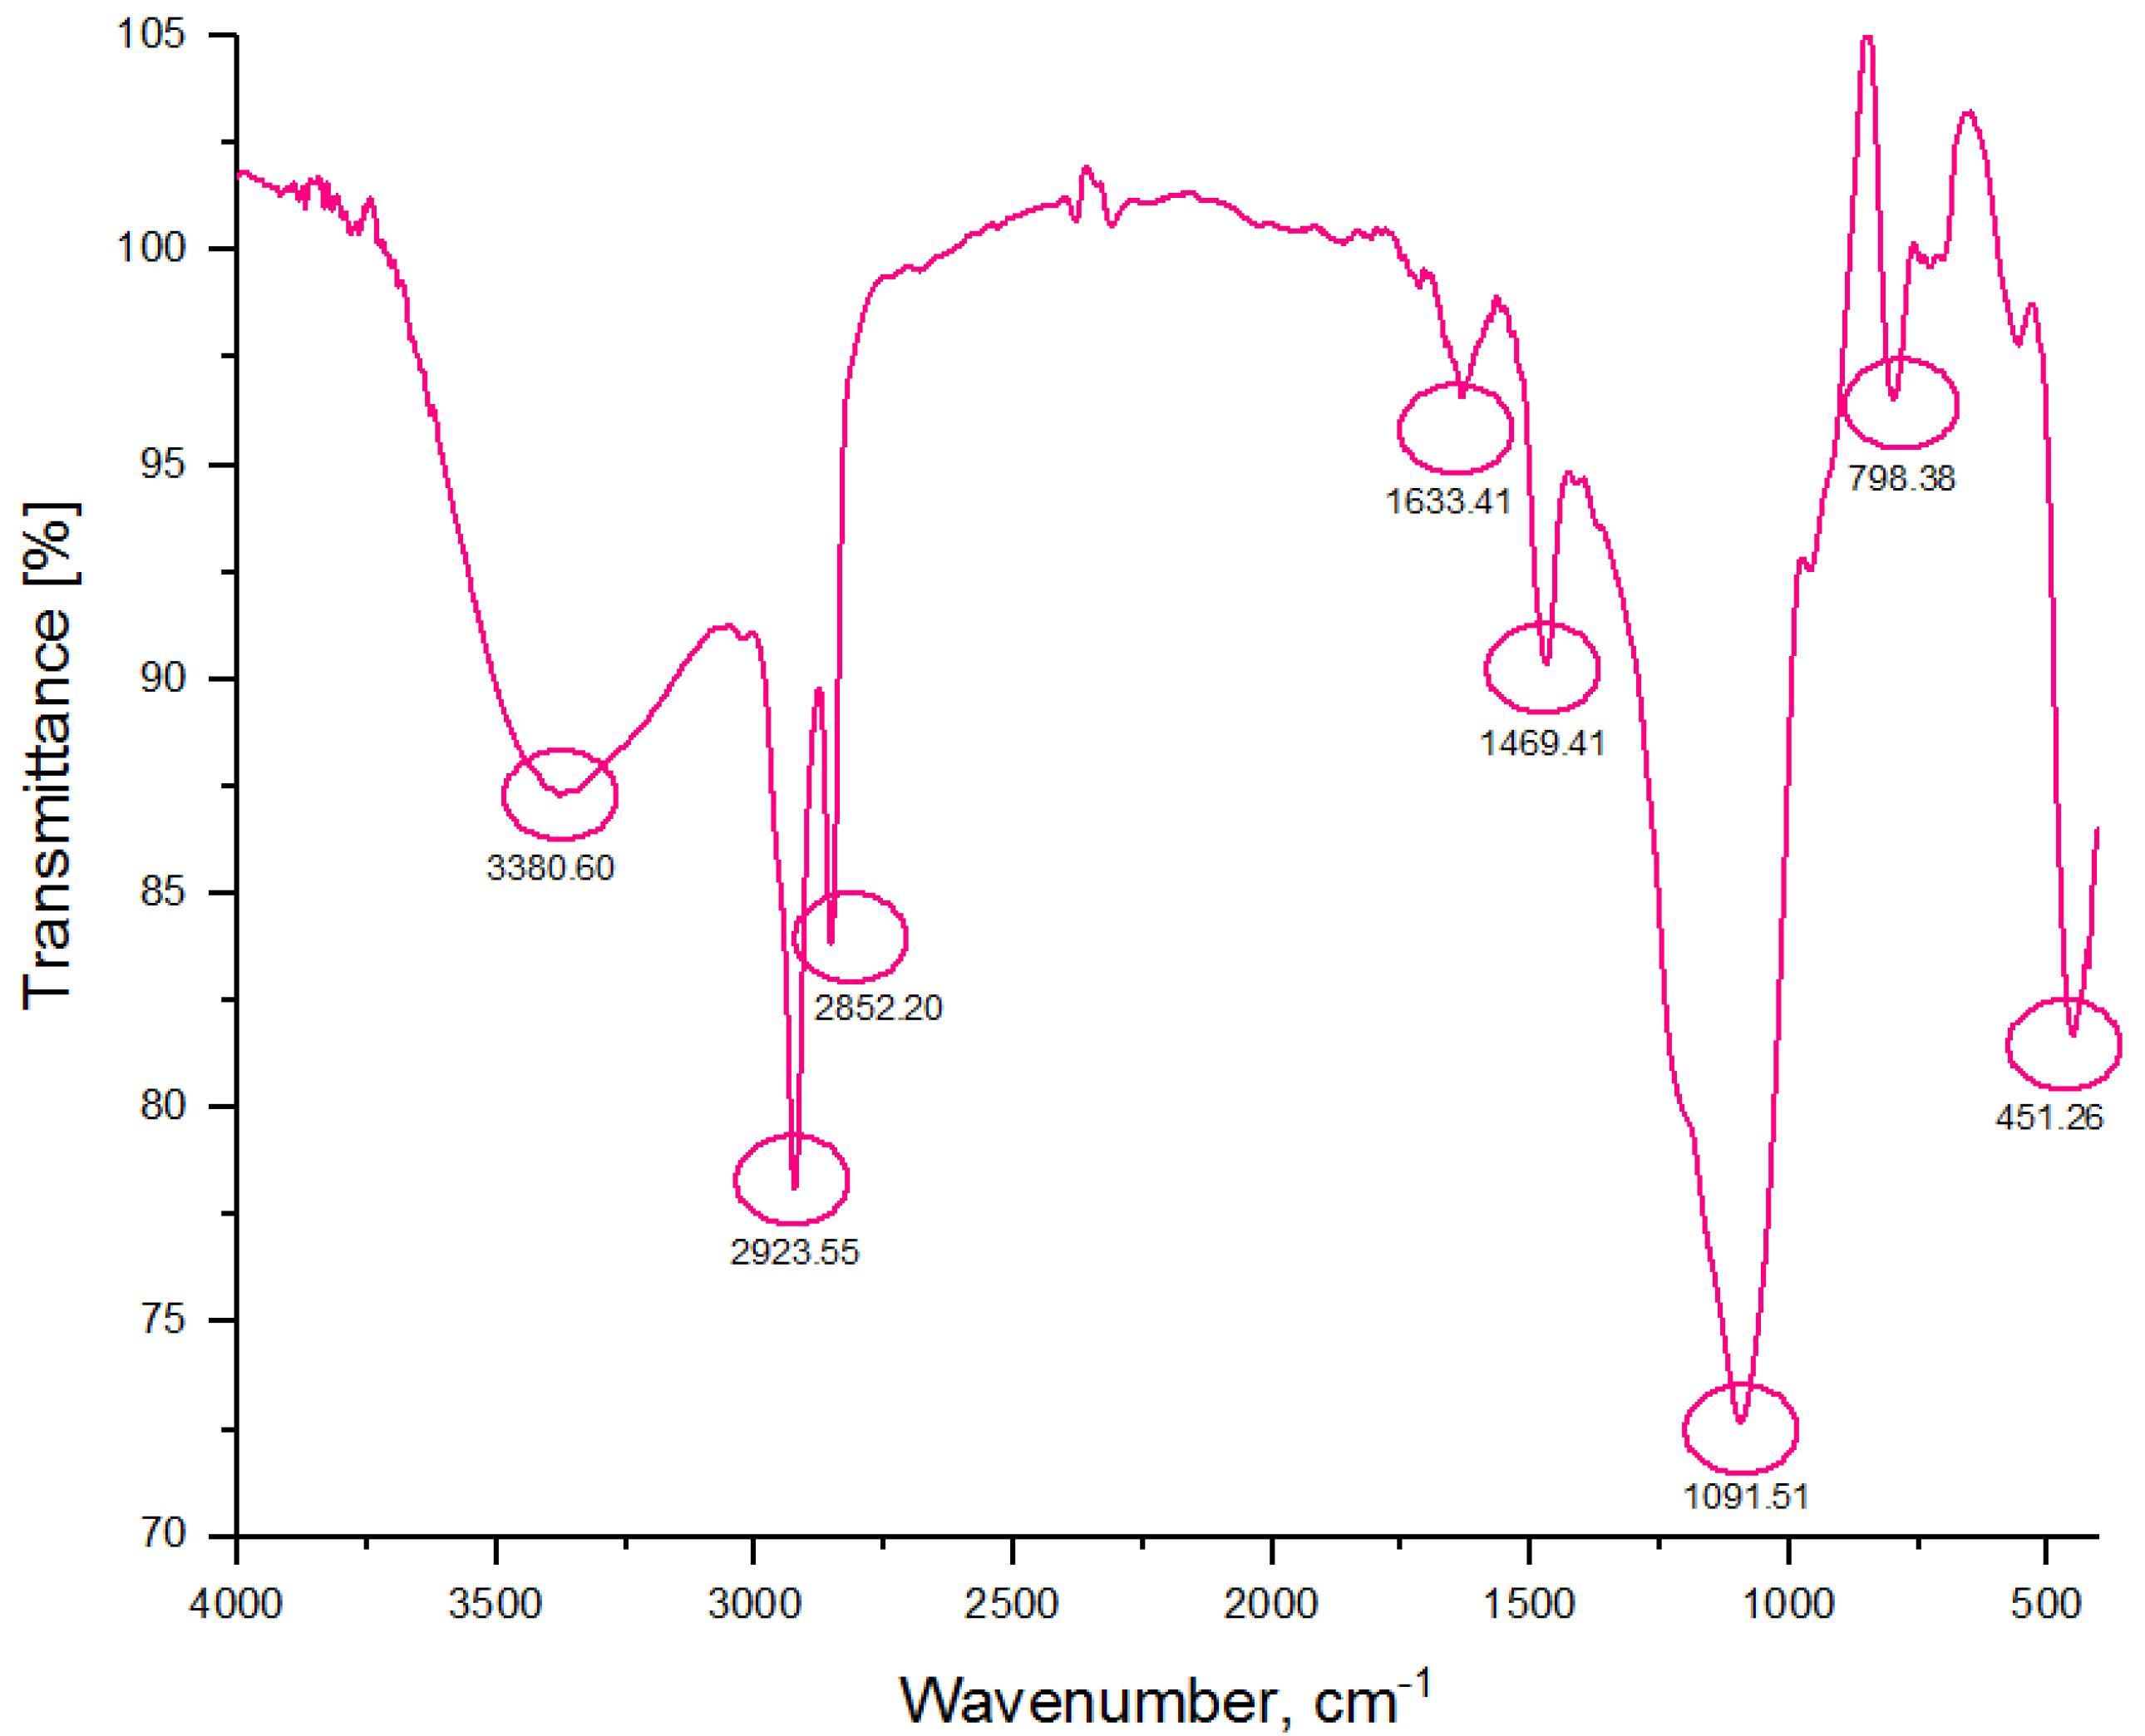
Fig. 10.
FTIR Spectra of AMPDSA After Arsenate Adsorption at Optimal Conditions.*Note. FTIR: Fourier-transformed infrared; AMPDSA: Amine-functionalized pumice-derived silica aerogel. *A pH value of 6.85, reaction time of 120 minutes, and initial arsenate concentration of 95.21 µg/L
.
FTIR Spectra of AMPDSA After Arsenate Adsorption at Optimal Conditions.*Note. FTIR: Fourier-transformed infrared; AMPDSA: Amine-functionalized pumice-derived silica aerogel. *A pH value of 6.85, reaction time of 120 minutes, and initial arsenate concentration of 95.21 µg/L
3.6 Regeneration of the Spent Adsorbent
The spent adsorbent from the optimal removal condition (a pH value of 6.85, a reaction time of 120 minutes, and the initial As concentration of 95.21 µg/L) was extracted and regenerated from the economical point and stability of the adsorbent using 1 M HCl. After nine adsorption-regeneration cycles, the adsorption susceptibility of AMPDSA declined by 63%. Fig. 11 shows the trend of adsorption capacity during nine adsorption-regeneration cycles, the adsorption-desorption isotherm, and the FESEM of the spent adsorbent. During the first four cycles, the adsorption capacity was reduced by 14%, and then a remarkable reduction (49%) was observed from cycle 5 to cycle 9 (Fig. 11A). The characteristic surface area, hole volume, and average pore diameter declined to 572.64 m2/g, 0.74 cm3/g, and the average hole diameter of 5.19 nm, respectively (Fig. 11B). In addition, the FESEM of the spent adsorbent (Fig. 11C) revealed a relatively smooth surface with clogged space between aerogel structures. The desorption of adsorbed As may be due to the complete protonation of donating nitrogen heteroatoms of binding sites on the surface of the adsorbent (32). The decrease in the specific surface area and clogging of the silica aerogel particle is mainly due to the compression of the adsorbent during several adsorption-regeneration cycles, trapping of sodium ions from HCl in the structure of aerogel, and destruction of the aerogel pore channel (33,34).
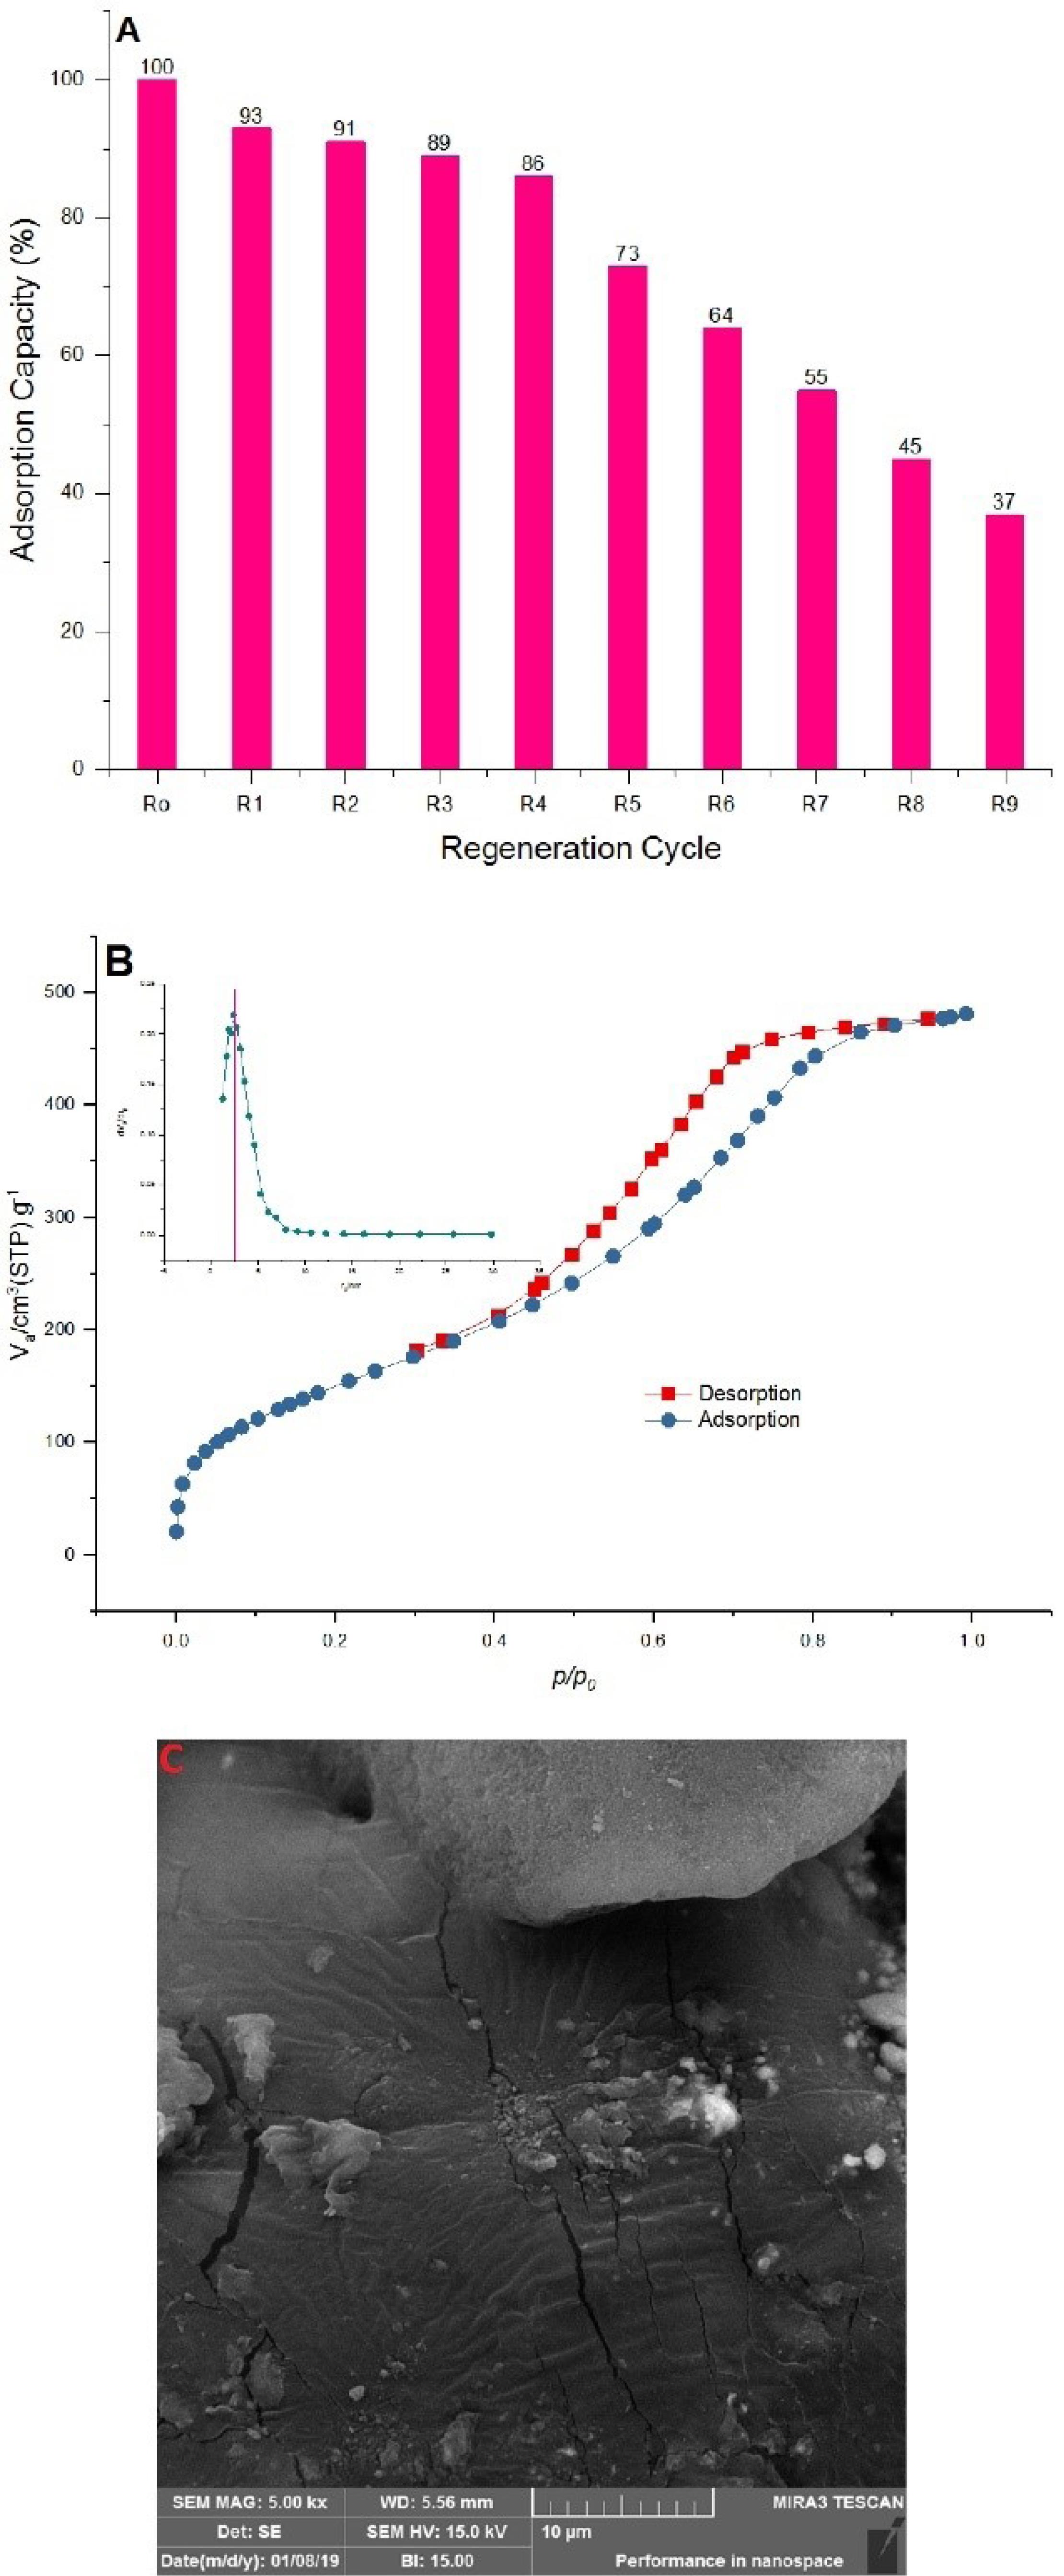
Fig. 11.
The Regeneration Cycle (A), Nitrogen Adsorption-Desorption (B), and FESEM of the Spent Adsorbent (C). Note. FESEM: Field emission scanning electron microscopy
.
The Regeneration Cycle (A), Nitrogen Adsorption-Desorption (B), and FESEM of the Spent Adsorbent (C). Note. FESEM: Field emission scanning electron microscopy
4. Conclusion
In this work, super-hydrophobic silica aerogel with a water contact angle of 151.4o was synthesized from pumice-derived water glass and amine grafted with ultrasonic aid to remove As(V) from the aqueous solution. Various characterization methods confirmed the formation of a well-defined silica aerogel structure. The ultrasonic method was found to be more effective, economic, and environmentally friendly than conventional sol-gel methods for surface amine functionalization of the silica aerogel. Box-Benkin surface response methodology was used for modeling the batch As adsorption. Multiple non-linear regression analyses confirmed that the selected parameters had a direct influence on As uptake. Based on this finding, the optimum conditions of three variables were computed as a pH value of 6.85, a reaction time of 120 minutes, and an initial As concentration of 95.21 µg/L. Further, the associated removal efficiency value was determined to be about 100%. The pseudo-first-order equation could successfully describe the kinetic of As adsorption on the prepared adsorbent, which is evidence of chemical adsorption. According to kinetic models, As uptake was fast at the initial stage and attained equilibrium in 120 minutes. Equilibrium data were analyzed by various isotherm equations with higher fitness and lower RSS with the Khan and Redlich-Peterson isotherm models. Accordingly, the maximum uptake capacity was 42.2 mg/g with a heterogeneous surface for multilayer adsorption sited for retaining As species. The spent adsorbent was successfully regenerated and reused by HCl, but a substantial reduction in adsorption capacity was observed after five regeneration-reuse cycles. Eventually, the results demonstrated that the ultrasonic method can easily introduce high-density amino groups to the silica aerogel surface, which can be used as a potential adsorbent for As adsorption from aqueous media and wastewater.
Acknowledgements
The author would like to gratefully thank Alborz University of Medical Sciences for financially supporting this work.
Competing Interests
None.
Ethical Approval
This study approved study by the Ethics Committee of the Alborz University of Medical Sciences (IR.ABZUMS.REC.1397.209).
Supplementary Files
Supplementary file 1 contains Tables S1-S2 and Figs. S1-S4.
(pdf)
References
- Mosaferi M, Shakerkhatibi M, Dastgiri S, Asghari Jafarabadi M, Khataee A, Sheykholeslami S. Natural arsenic pollution and hydrochemistry of drinking water of an urban part of Iran. Avicenna J Environ Health Eng 2014; 1(1):e164. doi: 10.5812/ajehe.164 [Crossref] [ Google Scholar]
- Lee CG, Alvarez PJ, Nam A, Park SJ, Do T, Choi US. Arsenic(V) removal using an amine-doped acrylic ion exchange fiber: kinetic, equilibrium, and regeneration studies. J Hazard Mater 2017; 325:223-9. doi: 10.1016/j.jhazmat.2016.12.003 [Crossref] [ Google Scholar]
- Sobhanardakani S. Health risk assessment of inorganic arsenic through groundwater drinking pathway in some agricultural districts of Hamedan, west of Iran. Avicenna J Environ Health Eng 2018; 5(2):73-7. doi: 10.15171/ajehe.2018.10 [Crossref] [ Google Scholar]
- de Ridder D, Schoonenberg F, van Halem D. Using an adsorption isotherm framework to classify removal efficiency of arsenic in full-scale groundwater treatment plants. J Water Process Eng 2019; 32:100898. doi: 10.1016/j.jwpe.2019.100898 [Crossref] [ Google Scholar]
- Jian M, Liu B, Zhang G, Liu R, Zhang X. Adsorptive removal of arsenic from aqueous solution by zeolitic imidazolate framework-8 (ZIF-8) nanoparticles. Colloids Surf A Physicochem Eng Asp 2015; 465:67-76. doi: 10.1016/j.colsurfa.2014.10.023 [Crossref] [ Google Scholar]
- Kobya M, Darvishi Cheshmeh Soltani R, Omwene PI, Khataee A. A review on decontamination of arsenic-contained water by electrocoagulation: reactor configurations and operating cost along with removal mechanisms. Environ Technol Innov 2020; 17:100519. doi: 10.1016/j.eti.2019.100519 [Crossref] [ Google Scholar]
- Sepahvand A, Farhadi M, Mohammadi MJ, Bayat M, Falahi B, Ghanizadeh F. A review of the effect of drinking water contaminated with arsenic on liver cancer. Avicenna J Environ Health Eng 2024; 11(2):47-54. doi: 10.34172/ajehe.5421 [Crossref] [ Google Scholar]
- Mohseni-Bandpei A, Eslami A, Kazemian H, Zarrabi M, Venkataraman S, Sadani M. Enhanced adsorption and recyclability of surface modified hydrophobic silica aerogel with triethoxysilane: removal of cefixime by batch and column mode techniques. Environ Sci Pollut Res Int 2023; 30(1):1562-78. doi: 10.1007/s11356-022-22277-5 [Crossref] [ Google Scholar]
- Chen K, Feng Q, Feng Y, Ma D, Wang D, Liu Z. Ultrafast removal of humic acid by amine-modified silica aerogel: insights from experiments and density functional theory calculation. Chem Eng J 2022; 435(Pt 3):135171. doi: 10.1016/j.cej.2022.135171 [Crossref] [ Google Scholar]
- Meti P, Mahadik DB, Lee KY, Wang Q, Kanamori K, Gong YD. Overview of organic–inorganic hybrid silica aerogels: progress and perspectives. Mater Des 2022; 222:111091. doi: 10.1016/j.matdes.2022.111091 [Crossref] [ Google Scholar]
- Wu X, Zhang J, Zhang L, Tang C. Thermal stability of APTES surface modified nano SiO2 insulating oil. J Mol Liq 2022; 366:120228. doi: 10.1016/j.molliq.2022.120228 [Crossref] [ Google Scholar]
- Li A, Ge W, Liu L, Zhang Y, Qiu G. Synthesis and application of amine-functionalized MgFe2O4-biochar for the adsorption and immobilization of Cd(II) and Pb(II). Chem Eng J 2022; 439:135785. doi: 10.1016/j.cej.2022.135785 [Crossref] [ Google Scholar]
- Mohseni-Bandpei A, Eslami A, Kazemian H, Zarrabi M, Al-Musawi TJ. A high density 3-aminopropyltriethoxysilane grafted pumice-derived silica aerogel as an efficient adsorbent for ibuprofen: characterization and optimization of the adsorption data using response surface methodology. Environ Technol Innov 2020; 18:100642. doi: 10.1016/j.eti.2020.100642 [Crossref] [ Google Scholar]
- Omranpour H, Motahari S. Effects of processing conditions on silica aerogel during aging: Role of solvent, time and temperature. J Non Cryst Solids 2013; 379:7-11. doi: 10.1016/j.jnoncrysol.2013.07.025 [Crossref] [ Google Scholar]
- Emami Z, Ehsani M, Zandi M, Daemi H, Ghanian MH, Foudazi R. Modified hydroxyapatite nanoparticles reinforced nanocomposite hydrogels based on gelatin/oxidized alginate via Schiff base reaction. Carbohydr Polym Technol Appl 2021; 2:100056. doi: 10.1016/j.carpta.2021.100056 [Crossref] [ Google Scholar]
- Mahadik DB, Rao AV, Rao AP, Wagh PB, Ingale SV, Gupta SC. Effect of concentration of trimethylchlorosilane (TMCS) and hexamethyldisilazane (HMDZ) silylating agents on surface free energy of silica aerogels. J Colloid Interface Sci 2011; 356(1):298-302. doi: 10.1016/j.jcis.2010.12.088 [Crossref] [ Google Scholar]
- Fowkes FM. Calculation of work of adhesion by pair potential suummation. J Colloid Interface Sci 1968; 28(3-4):493-505. doi: 10.1016/0021-9797(68)90082-9 [Crossref] [ Google Scholar]
- Sharifzadeh Z, Morsali A. Amine-functionalized metal-organic frameworks: from synthetic design to scrutiny in application. Coord Chem Rev 2022; 459:214445. doi: 10.1016/j.ccr.2022.214445 [Crossref] [ Google Scholar]
- Kim J, Yun M, Song B, Yun Y. Heterogeneous enantioselective hydrogenation of an unsaturated carboxylic acid over Pd supported on amine-functionalized silica. Appl Catal A Gen 2022; 643:118773. doi: 10.1016/j.apcata.2022.118773 [Crossref] [ Google Scholar]
- Liu M, Zheng J, Wang L, Hu Z, Lan S, Rao W. Ultrafast and selective adsorption of anionic dyes with amine-functionalized glucose-based adsorbents. J Mol Struct 2022; 1263:133150. doi: 10.1016/j.molstruc.2022.133150 [Crossref] [ Google Scholar]
- Liu Y, Sajjadi B, Chen W-Y, Chatterjee R. Ultrasound-assisted amine functionalized graphene oxide for enhanced CO2 adsorption. Fuel 2019; 247:10-8. doi: 10.1016/j.fuel.2019.03.011 [Crossref] [ Google Scholar]
- Yan H, Zhang G, Xu Y, Zhang Q, Liu J, Li G. High CO2 adsorption on amine-functionalized improved macro-/mesoporous multimodal pore silica. Fuel 2022; 315:123195. doi: 10.1016/j.fuel.2022.123195 [Crossref] [ Google Scholar]
- Sing KS. Reporting physisorption data for gas/solid systems with special reference to the determination of surface area and porosity. Pure Appl Chem 1985; 57(4):603-19. doi: 10.1351/pac198557040603 [Crossref] [ Google Scholar]
- Thommes M, Kaneko K, Neimark AV, Olivier JP, Rodriguez-Reinoso F, Rouquerol J. Physisorption of gases, with special reference to the evaluation of surface area and pore size distribution (IUPAC Technical Report). Pure Appl Chem 2015; 87(9-10):1051-69. doi: 10.1515/pac-2014-1117 [Crossref] [ Google Scholar]
- Azizian S, Bashiri H. Adsorption kinetics at the solid/solution interface: statistical rate theory at initial times of adsorption and close to equilibrium. Langmuir 2008; 24(20):11669-76. doi: 10.1021/la802288p [Crossref] [ Google Scholar]
- Ho YS. Second-order kinetic model for the sorption of cadmium onto tree fern: a comparison of linear and non-linear methods. Water Res 2006; 40(1):119-25. doi: 10.1016/j.watres.2005.10.040 [Crossref] [ Google Scholar]
- Zubair YO, Fuchida S, Tokoro C. Insight into the mechanism of arsenic (III/V) uptake on mesoporous zerovalent iron-magnetite nanocomposites: adsorption and microscopic studies. ACS Appl Mater Interfaces 2020; 12(44):49755-67. doi: 10.1021/acsami.0c14088 [Crossref] [ Google Scholar]
- Saadi R, Saadi Z, Fazaeli R, Elmi Fard N. Monolayer and multilayer adsorption isotherm models for sorption from aqueous media. Korean J Chem Eng 2015; 32(5):787-99. doi: 10.1007/s11814-015-0053-7 [Crossref] [ Google Scholar]
- Hu Q, Zhang Z. Application of Dubinin–Radushkevich isotherm model at the solid/solution interface: a theoretical analysis. J Mol Liq 2019; 277:646-8. doi: 10.1016/j.molliq.2019.01.005 [Crossref] [ Google Scholar]
- Hamdaoui O, Naffrechoux E. Modeling of adsorption isotherms of phenol and chlorophenols onto granular activated carbon Part I Two-parameter models and equations allowing determination of thermodynamic parameters. J Hazard Mater 2007; 147(1-2):381-94. doi: 10.1016/j.jhazmat.2007.01.021 [Crossref] [ Google Scholar]
- Foo KY, Hameed BH. Insights into the modeling of adsorption isotherm systems. Chem Eng J 2010; 156(1):2-10. doi: 10.1016/j.cej.2009.09.013 [Crossref] [ Google Scholar]
- Chen Y, Zhang J, Liu H, Wang X, Chen S. A surfactant modified solid amine adsorbent to enhance CO2 adsorption performance. Colloids Surf A Physicochem Eng Asp 2023; 677(Pt A):132323. doi: 10.1016/j.colsurfa.2023.132323 [Crossref] [ Google Scholar]
- Huang P, Wei X, Wang X, Gu Z, Guo Y, Zhao C. Facile fabrication of silica aerogel supported amine adsorbent pellets for low-concentration CO2 removal from confined spaces. Chem Eng J 2023; 468:143629. doi: 10.1016/j.cej.2023.143629 [Crossref] [ Google Scholar]
- Li Z, Zhao S, Koebel MM, Malfait WJ. Silica aerogels with tailored chemical functionality. Mater Des 2020; 193:108833. doi: 10.1016/j.matdes.2020.108833 [Crossref] [ Google Scholar]