Avicenna J Environ Health Eng. 8(1):1-8.
doi: 10.34172/ajehe.2021.01
Original Article
Removal of Lead (Pb) From Aqueous Solutions Using Lignocellulose Nanofiber
Saeedeh Rastgar 1, *  , Hassan Reaei 1, Hossein Yousefi 1
Author information:
1Faculty of Fisheries and Environmental Sciences, Gorgan University of Agricultural Sciences and Natural Resources, Gorgan, Iran
Abstract
The objective of this study was to investigate the removal of lead from aqueous solutions using Lignin-containing cellulose (LCNF) as natural adsorbent and advanced material in the batch system. The water sources contaminated with heavy metals, such as lead, have now become one of the major issues in the world due to non-degradability and huge adverse effects on the health of living organisms. X-ray diffraction (XRD), Fourier transform-infrared spectroscopy (FT-IR), and transmission electron microscopy (TEM) were used to analyze the physical, chemical, and structural properties of LCNFs. The parameters measured in the batch system included pH (4-9), adsorbent dosage (0.1-1 g), contact time (15-120 minutes), initial lead concentration (10-50 mg/L), and temperature (15-40°C). The data for each treatment were statistically studied by analysis of variance (ANOVA) and Duncan’s test. Based on the results, the optimal parameters were determined to be initial lead concentration of 10 mg/L, pH of 6, and adsorbent dosage of 0.3 g/L. The highest lead removal efficiency was achieved at 25°C. The system reached equilibrium at 60 minutes, and then there was little change in lead removal. The results of this study showed that LCNF, by removing more than 99% of lead from aqueous solutions, is a suitable adsorbent for removing lead from aqueous solutions.
Keywords: Adsorption, Aqueous solutions, Lead, Lignocellulose, Nanofiber
Copyright and License Information
© 2021 The Author(s); Published by Hamadan University of Medical Sciences.
This is an open-access article distributed under the terms of the Creative Commons Attribution License (
http://creativecommons.org/licenses/by/4.0), which permits unrestricted use, distribution, and reproduction in any medium provided the original work is properly cited.
1. Introduction
Heavy metals such as cadmium (Cd), mercury (Hg), and lead (Pb) are among the most common pollutants commonly found at high concentrations in industrial wastewaters, contaminating aqueous solutions and endangering the health of living organisms, especially humans (1). Pb is a major toxic metal that is classified into a category of special pollutants and enters the environment as a result of industries such as metal plating and production of dyes and plastics (2). Long-term drinking of water containing high concentrations of Pb causes serious disorders such as nausea, anemia, renal failure, mental retardation, seizure, and cancer, as well as death (3).
The maximum allowable concentration of Pb in surface and underground waters has been determined to be 1 mg/L by the Iranian department of environment. Therefore, the separation of this metal is necessary prior to the discharge of wastewaters containing Pb into urban wastewater or disposal in the environment (4). Conventional methods for the removal of heavy metals include chemical deposition, ion exchange, and electrochemical technique (5). The use of any of these methods depends on a variety of factors such as wastewater status, type and concentration of heavy metals, the amount of treatment required, but most importantly, the constraints such as the cost of the devices required and the high cost of executive operations and treatment of toxic sludge (6). Therefore, due to the problems mentioned, it is necessary to introduce novel methods, such as metal nano-adsorbent. The adsorption of heavy metals is a relatively new technology for the treatment of industrial wastewater, whose purpose is toxic metals removal and environmental remediation as well as the recycling of precious metals (7). One of the reasons for the broader application of nanoadsorbent is the greater surface area to volume ratio, the reactivity, and the ability to absorb higher contamination relative to the macro and micro scales of the same substance. The lignin-containing cellulose nanofibrils (LCNFs) consists of lignin and hemicellulose, one of the thinnest and newest fibers in the world with attractive features such as renewability, non-toxicity, reasonable cost, and high specific resistance (8,9).
Deng et al used electrospun nanofibers to remove Pb from aqueous solutions. They reported that nanofibers with diameters less than 400 nm have high potential for Pb removal (10). Rajawat et al used cellulose nanofibers (CNs) to remove Pb and Cd from aqueous solutions in the batch system by analyzing the effect of pH; the greatest removal occurred at pH of 5 for both metals. The pH parameter had the greatest impact on the removal of Pb and Cd, and they concluded that this method was very effective in removing Pb and Cd (11). Kardam et al applied the CNs as adsorbents to remove Cd, nickel, and Pb from aqueous solutions in the batch system. They investigated the effect of adsorbent dosage, contact time, pH, and metal concentration on adsorption efficiency, and reported that CNs because of being environmentally friendly and cost-effective are appropriate and effective alternative to chemical adsorbents (12). Yang et al removed chromium and Pb using alcohol and CNs reinforced composites in the batch system, and concluded that this adsorbent had the potential to be reused without any significant reduction in its adsorption capacity and it was able to remove two metals (13). Arias et al evaluated lignocellulose for eliminating Hg in the batch system by examining the effect of adsorbent dosage, contact time, pH, and metal concentration on adsorption efficiency. They reported that this adsorbent is suitable for removing Hg and other heavy metals (14). Jain et al conducted a study to assess the CNs for the removal of Pb in the batch system and to evaluate the effect of adsorbent dosage, contact time, pH, and metal concentration on adsorption efficiency. Eventually, they reported that the CNs are appropriate adsorbents for the removal of Pb and other heavy metals (15).
Considering that the pollution of industrial and agricultural wastewaters with heavy metals, including the Pb, is a global problem, this research can be useful for managing the Pb removal from the environment, especially the aquatic environment, with the aim of preserving the health of all living organisms whose life depends on aquatic environments. In this research, the LCNF was selected as the natural adsorbent for Pb removal taking into account many benefits including biodegradability, abundance, and high specific surface area, as well as easier separation of contaminated solutions. Therefore, according to previous studies, LCNFs is one of the most effective adsorbents in removing pollutants from aquatic environments. In this study, LCNFs were prepared for the removal of Pb and structural properties of the synthesized adsorbent were characterized using transmission electron microscopy (TEM), X-ray diffraction (XRD) spectrometry,and Fourier-transform infrared spectroscopy (FTIR) techniques.
2. Materials and Methods
2.1. Materials
2.1.1. Preparation of LCNFs
The nanofiber was obtained from Nano Novin Polymer Co. (Sari city, Iran). First, lignocellulosic pulp prepared from beech, common hornbeam, and populus trees under the neutral sulfite semichemical process containing unbleached cellulose fibers (including lignin and hemicellulose) was provided from Mazandaran Wood and Paper Industries, Iran. The pulp was washed several times with distilled water, and then a suspension of 1% LCNFs was prepared and passed twice through a disc mill (MKCA6-3; Masuko Sangyo Co., Ltd., Japan) to prepare LCNFs. The disk mill has two discs, fixed and rotating. The LCNFs were produced during the passage of fibers between two discs due to the shear and compressive forces.
2.1.2 Chemicals
All chemicals (Pb (NO3)2. 6H2O, hydrochloric acid, and sodium hydroxide) used were of analytical grade. They were used as received without any further purification and were obtained from Sigma–Aldrich (Steinheim, Germany). The pH was adjusted using 0.1 M NaOH and 0.1 M HCl. The stock solution (1000 mg/L) was prepared from Pb (NO3)2 in distilled water. Other metal solutions required for further experiments were prepared from this solution.
2.1. 3. Instrumentation
The devices used for testing included atomic absorption spectroscopy (AAS, Unicam-919) to obtain the final equilibrium concentration (absorbed heavy metal concentration), pH meter (AZ86552) to measure pH, incubator shaker (IKA KS 4000 ic, Germany) for mixing adsorbent and adsorbate according to the parameters tested, centrifuge (HERMLE Z300, the USA) for separating suspended particles from the solution, digital scale (BANDS, BS-3003) to weight adsorbent and Pb with high accuracy, XRD (X’Pert Pro, Analytical Co., the Netherlands) to investigate the adsorbent structure, FT-IR (WQF-520) for obtaining spectra and also identifying molecules and functional groups, and TEM (Zeiss-EM10C) to determine the characteristics and size distribution of LCNFs.
2.2. Methods
2.2.1. Preparation of Standard Lead Stock Solution
The standard lead stock solution (1000 mg/L) was prepared with distilled water and Pb (NO3)2. 6H2O. To this end, 1000 mg (1 g) of Pb was dissolved in 1 L of distilled water. The amount (g) of Pb salt required to make this solution was calculated to be about 1.598 g based on the molecular mass of Pb nitrate (331.02 g/mol), the molecular weight of Pb (207.02 g/mol), and the purity of Pb nitrate (99%). The nitrate salt was diluted with the distilled water in a 1000 mL Erlenmeyer flask. Other test solutions were prepared daily by diluting the stock solution with the distilled water. Variable factors included pH (4, 5, 6, 7, and 8), initial Pb concentration (10, 20, 30, 40, and 50 mg/L), and adsorbent dosage (0.1, 0.3, 0.6, 0.8, and 1 g).
2.2.2. Effect of pH
To this end, 0.3 g of LCNF was poured into 250-mL flasks. Then, metal solutions with an initial Pb concentration of 10 mg/L were added to each of the flasks. The solutions of 0.1 M NaOH and 0.1 M HCl were used to adjust the pH values to 4, 5, 6, 7, and 8. The solutions were shaken for 60 minutes at 100 rpm and 25°C and centrifuged at 4000 rpm for 5 minutes in order to separate the metal solution and the adsorbent. The metal solution concentration was measured by atomic absorption spectroscopy (AAS) and the adsorption rate was calculated.
2.2.3. Effect of Lead Concentrations
At this stage, the initial Pb concentration was considered variable, but the other parameters were constant. The Pb solutions were made with initial concentrations of 10, 20, 30, 40, and 50 mg/L. The pH of the solutions was adjusted to 6. To each solution, 0.3 g of LCNFs was added and then shaken for 60 minutes at 25°C in the shaker. For this purpose, the flasks used inside the incubator shaker (at 4000 rpm and 5 minutes) were taken and then a two-phase solution was made by centrifugation. The remaining heavy metal solution was measured by AAS.
2.2.4. Effect of Adsorbent Dosage
The Pb solution with the initial concentration of 10 mg/L was made to determine the optimal adsorbent dosage. At this stage, the pH of the solutions was adjusted to 6. To each of the solutions, different amounts of LCNFs (0.1, 0.3, 0.6, 0.8, 1 g) were added and then shaken for 60 minutes at 25°C in a shaker. Finally, the flasks used inside the incubator shaker (at 4000 rpm and 5 min) were taken and then a two-phase solution was made. The remaining heavy metal solution was measured by AAS.
2.2.5. Effect of Contact Time
At this stage, the time was considered variable, but other parameters were constant. The Pb solution was made at the concentration of 10 mg/L. The pH of the solutions was adjusted to 6. To each solution, 0.3 g of LCNFs was added and then stirred at 25°C in the incubator shaker (at 4000 rpm and 5 minutes) at contact times of 15, 30, 60, 90, and 120 minutes. In the end, the flasks used in the incubator shaker were taken and then a two-phase solution was made. The remaining heavy metal solution was measured by AAS.
2.2.6. Effect of Temperature
The Pb solution was made with initial concentration of 10 mg/L to evaluate the effect of reaction temperature on the removal efficiency. At this stage, the pH of solutions was adjusted to the optimum value. To each of the Pb solutions, 0.3 g of LCNFs was added and then was stirred at temperatures of 15, 20, 25, 30 and 40°C in the incubator shaker for 60 minutes. Finally, the flasks used inside the incubator shaker (at 4000 rpm and 5 minutes) were taken and then a two-phase solution was made. The solutions were prepared for measurement.
2.2.7. Calculation of Adsorption Percentage and Lead Adsorption Capacity
The removal percentage and the Pb adsorption capacity by LCNFs in equilibrium state are calculated as follows (16):
Where q: the amount adsorbed per unit mass of adsorben in mg/g, Co: initial metal concentration before adsorption in mg/L, Ce: the remaining metal concentration in solution at equilibrium after adsorption in mg/g, v: the solution volume in liter, M: the adsorbent mass in gram (17).
The various stages of the experiments were performed in an in vitro batch system with three replications. The data were analyzed by SPSSversion 21.0. The charts and the averages were obtained using this software. The ANOVA and Duncan’s test were applied at the significance level of 0.05 for assessing each variable.
3. Results and Discussion
3.1. Transmission Electron Microscopy Images of LCNFs
In order to study the diameter of LCNFs, TEM analysis was applied. Fig. 1 shows the TEM images of LCNFs; the diameter of the used material was less than 100 nm (in the range of nanometers). The mean diameter of LCNFs was 65±10 nm.
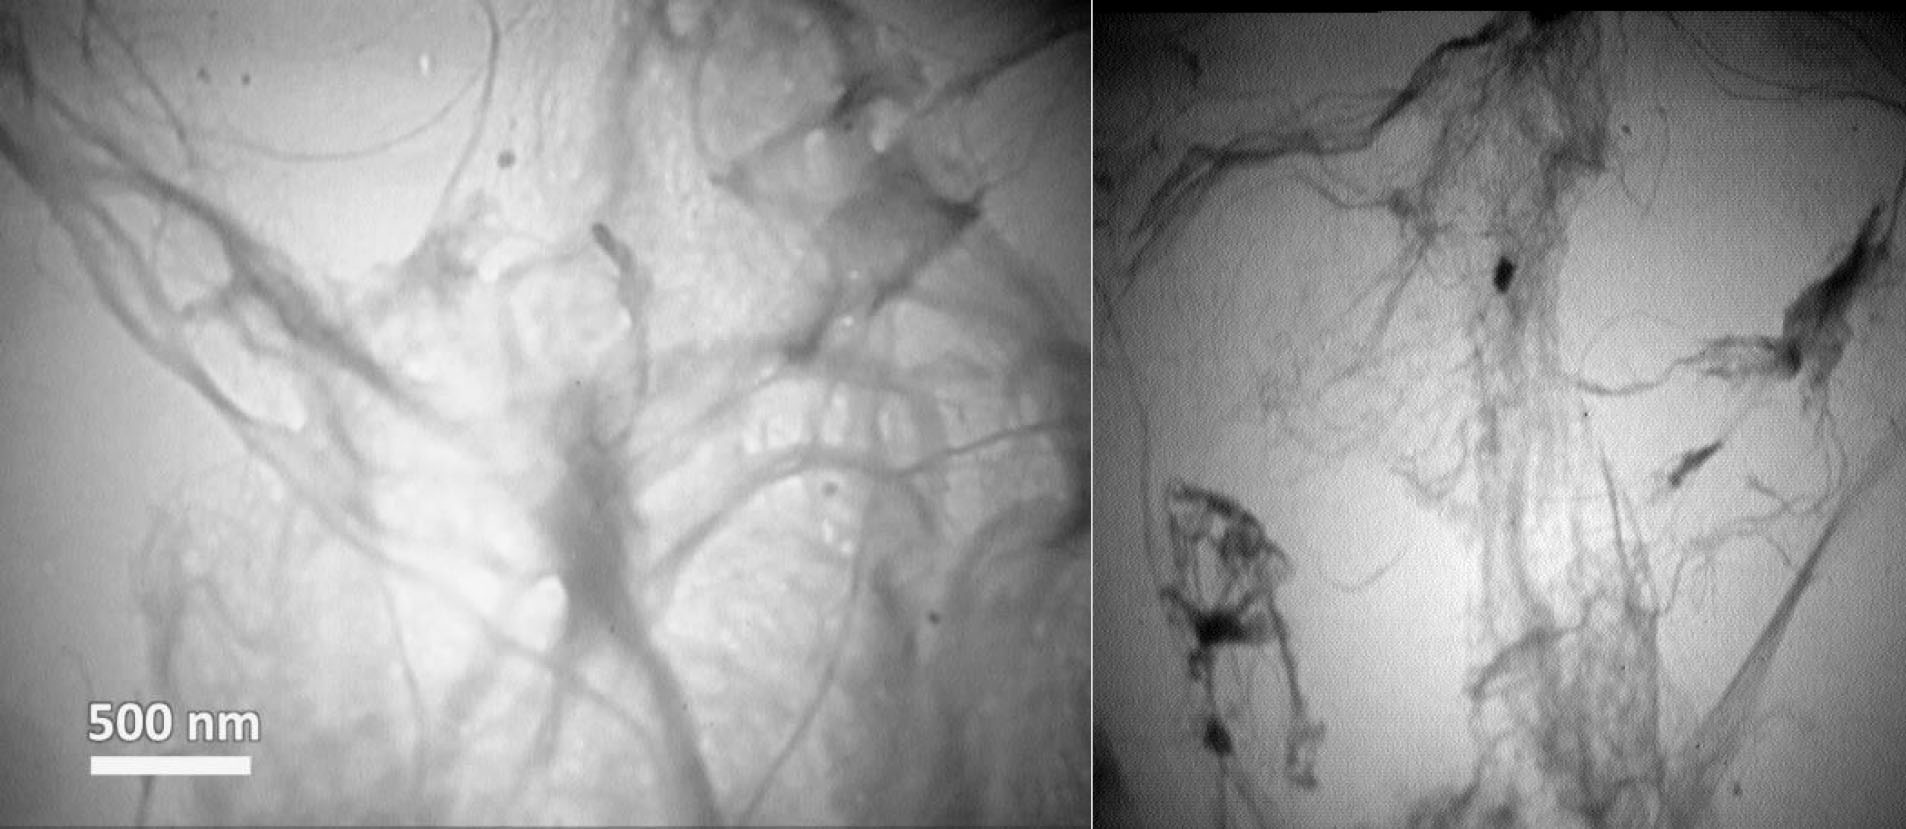
Figure 1.
TEM Images of LCNFs.
.
TEM Images of LCNFs.
3.2. X-Ray Diffraction Spectrometry
Fig. 2 shows the XRD analysis determining the crystalline structure of the adsorbent. As can be seen, the peaks of nano-adsorbent have been observed at 2Ѳ of 15, 16, 22.5 and 35, all of which represent the crystalline cellulose. Therefore, since hemicelluloses and lignin in the nanoadsorbent have no crystalline structure, no peak has been observed in the XRD curve.
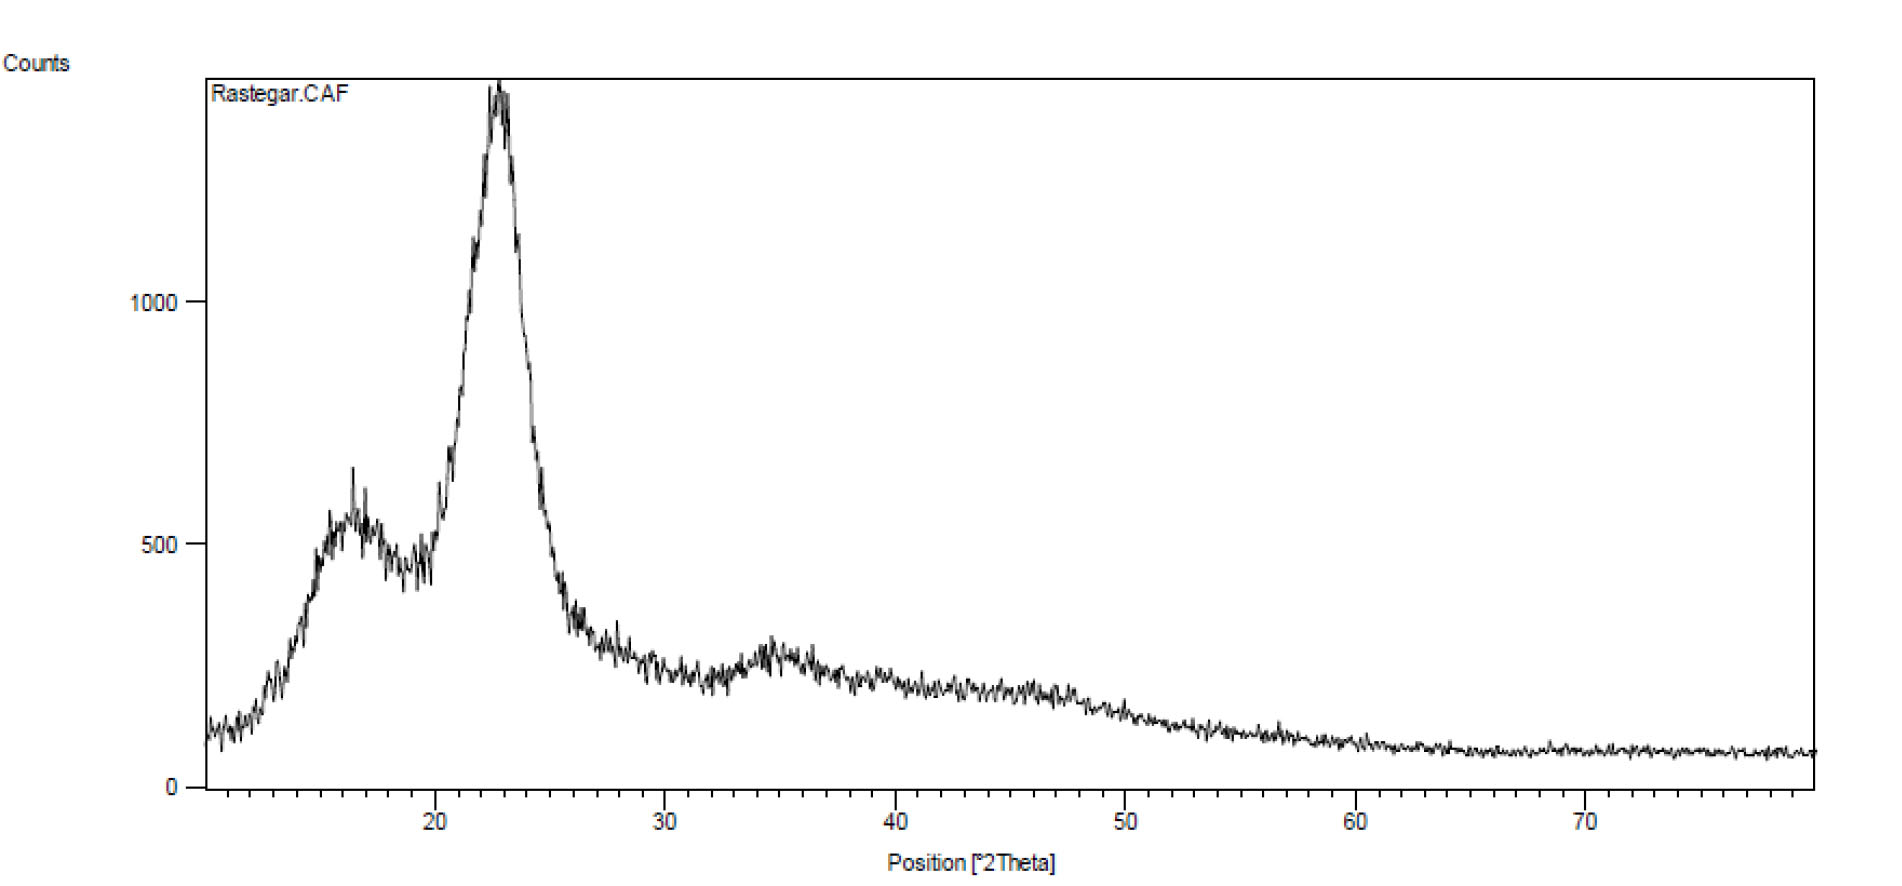
Figure 2.
XRD Analysis of Lead Adsorption by LCNFs.
.
XRD Analysis of Lead Adsorption by LCNFs.
3.3. Fourier Transform-Infrared Spectroscopy
The FT-IR analysis was used to determine the superficial groups of LCNFs. Fig. 3 indicates the FT-IR spectra of LCNFs prior to the Pb adsorption (red curve) and after Pb adsorption (blue curve). As shown in Fig. 3, the wide peak (the left side) in the region of 3000-3600 cm-1 (3469.31 cm-1) is related to the –OH (hydroxyl) or -NH functional groups in the FTIR spectrum before absorbing Pb by LCNFs. The peak in the region of 1635.34 cm-1 is related to the functional group of C = O. The next weak band in the region of 2098.17 cm-1 is probably related to the C≡C or C≡N functional groups. In the FT-IR spectrum after absorbing Pb by LCNFs, the -OH group in 3469.31 cm-1 band was shifted to 3461.6 cm-1 band after absorbing Pb ions, and the C = O group in 1635.34 cm-1 band was shifted to 2861.84 cm-1 band after absorbing Pb ions, which indicates the involvement of these functional groups in the adsorption process (18). The weak band in the region of 2925.48 cm-1 after adsorption is probably related to the SP3 C-H stretch (C = C band in the region of 2098.17 cm-1 reacts with the Pb and converts to C-C band in the region of 2925.48 cm-1 after being absorbed).
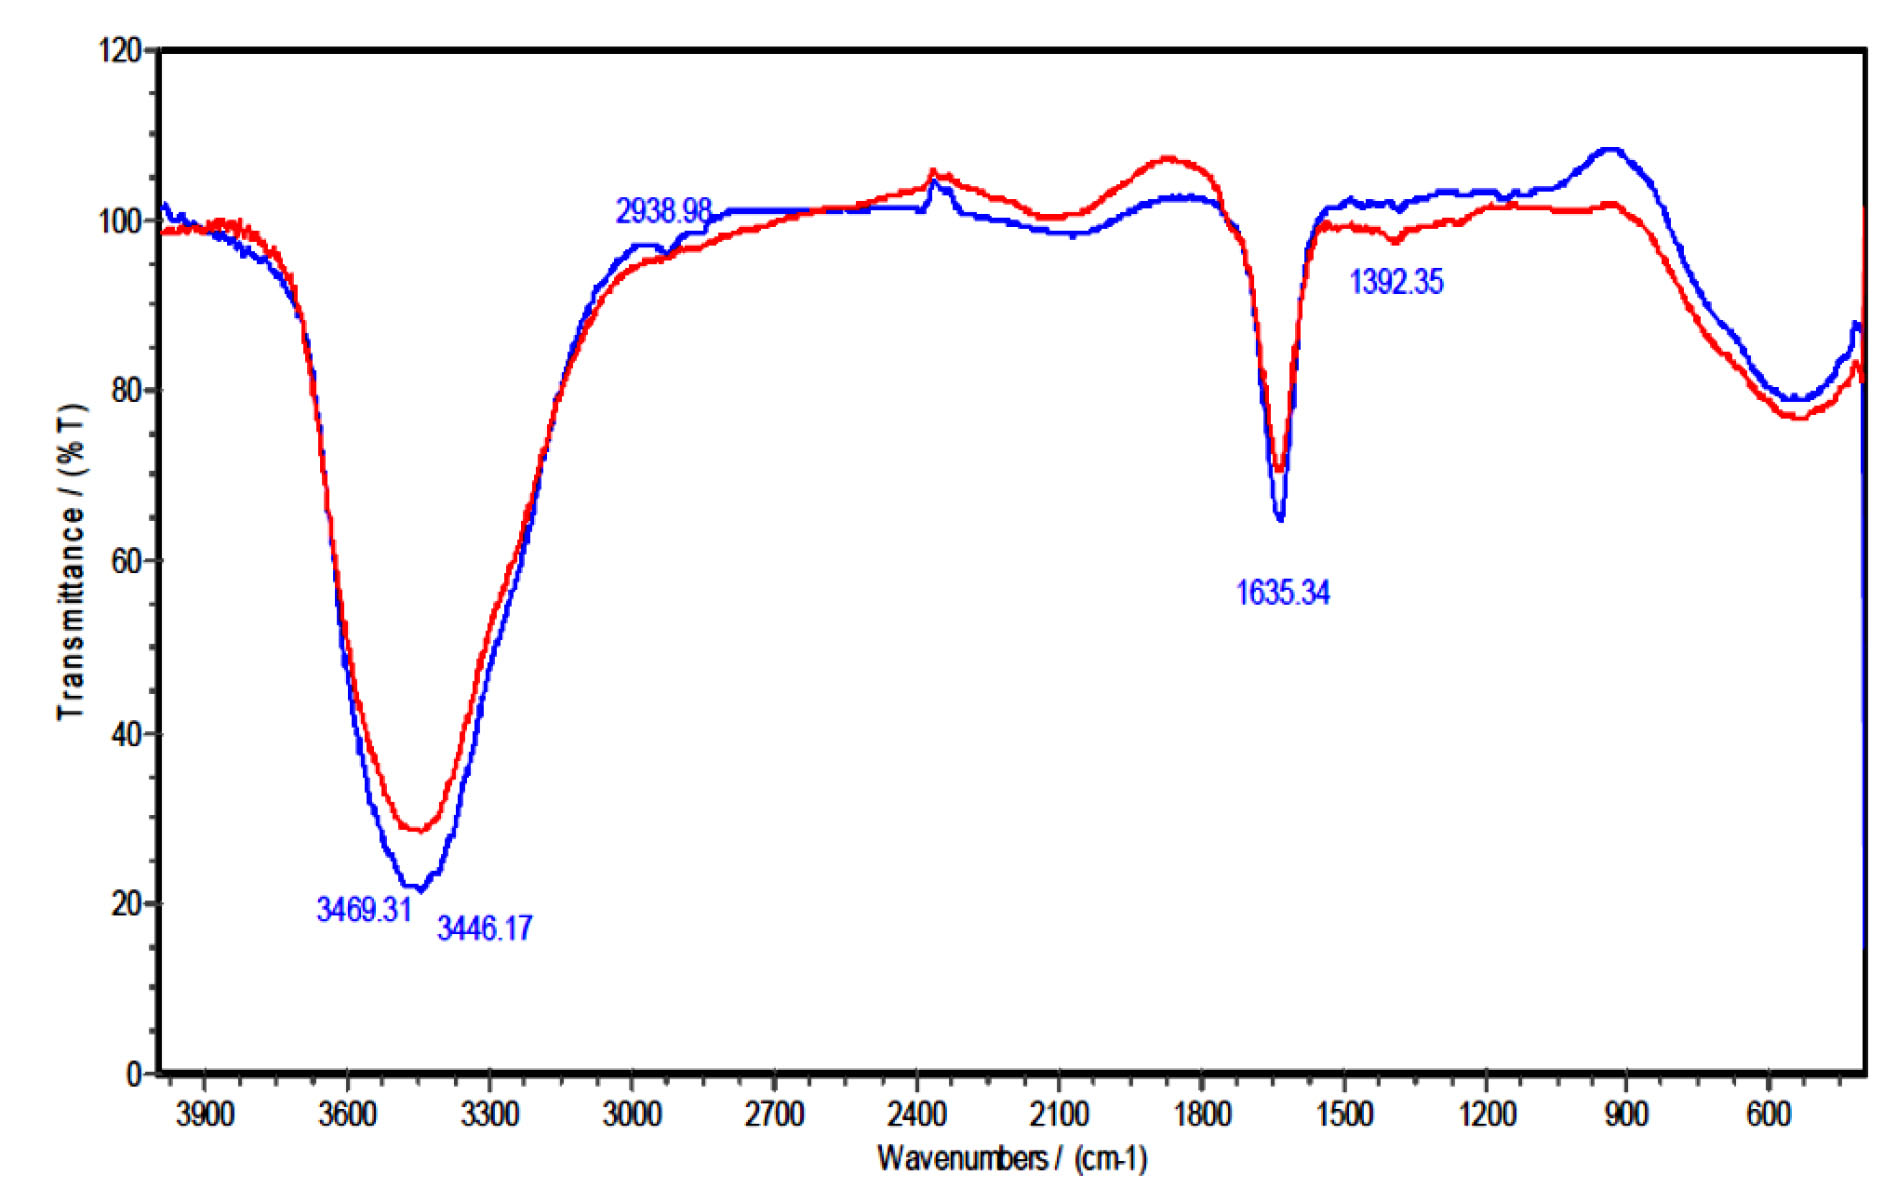
Figure 3.
FTIR Spectra of LCNFs Before and After Lead Adsorption.
.
FTIR Spectra of LCNFs Before and After Lead Adsorption.
3.4. Results of the Effects of Five Parameters
The ANOVA analysis was used to investigate the significant effect of variable factors on adsorption percentage and adsorption capacity of Pb ions. In this statistical method, the goal was to determine the existence of significant difference between the means. The results of ANOVA analysis of the effects of variable factors on Pb ion adsorption are presented in Table 1.
Table 1.
Results of ANOVA Analysis of the Effect Variable Factors on Pb Ion Adsorption
|
Source of Variation
|
Degree of Freedom
|
Mean Squares
|
|
Metal Removal Percentage
|
Metal Adsorption Capacity
|
| Treatment (pH) |
4 |
410.066** |
0.456** |
| Error |
10 |
0.173 |
0 |
| Treatment (time) |
4 |
32.156** |
0.036** |
| Error |
10 |
0.045 |
4.880×10⁻⁵ |
| Treatment (temperature) |
4 |
138.110** |
0.153** |
| Error |
10 |
0.322 |
0 |
| Treatment (initial Pb concentration) |
4 |
137.179** |
51.962** |
| Error |
10 |
0.091 |
0.001 |
| Treatment (adsorbent dosage) |
4 |
102.906** |
30.193 |
| Error |
10 |
0.028 |
0 |
** Significant at the 5% probability level.
3.4.1. Effect of pH
Based on ANOVA analysis, the effect of pH on adsorption percentage and Pb ion adsorption capacity at the 5% probability level was statistically significant (Table 1). The results of the evaluation of the pH effect on adsorption percentage and Pb ion adsorption capacity are presented in Fig. 4. According to the Fig. 4, the adsorption percentage and Pb ion adsorption capacity are very low in acidic environments (pH<3) because the functional groups on the adsorbent surface at lower pH values become protonated and lose their ability to bind to Pb ions (18). The Pb ion adsorption process reached its maximum at pH of 6, and the highest removal efficiency and adsorption capacity occurred at pH of 6. In this range, the amount of H+ ions reduced, followed by a decrease in the competition between H and Pb. Pb ions were more readily bound to the adsorbent and the adsorption percentage was increased (19).
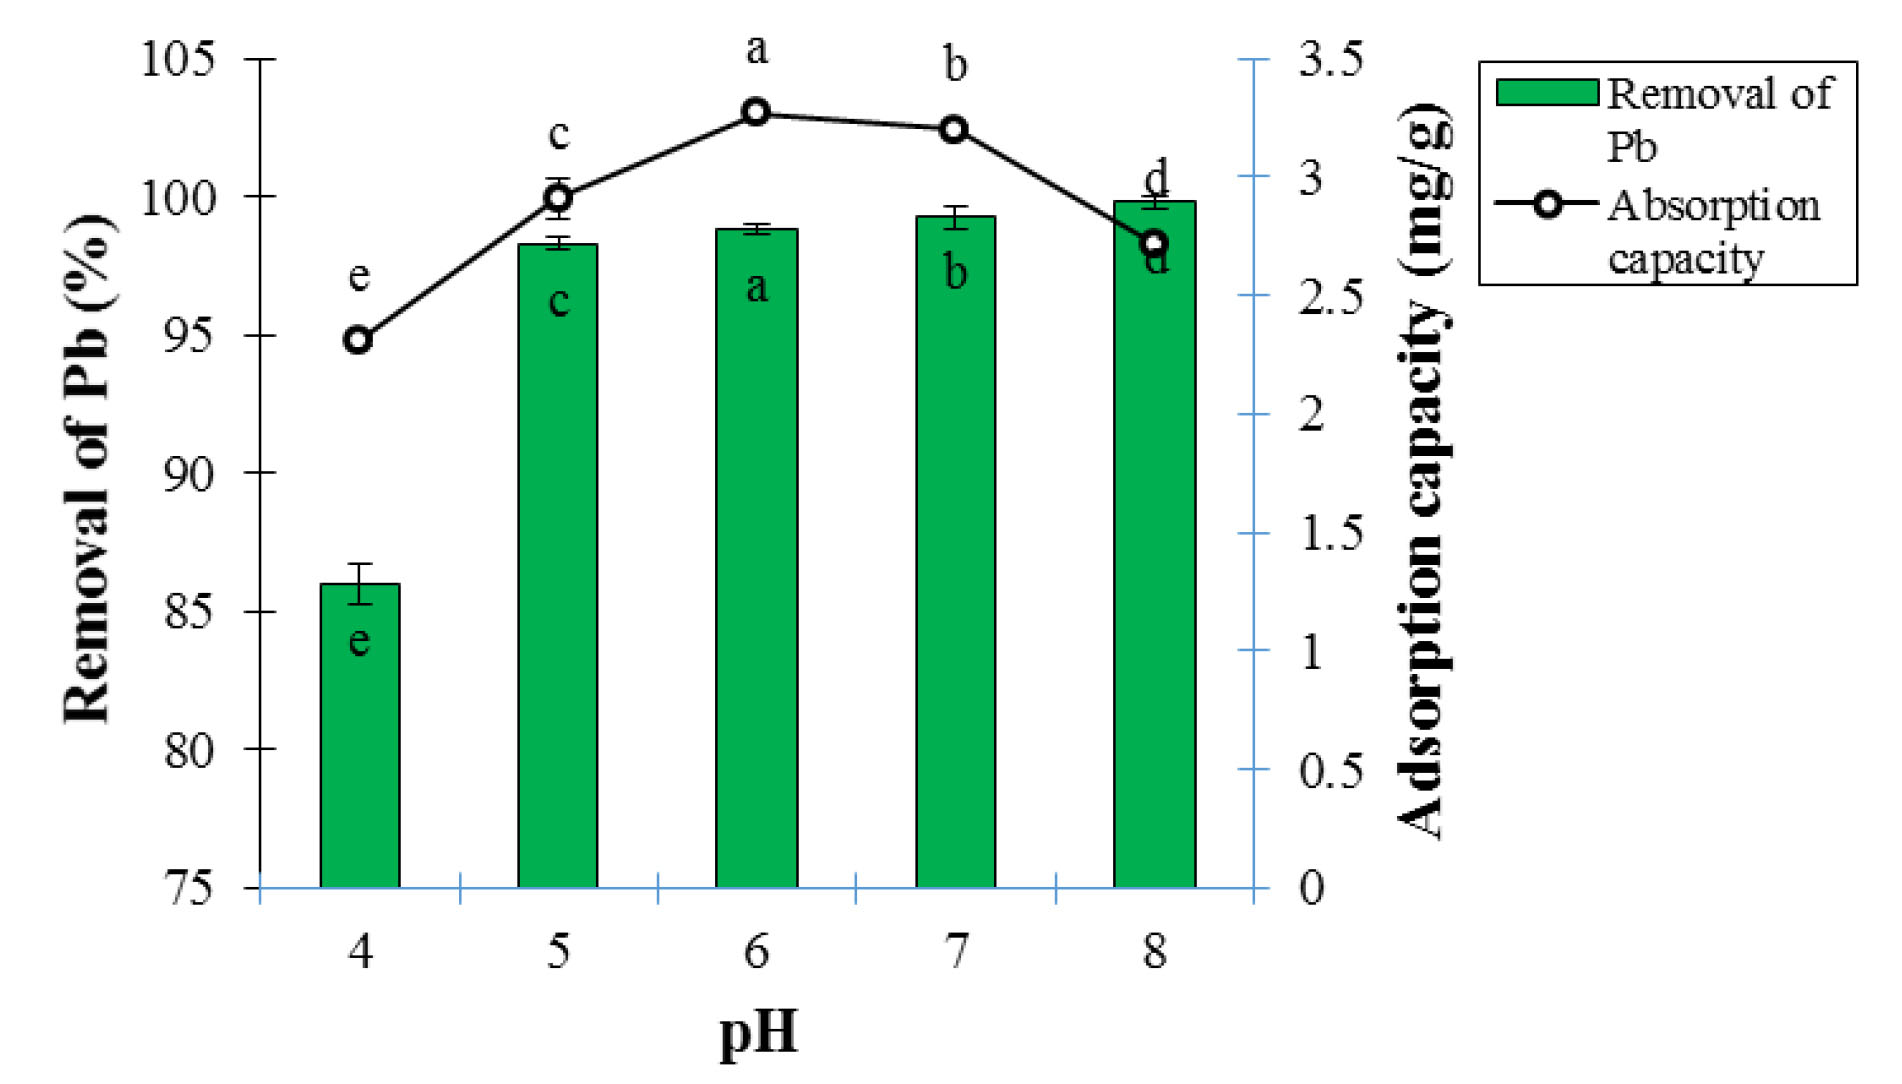
Figure 4.
Effect of pH on Adsorption Percentage and Lead Ion Adsorption Capacity at 25°C, Contact Time of 60 Minutes, and Adsorbent Dosage of 0.3 g (Mean ± Standard Error). Means with the same letter are not significantly different from each other (P>0.05, ANOVA followed by Duncan's test).
.
Effect of pH on Adsorption Percentage and Lead Ion Adsorption Capacity at 25°C, Contact Time of 60 Minutes, and Adsorbent Dosage of 0.3 g (Mean ± Standard Error). Means with the same letter are not significantly different from each other (P>0.05, ANOVA followed by Duncan's test).
The removal percentage and the adsorption capacity decreased again at pH of 7 due to the competition between OH- ions and (-COOH)- functional group of the adsorbent for binding to Pb2+ cation with increasing pH and the change of H+ to OH- ions. Increased competition reduces the possibility of the binding Pb2+ ion to functional group of the adsorbent (20). Deng et al used electrospun nanofibers to remove Pb from aqueous solutions. The results demonstrated that the maximum removal occurred at pH of 8.5 and the Pb adsorption percentage improved significantly with increasing pH in the range of 5 to 8.5. Their findings contradicted the results of this part of the study, because contrary to this study, the adsorption trend was on the rise with increasing pH (10). Arias et al applied the LCNFs to remove Hg; the results showed that the highest removal occurred at pH of 6 and Pb adsorption efficiency decreased significantly with increasing pH in the range of 6 to 8. Their findings were consistent with the results of this part of the study because of the decreasing trend observed in the adsorption of contaminant in both experiments with increasing pH (14).
3.4.2. Effect of Initial Pb Concentration
Based on the ANOVA analysis, the effect of initial concentration of Pb ion on adsorption percentage and Pb ion adsorption capacity was statistically significant at the 5% probability level (Table 1). As shown in Fig. 5, the adsorption percentage of Pb ion decreased gradually with increasing Pb concentration, because more adsorption sites were available to absorb Pb cations at low concentrations, and Pb ions were able to react with adsorption sites on the surface of the adsorbent, and thus increasing the adsorption efficiency (21). This trend was reversed in relation to the adsorption capacity; therefore, it enhanced with increasing metal ion concentration because each active adsorption site is surrounded by further Pb ions in high concentrations, and the adsorption rate increased per unit mass of adsorbent. Therefore, the adsorption capacity increased with the occupation of more adsorption sites (22).
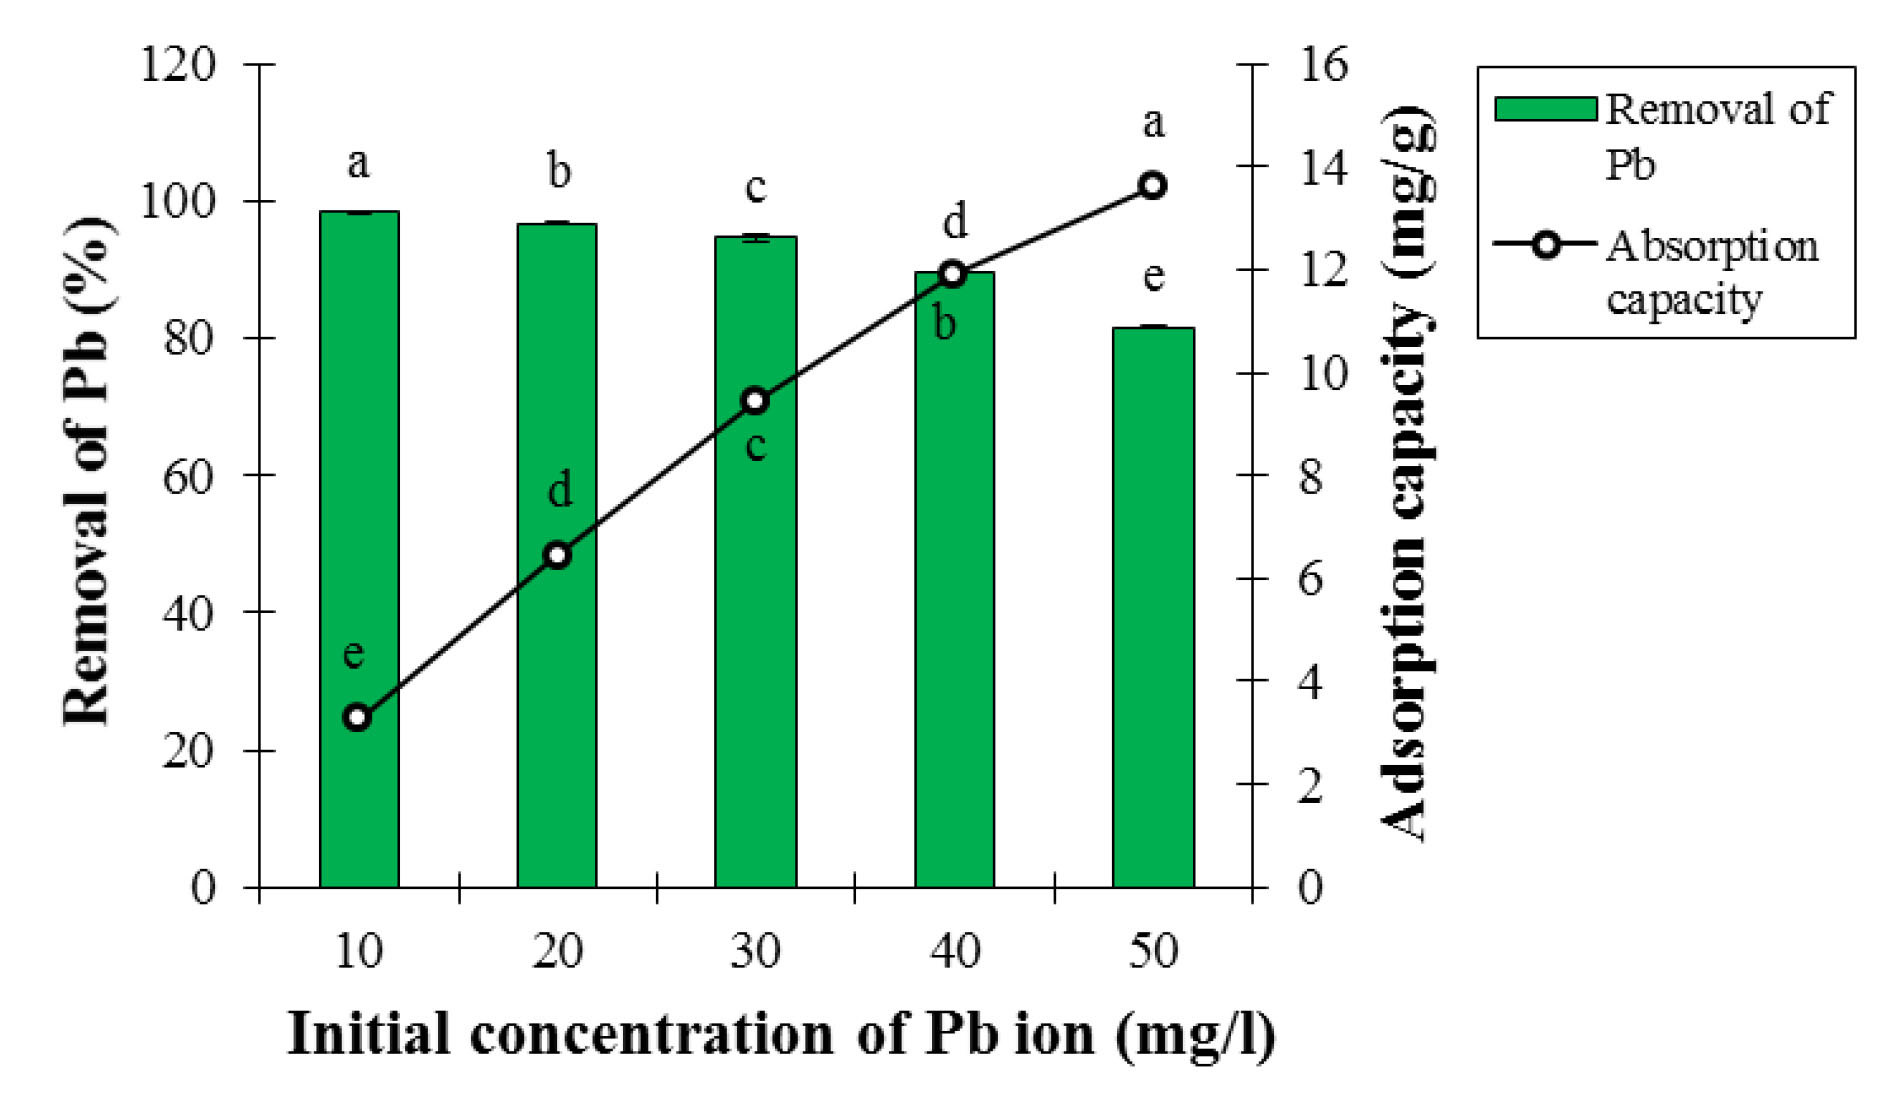
Figure 5.
Effect of Initial Lead Concentration on Adsorption Percentage and Lead Ion Adsorption Capacity at Contact Time of 60 minutes, Temperature of 25°C, pH of 6, and Adsorbent Dosage of 0.3 g (Mean ± Standard Error). Means with the same letter are not significantly different from each other (P>0.05, ANOVA followed by Duncan's test)
.
Effect of Initial Lead Concentration on Adsorption Percentage and Lead Ion Adsorption Capacity at Contact Time of 60 minutes, Temperature of 25°C, pH of 6, and Adsorbent Dosage of 0.3 g (Mean ± Standard Error). Means with the same letter are not significantly different from each other (P>0.05, ANOVA followed by Duncan's test)
Chitpong and Husson employed LCNFs to absorb Pb and Cd from aqueous solutions. They concluded that high initial Pb concentration had negative effect on the removal efficiency. As a result, their findings were in line with the results of this section of the study (23). Bhatti et al used the LCNFs to remove Pb and cobalt. They reported that an increase in the initial concentration of Pb and cobalt had negative effects on the removal efficiency, and their findings were consistent with the results of this section of the study (24).
3.4.3. Effect of Adsorbent Dosage
According to ANOVA analysis, the effect of adsorbent dosage on adsorption percentage and Pb ion adsorption capacity was statistically significant at the 5% probability level (Table 1). By examining the results presented in Fig. 6, the total metal adsorption rate increased with increasing the adsorbent mass per liter (adsorbent concentration) and higher percentage of the metal content was removed because the number of accessible adsorption sites increased, thereby increasing the adsorbent efficiency for Pb removal (25).
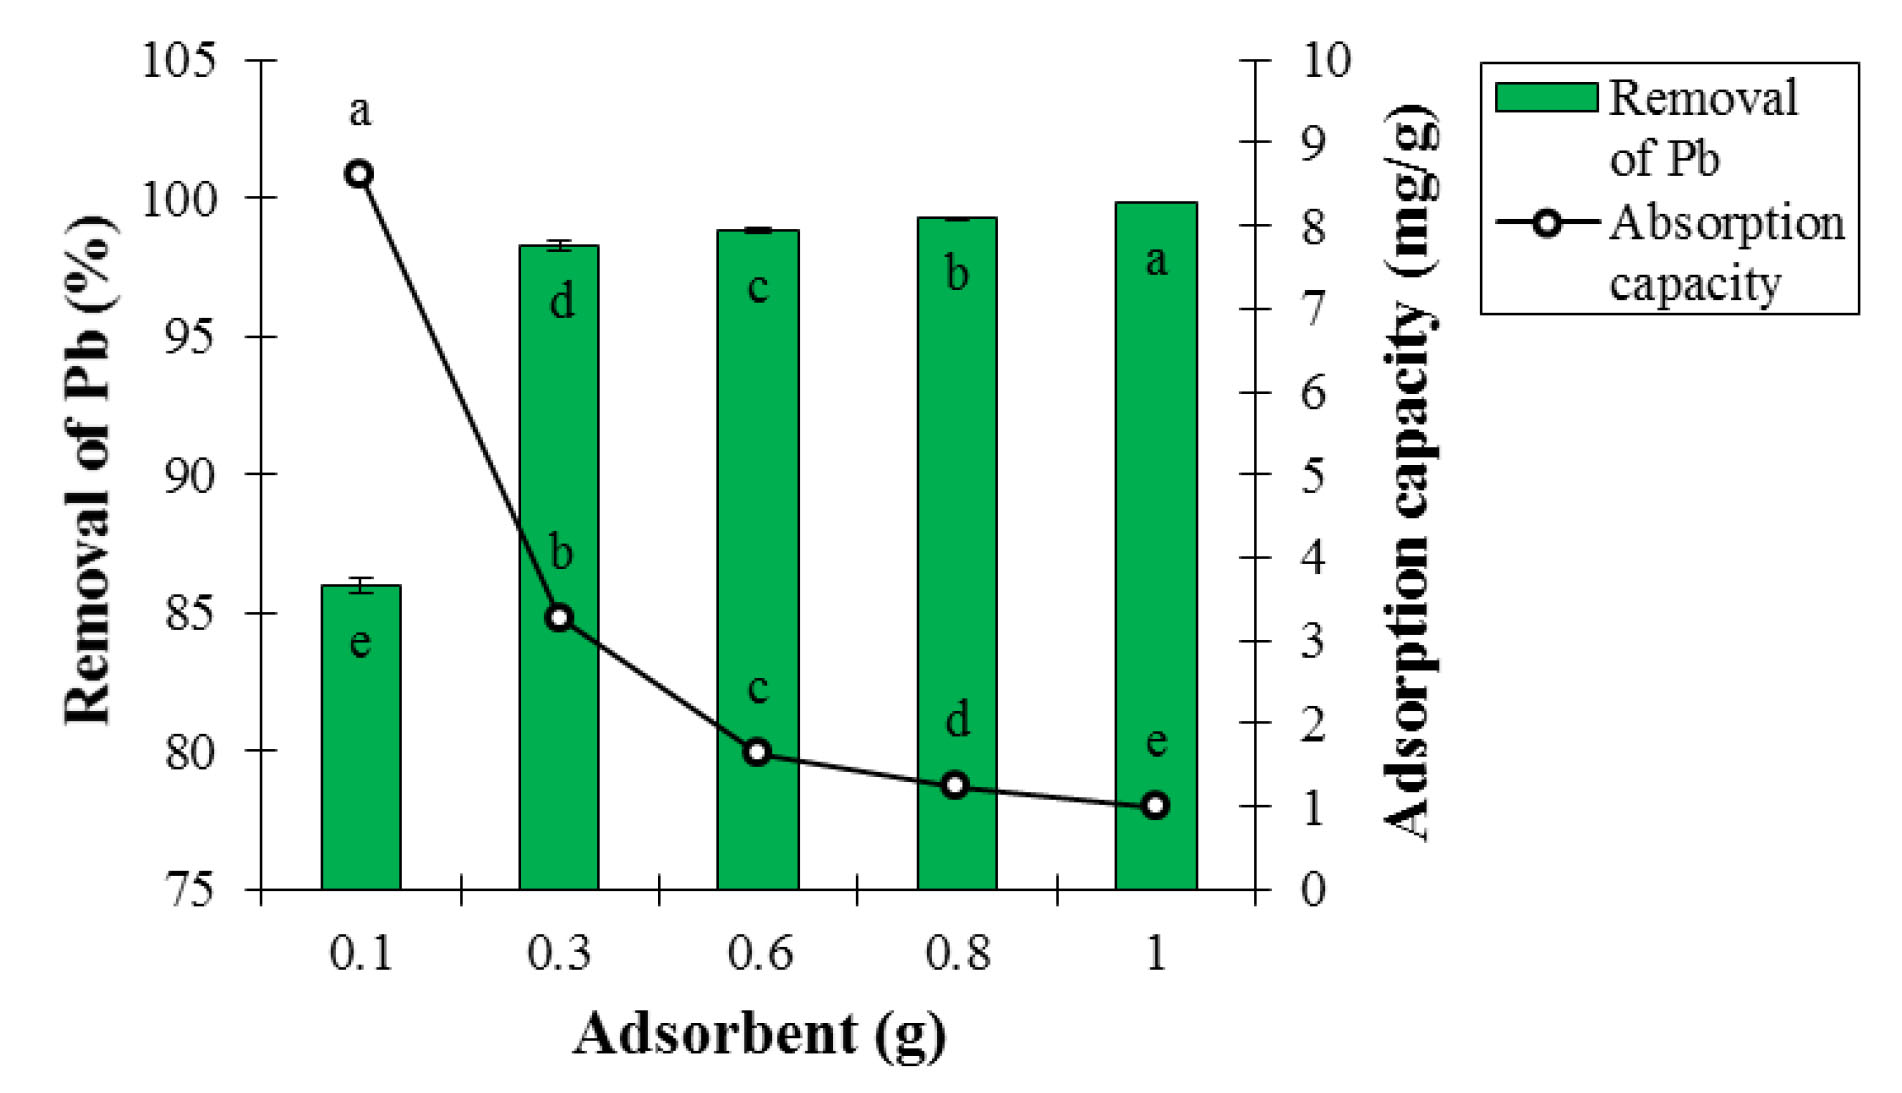
Figure 6.
Effect of Adsorbent Dosage on Adsorption Percentage and Lead Ion Adsorption Capacity at Contact Time of 60 minutes, Temperature of 25°C, and pH of 6 (Mean ± Standard Error). Means with the same letter are not significantly different from each other (P>0.05, ANOVA followed by Duncan's test)
.
Effect of Adsorbent Dosage on Adsorption Percentage and Lead Ion Adsorption Capacity at Contact Time of 60 minutes, Temperature of 25°C, and pH of 6 (Mean ± Standard Error). Means with the same letter are not significantly different from each other (P>0.05, ANOVA followed by Duncan's test)
This incremental trend in the adsorption rate continued until no significant change occurred in the adsorption level by increasing the adsorbent concentration, and until the adsorption equilibrium was reached. However, the adsorbent capacity decreased significantly as a result of increasing adsorbent mass per liter because the adsorption capacity reduced with increasing the adsorbent dosage so that adsorbate concentration was constant in this case but the adsorbent dosage was increased. Largitte et al used LCNFs to remove Pb. In the moderate level of adsorbent, the Pb adsorption efficiency was 97%-98%, which is in line with the results of this section of the study (26). Gopakumar et al applied the CNs for dye removal. The data showed that the highest removal occurred at the adsorbent dosage of 0.05 g (27). The findings are consistent with the results of this part of the research (26,27).
3.4.4. Effect of Temperature
According to ANOVA analysis, the effect of temperature on adsorption percentage and Pb ion adsorption capacity was statistically significant at the 5% probability level (Table 1). The results of temperature effect on adsorption percentage and Pb ion adsorption capacity are presented in Fig. 7. As it can be seen, with increasing temperature up to 25°C, the adsorption percentage and Pb ion adsorption capacity significantly increased at 5% test error because the adsorbent expansion and subsequent increased active sites for Pb removal were obtained by increasing probability of collision between the Pb ions and the adsorbent surface (28).
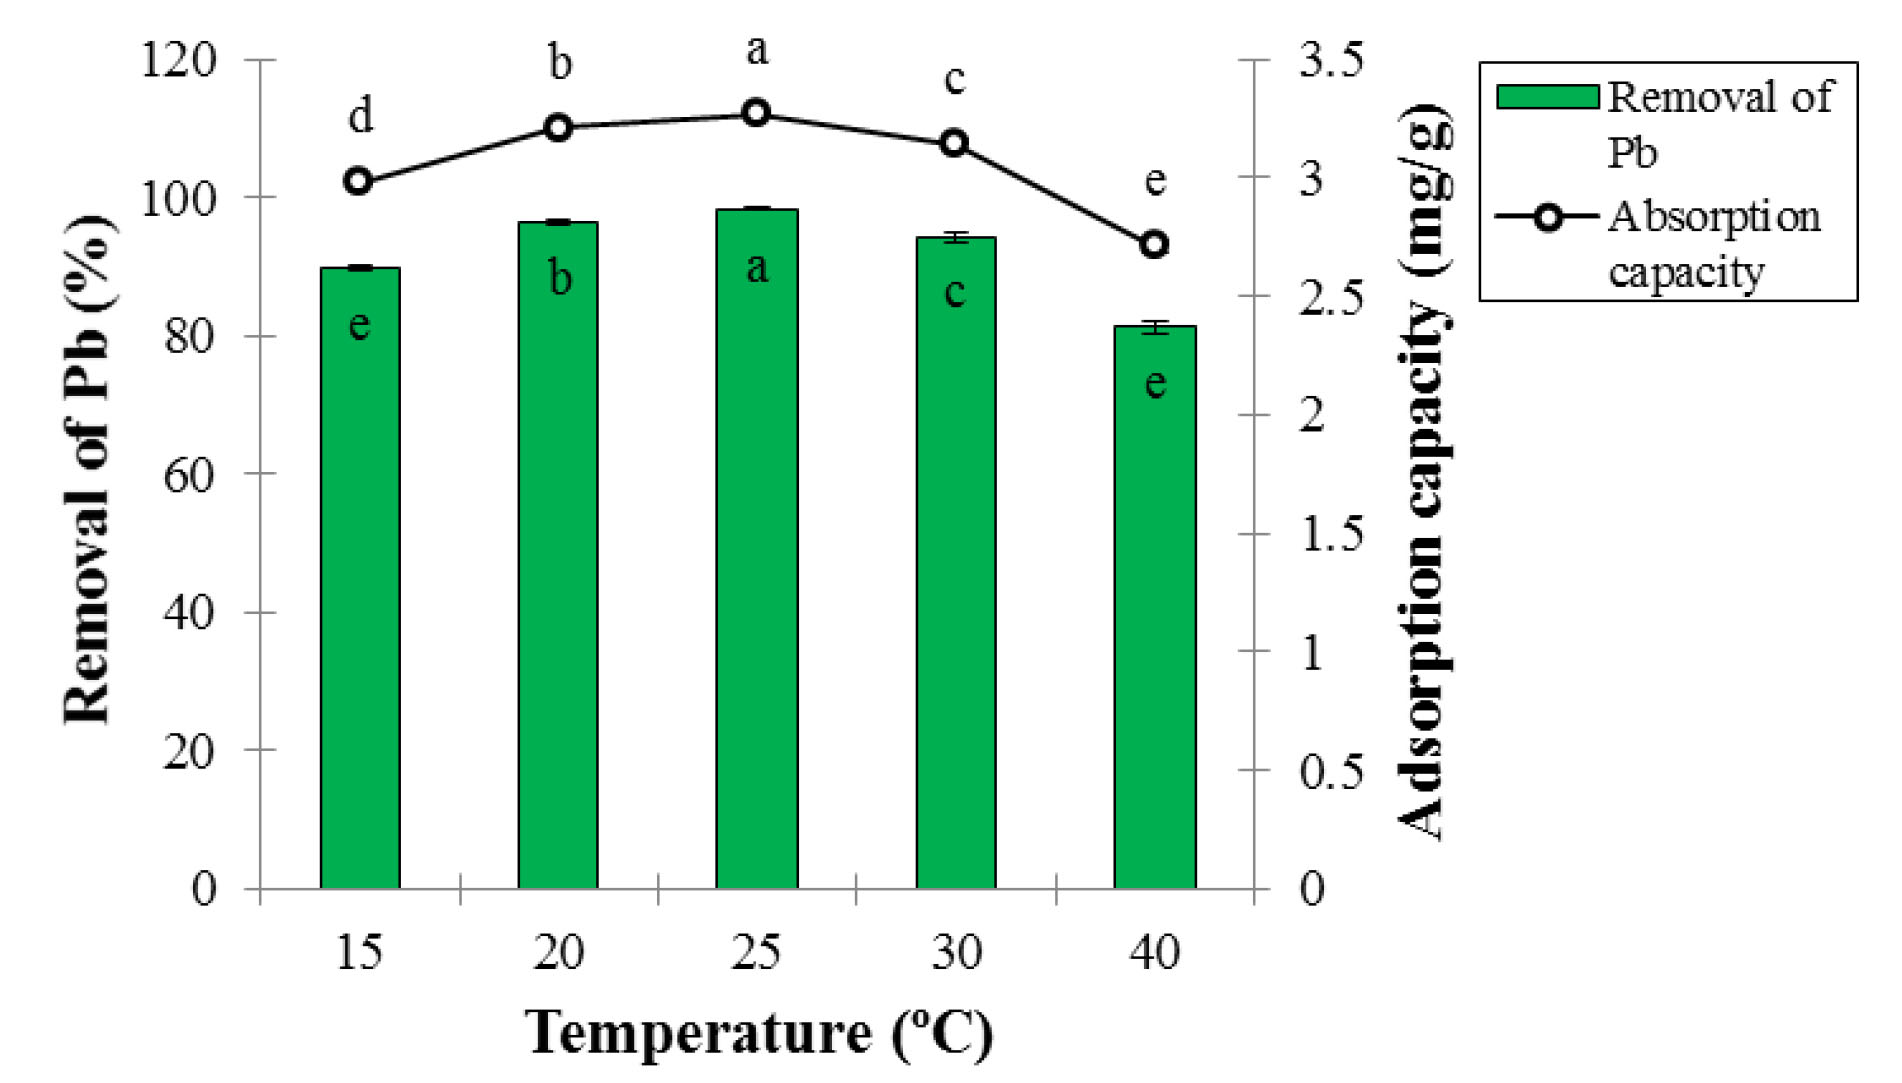
Figure 7.
Effect of Temperature on Adsorption Percentage and Lead Ion Adsorption Capacity at Contact Time of 60 Minutes, pH of 6, and Adsorbent Dosage of 0.3 g (Mean ± Standard Error). Means with the same letter are not significantly different from each other (P>0.05, ANOVA followed by Duncan's test).
.
Effect of Temperature on Adsorption Percentage and Lead Ion Adsorption Capacity at Contact Time of 60 Minutes, pH of 6, and Adsorbent Dosage of 0.3 g (Mean ± Standard Error). Means with the same letter are not significantly different from each other (P>0.05, ANOVA followed by Duncan's test).
The removal percentage and ion adsorption capacity significantly reduced with increasing the temperature. The temperature over 25°C caused a change in the adsorbent structure, a decrease in the penetration rate of Pb ion on the outer and inner layers of the adsorbent, and thus on the ability to absorb Pb. In fact, the structure of LCNFs changed at high temperatures, reducing the binding of Pb molecules to active sites of LCNFs (29). Nasiruddin Khan et al used activated carbon produced from lignocellulose materials to remove the Pb. The highest removal rate occurred at 45°C and the adsorption efficiency increased with increasing temperature, while the adsorption efficiency decreased with increasing temperature in this study, which is inconsistent with the results obtained from this section (30). Cai et al used the CNs reinforced composite to remove the chromium. The highest adsorption was observed at 25°C and the adsorption efficiency decreased with increasing temperature, which is consistent with the results obtained from this section (31).
3.4.5. Effect of Contact Time
Based on ANOVA analysis, the effects of contact time on adsorption percentage and Pb ion adsorption capacity were statistically significant at the 5% probability level (Table 1). The effects of contact time on adsorption percentage and Pb ion adsorption capacity are presented in Fig. 8. As can be seen, the adsorption percentage and the Pb ion adsorption capacity significantly increased with rising the contact time at 5% test error because of increasing probability of collision between Pb ions and adsorbent particles. The Pb adsorption with LCNFs occurred at high speed. This is due to the presence of many active sites on the adsorbent surface at the beginning of the adsorption process, which nearly reached the saturation point after about 30 minutes, and the adsorption rate reduced (32). On the other hand, the reason for constant adsorption after a certain period can be the great availability of adsorption sites of the adsorbent to be occupied over time due to the repulsive force between the molecules adsorbed in the solid phase and solution (33).
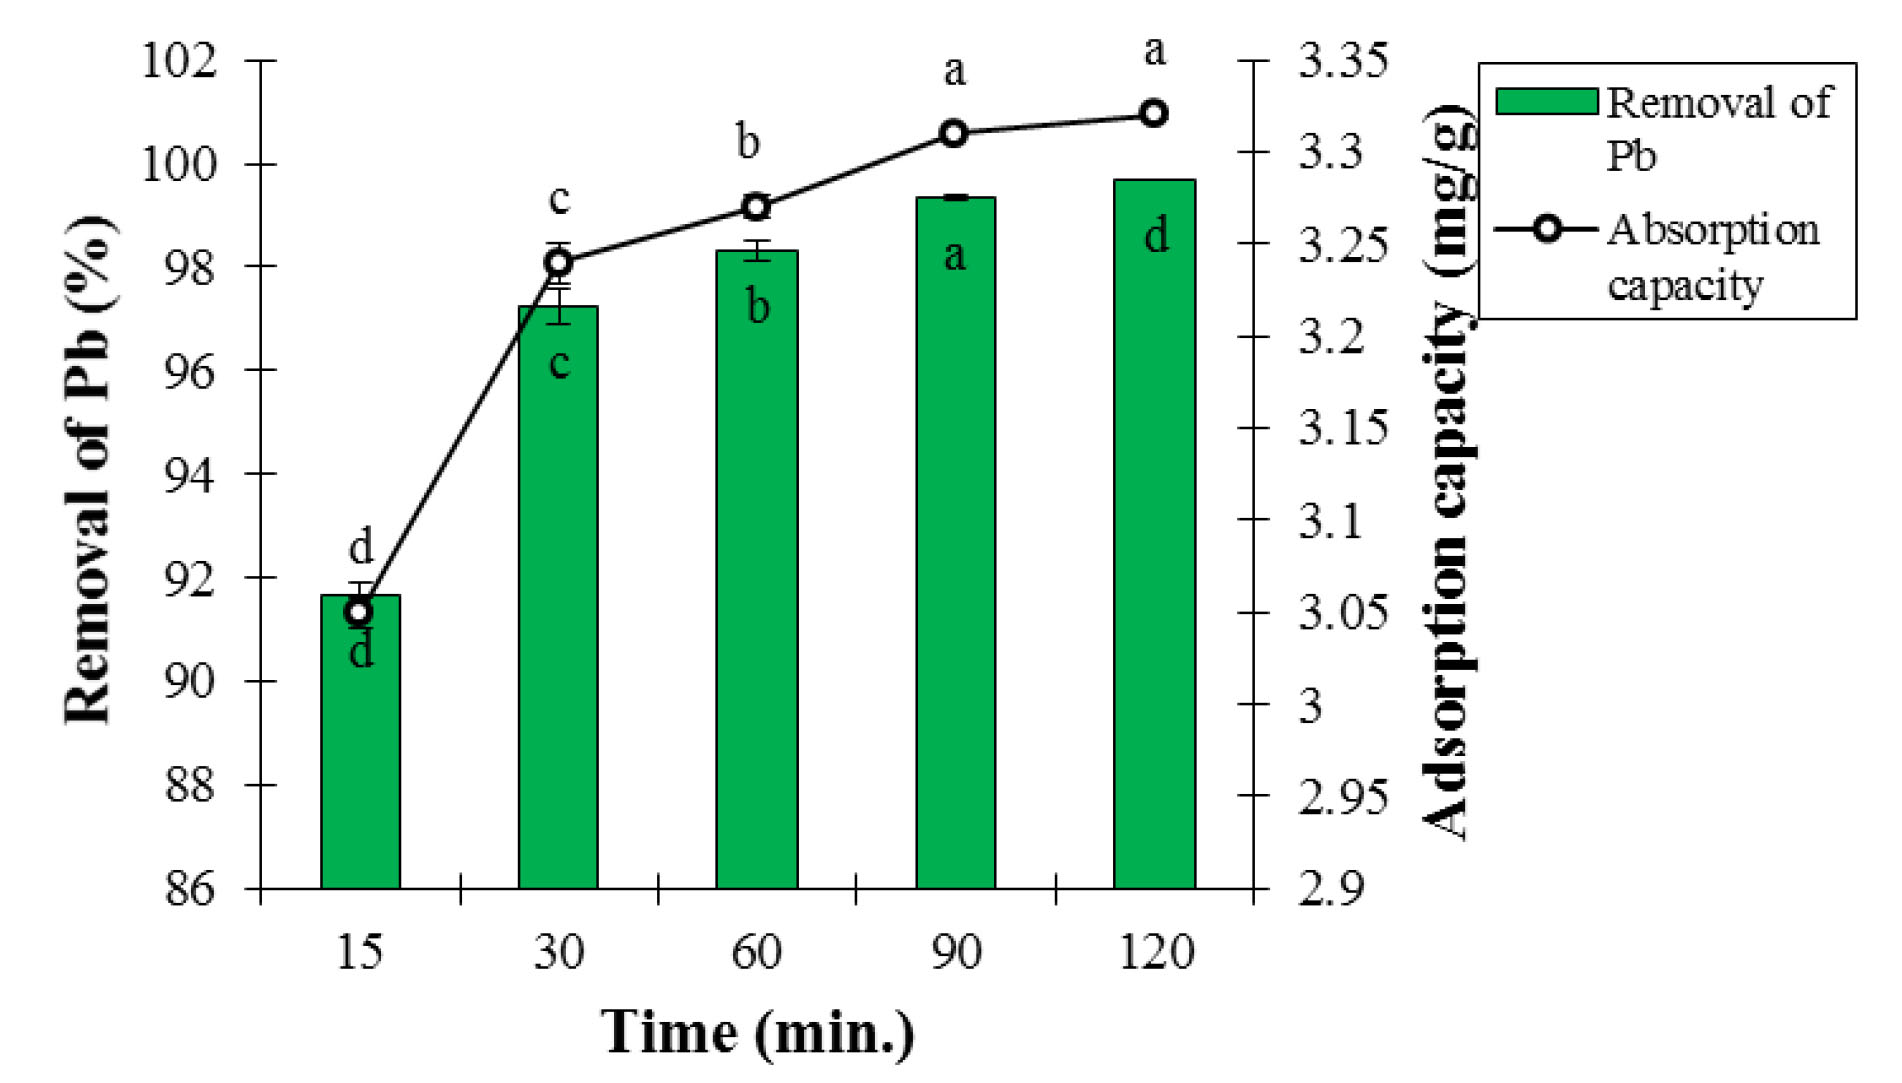
Figure 8.
Effect of Contact Time on Adsorption Percentage and Lead Ion Adsorption Capacity at Temperature of 25°C, pH of 6, and Adsorbent Dosage of 0.3 g (Mean ± Standard Error). Means with the same letter are not significantly different from each other (P>0.05, ANOVA followed by Duncan's test).
.
Effect of Contact Time on Adsorption Percentage and Lead Ion Adsorption Capacity at Temperature of 25°C, pH of 6, and Adsorbent Dosage of 0.3 g (Mean ± Standard Error). Means with the same letter are not significantly different from each other (P>0.05, ANOVA followed by Duncan's test).
Jain et al used CNs to remove the Pb from water. The highest Pb adsorption was obtained at contact time of 120 minutes while the highest Pb adsorption in this study occurred at the contact time of 60 minutes; therefore, it contradicted the findings of this section of the study (15). Li et al used lignin to remove Pb from aqueous solutions. The highest Pb adsorption was achieved at the contact time of 60 minutes, which is consistent with the findings of this section of the research (34).
4. Conclusion
The objective of this study was to investigate the adsorption efficiency and optimize the conditions of Pb adsorption process from aqueous solutions. Regarding the FT-IR spectra, the carboxylic acid group was known to be effective in absorbing Pb by LCNFs. The effects of pH, contact time, initial Pb concentration, temperature, and adsorbent dosage were assessed on the Pb adsorption efficiency. The highest removal efficiency (99.8%) was obtained at pH = 6, initial Pb concentration of 10 mg/L, temperature of 25°C, contact time of 60 minutes, and adsorbent dosage of 0.3 g. Determining the adsorbent dosage and estimating its adsorption capacity are important parameters in testing the adsorption. This could help to reduce the operational cost of treatment, contamination, and sludge production. In this study, the adsorption efficiency improved with increasing pH, but it decreased at pH values over 6. The optimal adsorption occurred at pH of 6. Additionally, it was observed that increasing the initial Pb concentration led to a reduction in the removal efficiency, and increasing the adsorbent dosage elevated removal efficiency. Based on the findings of this study (removal efficiency over 99%), the LCNF has a great potential for removing the Pb from aqueous solutions. The speed and capacity of Pb adsorption by the adsorbent is high due to small size, large surface area, unique network arrangement, and high reactivity of the nano-adsorbent.
Conflict of Interest Disclosures
The authors declare that they have no conflict of interests.
References
- Zhou Q, Liu Y, Li T, Zhao H, Alessi DS, Liu W. Cadmium adsorption to clay-microbe aggregates: implications for marine heavy metals cycling. Geochim Cosmochim Acta 2020; 290:124-36. doi: 10.1016/j.gca.2020.09.002 [Crossref] [ Google Scholar]
- Wani AL, Hammad Ahmad Shadab GG, Afzal M. Lead and zinc interactions-an influence of zinc over lead related toxic manifestations. J Trace Elem Med Biol 2021; 64:126702. doi: 10.1016/j.jtemb.2020.126702 [Crossref] [ Google Scholar]
- Chan SN, Chang L, Choi KW, Lee JHW, Fawell JK, Kwok KYT. Unraveling the causes of excess lead in drinking water supply systems of densely populated high-rise buildings in Hong Kong. Environ Sci Technol 2020; 54(22):14322-33. doi: 10.1021/acs.est.0c03232 [Crossref] [ Google Scholar]
- Elaigwu SE, Usman LA, Awolola GV, Adebayo GB, Ajayi RM. Adsorption of Pb(II) from aqueous solution by activated carbon prepared from cow dung. Environ Res J 2010; 4(4):257-60. doi: 10.3923/erj.2010.257.260 [Crossref] [ Google Scholar]
- Rezaei H, Rastegar S, Naseri S. Application of chitosan and activated carbon nano-composite in removal of nitrite, phosphate, and ammonia from aquaculture wastewater. Avicenna J Environ Health Eng 2019; 6(2):106-12. doi: 10.34172/ajehe.2019.14 [Crossref] [ Google Scholar]
- Hong G, Li X, Shen L, Wang M, Wang C, Yu X. High recovery of lead ions from aminated polyacrylonitrile nanofibrous affinity membranes with micro/nano structure. J Hazard Mater 2015; 295:161-9. doi: 10.1016/j.jhazmat.2015.04.020 [Crossref] [ Google Scholar]
- Salmani MH, Ehrampoush MH, Rafati L, Farzi M, Barzegar K. Study of Co(II) adsorption from aqueous solution using protein granules produced from chicken feather. Environ Health Eng Manag 2015; 2(4):193-7. [ Google Scholar]
- Zhang X, Wang X. Removal of Cu(II) from water environment using lignocellulose/montmorillonite nanocomposite-an industrial waste adsorbent. Asian J Chem 2014; 26(23):8173-80. doi: 10.14233/ajchem.2014.17770 [Crossref] [ Google Scholar]
- Shokati Poursani A, Nilchi A, Hassani AH, Shariat M, Nouri J. A novel method for synthesis of nano-γ-Al2O3: study of adsorption behavior of chromium, nickel, cadmium and lead ions. Int J Environ Sci Techno 2015; 12(6):2003-14. doi: 10.1007/s13762-014-0740-7 [Crossref] [ Google Scholar]
- Deng J, Kang X, Chen L, Wang Y, Gu Z, Lu Z. A nanofiber functionalized with dithizone by co-electrospinning for lead(II) adsorption from aqueous media. J Hazard Mater 2011; 196:187-93. doi: 10.1016/j.jhazmat.2011.09.016 [Crossref] [ Google Scholar]
- Rajawat DS, Kardam A, Srivastava S, Satsangee SP. Nanocellulosic fiber-modified carbon paste electrode for ultra trace determination of Cd(II) and Pb(II) in aqueous solution. Environ Sci Pollut Res Int 2013; 20(5):3068-76. doi: 10.1007/s11356-012-1194-4 [Crossref] [ Google Scholar]
- Kardam A, Raj KR, Srivastava S, Srivastava MM. Nanocellulose fibers for biosorption of cadmium, nickel, and lead ions from aqueous solution. Clean Technol Environ Policy 2014; 16(2):385-93. doi: 10.1007/s10098-013-0634-2 [Crossref] [ Google Scholar]
- Yang R, Aubrecht KB, Ma H, Wang R, Grubbs RB, Hsiao BS. Thiol-modified cellulose nanofibrous composite membranes for chromium(VI) and lead(II) adsorption. Polymer 2014; 55(5):1167-76. doi: 10.1016/j.polymer.2014.01.043 [Crossref] [ Google Scholar]
- Arias FEA, Beneduci A, Chidichimo F, Furia E, Straface S. Study of the adsorption of mercury(II) on lignocellulosic materials under static and dynamic conditions. Chemosphere 2017; 180:11-23. doi: 10.1016/j.chemosphere.2017.03.137 [Crossref] [ Google Scholar]
- Jain P, Varshney S, Srivastava S. Synthetically modified nano-cellulose for the removal of chromium: a green nanotech perspective. IET Nanobiotechnol 2017; 11(1):45-51. doi: 10.1049/iet-nbt.2016.0036 [Crossref] [ Google Scholar]
- Roy A, Chakraborty S, Kundu SP, Adhikari B, Majumder SB. Adsorption of anionic-azo dye from aqueous solution by lignocellulose-biomass jute fiber: equilibrium, kinetics, and thermodynamics study. Ind Eng Chem Res 2012; 51(37):12095-106. doi: 10.1021/ie301708e [Crossref] [ Google Scholar]
- Medvidović NV, Perić J, Trgo M. Testing of breakthrough curves for removal of lead ions from aqueous solutions by natural zeolite‐clinoptilolite according to the Clark kinetic equation. Sep Sci Technol 2008; 43(4):944-59. doi: 10.1080/01496390701870622 [Crossref] [ Google Scholar]
- Zhou D, Zhang L, Guo S. Mechanisms of lead biosorption on cellulose/chitin beads. Water Res 2005; 39(16):3755-62. doi: 10.1016/j.watres.2005.06.033 [Crossref] [ Google Scholar]
- Yousefi Z, Mohammadpour-Tahamtan R-A, Mashayekh-Salehi A. The efficiency of bivalve mollusk shell in removal of lead [Pb(II)] from aqueous solutions by central composite design model (CCD) and optimization of effective parameters. Journal of Mazandaran University of Medical Sciences 2014; 23(108):54-67. [ Google Scholar]
- Namasivayam C, Sureshkumar MV. Removal and recovery of molybdenum from aqueous solutions by adsorption onto surfactant-modified coir pith, a lignocellulosic polymer. Clean-Soil Air Water 2009; 37(1):60-6. doi: 10.1002/clen.200800130 [Crossref] [ Google Scholar]
- Tahiruddin NS, Ab Rahman SZ. Adsorption of lead in aqueous solution by a mixture of activated charcoal and peanut shell. World J Sci Technol Res 2013; 1(5):102-9. [ Google Scholar]
- Özcan AS, Özcan A, Tunali S, Akar T, Kiran I, Gedikbey T. Adsorption potential of lead(II) ions from aqueous solutions onto Capsicum annuum seeds. Sep Sci Technol 2007; 42(1):137-51. doi: 10.1080/01496390600956977 [Crossref] [ Google Scholar]
- Chitpong N, Husson SM. Polyacid functionalized cellulose nanofiber membranes for removal of heavy metals from impaired waters. J Memb Sci 2017; 523:418-29. doi: 10.1016/j.memsci.2016.10.020 [Crossref] [ Google Scholar]
- Bhatti HN, Bajwa II, Hanif MA, Bukhari IH. Removal of lead and cobalt using lignocellulosic fiber derived from Citrus reticulata waste biomass. Korean J Chem Eng 2010; 27(1):218-27. doi: 10.1007/s11814-009-0325-1 [Crossref] [ Google Scholar]
- Pillai SS, Deepa B, Abraham E, Girija N, Geetha P, Jacob L. Biosorption of Cd(II) from aqueous solution using xanthated nano banana cellulose: equilibrium and kinetic studies. Ecotoxicol Environ Saf 2013; 98:352-60. doi: 10.1016/j.ecoenv.2013.09.003 [Crossref] [ Google Scholar]
- Largitte L, Brudey T, Tant T, Dumesnil PC, Lodewyckx P. Comparison of the adsorption of lead by activated carbons from three lignocellulosic precursors. Microporous Mesoporous Mater 2016; 219:265-75. doi: 10.1016/j.micromeso.2015.07.005 [Crossref] [ Google Scholar]
- Gopakumar DA, Pasquini D, Henrique MA, de Morais LC, Grohens Y, Thomas S. Meldrum’s acid modified cellulose nanofiber-based polyvinylidene fluoride microfiltration membrane for dye water treatment and nanoparticle removal. ACS Sustain Chem Eng 2017; 5(2):2026-33. doi: 10.1021/acssuschemeng.6b02952 [Crossref] [ Google Scholar]
- Huang X, Pan M. The highly efficient adsorption of Pb(II) on graphene oxides: a process combined by batch experiments and modeling techniques. Journal of Molecular Liquids 2016; 215:410-6. doi: 10.1016/j.molliq.2015.12.061 [Crossref] [ Google Scholar]
- Ji F, Li C, Tang B, Xu J, Lu G, Liu P. Preparation of cellulose acetate/zeolite composite fiber and its adsorption behavior for heavy metal ions in aqueous solution. Chem Eng J 2012; 209:325-33. doi: 10.1016/j.cej.2012.08.014 [Crossref] [ Google Scholar]
- Nasiruddin Khan M, Bhutto S, Arslan Wasim A, Khurshid S. Removal studies of lead onto activated carbon derived from lignocellulosic Mangifera indica seed shell. Desalin Water Treat 2016; 57(24):11211-20. doi: 10.1080/19443994.2015.1043650 [Crossref] [ Google Scholar]
- Cai J, Lei M, Zhang Q, He J-R, Chen T, Liu S. Electrospun composite nanofiber mats of Cellulose@Organically modified montmorillonite for heavy metal ion removal: Design, characterization, evaluation of absorption performance. Compos Part A Appl Sci Manuf 2017; 92:10-6. doi: 10.1016/j.compositesa.2016.10.034 [Crossref] [ Google Scholar]
- Moradi O, Mirza B, Norouzi M, Fakhri A. Removal of Co(II), Cu(II) and Pb(II) ions by polymer based 2-hydroxyethyl methacrylate: thermodynamics and desorption studies. Iranian J Environ Health Sci Eng 2012; 9(1):31. doi: 10.1186/1735-2746-9-31 [Crossref] [ Google Scholar]
- Lv J, Luo L, Zhang J, Christie P, Zhang S. Adsorption of mercury on lignin: combined surface complexation modeling and X-ray absorption spectroscopy studies. Environ Pollut 2012; 162:255-61. doi: 10.1016/j.envpol.2011.11.012 [Crossref] [ Google Scholar]
- Li Z, Chen J, Ge Y. Removal of lead ion and oil droplet from aqueous solution by lignin-grafted carbon nanotubes. Chem Eng J 2017; 308:809-17. doi: 10.1016/j.cej.2016.09.126 [Crossref] [ Google Scholar]