Avicenna J Environ Health Eng. 12(1):40-50.
doi: 10.34172/ajehe.5563
Original Article
Challenges and Overall Performance of an Industrial Wastewater Treatment Plant: A Case Study of Bu-Ali Industrial Town, Hamadan
Madineh Jakipour Conceptualization, Data curation, Formal analysis, Investigation, Methodology, Writing – original draft, Writing – review & editing, 1 
Reza Shokoohi Writing – review & editing, 1
Ghorban Asgari Writing – review & editing, 1
Ghasem Azarian Investigation, Methodology, Writing – review & editing, 1
Hassan Zolghadrnasab Writing – review & editing, 1
Mostafa Leili Conceptualization, Data curation, Formal analysis, Funding acquisition, Investigation, Methodology, Project administration, Resources, Supervision, Writing – original draft, Writing – review & editing, 1, *
Author information:
1Department of Environmental Health Engineering, School of Public Health and Research Center for Health Sciences, Hamadan University of Medical Sciences, Hamadan, Iran
Abstract
The present study aimed to investigate and evaluate the performance of the Bu-Ali Industrial Town wastewater treatment plant (WWTP), Hamadan, Iran. In this study, the physicochemical and microbial characteristics and heavy metal contents of influent and effluent were evaluated. The mean values of total suspended solids (TSS), total dissolved solids (TDS), chemical oxygen demand (COD), dissolved oxygen (DO), biological oxygen demand (BOD5), cyanide, total coliform (TC), fecal coliform and pH in influent were 1210 mg/L, 2165.5 mg/L, 2187.5 mg/L, 2.4 mg/L, 967.5 mg/L, 20.8 mg/L, 1.3×10¹⁰ (MPN/100 mL), 1.2×10⁹ (MPN/100 mL) and 6.7, respectively. Additionally, the mean values of the mentioned parameters in effluent were 94.5 mg/L, 2370.4 mg/L, 220.7 mg/L, 5.2 mg/L, 113.4 mg/L, 2.0 mg/L, 1.7×10⁶ (MPN/100 mL), 3.5×10⁴ (MPN/100 mL), and 8.7, respectively. The concentrations of metals including V, Cd, Co, Cu, Cr, Hg, Ni, Pb, and Zn at the inlet of the treatment plant were measured to be 3.9, 14.5, 5.6, 77.9, 142.4,<0.3, 104.0, 73.8, and 720.6 ppb and at the treatment plant, the corresponding concentrations were<0.06, 11.8, 2.4, 14.6, 19.1,<0.3, 73.1, 10.8, and 34.5 ppb. Based on the results, the measured values of some parameters, such as BOD5, COD, coliforms, and cyanide in the effluent, were higher than the standards set by various organizations. Therefore, discharging such effluent into the environment can harm the ecosystem; their high values result from the lack of any pre-treatment units in various industries. Hence, by obliging certain industries to pre-treat their wastewater before discharging it into the combined wastewater collection system, the above-mentioned parameters can be adjusted to some extent. In addition, considering the high microbial load of the effluent, continuous disinfection and improvement of the disinfection unit can play a significant role in reducing the microbial load of the effluent.
Keywords: Wastewater treatment plant, Bu-Ali industrial town, Hamadan
Copyright and License Information
© 2025 The Author(s); Published by Hamadan University of Medical Sciences.
This is an open-access article distributed under the terms of the Creative Commons Attribution License (
https://creativecommons.org/licenses/by/4.0), which permits unrestricted use, distribution, and reproduction in any medium, provided the original work is properly cited.
Please cite this article as follows: Jakipour M, Shokoohi R, Asgari G, Azarian G, Zolghadrnasab H, Leili M. Challenges and overall performance of an industrial wastewater treatment plant: a case study of Bu-Ali industrial town, Hamadan. Avicenna J Environ Health Eng. 2025;12(1):40-50. doi:10.34172/ajehe.5563
1. Introduction
Accelerated evolution of industry, rapid population growth, increase in urbanization, change in lifestyle, agriculture, global warming, and increase in per capita water consumption have led to various forms of environmental pollution, including water, soil, and air (1,2). Today, the tendency of countries to industrialize due to its role in the development of countries has led to increased industrial waste entering the environment (3). Unfortunately, despite burgeoning industrial growth, the treatment and management of industrial waste have not been developed (4). Industrial wastes include liquid, solid, and gaseous wastes that enter the environment and have harmful effects on the environment, aquatic life, and humans (4,5). Various industries use fresh water in their processes instead of other sources, such as wastewater, due to turbidity, unpleasant smell, and color of such sources, leading to a sharp decrease in healthy water sources and an increase in the production of toxic wastewater (1,4). Based on the results of previous studies, the amount of wastewater produced annually is 1500 km³, 80% of which is released into the environment without treatment or with incomplete treatment in all over the world, and only 8% is fully treated, especially in developing countries. This proportion varies significantly between countries; in other words, 70% of produced wastewater is treated in high-income countries, 38% in middle-income countries, and only 28% in low-income countries (6,7). As mentioned before, in developing countries, due to the lack of access and cost-effectiveness of advanced treatment technologies, both domestic and industrial wastewater are discharged into rivers with insufficient treatment, which leads to the discharge of pollutants, especially heavy metals, into the environment (8,9). In addition to heavy metals, industrial effluents contain high amounts of organic and inorganic chemicals, oil/grease, dissolved and suspended solids, biological oxygen demand (BOD), chemical oxygen demand (COD), cyanide, and so on (10-13). Studies have shown that wastewater produced annually causes the death of more than 2 million children under 5 years of age, poses a risk of extinction to 24% of mammals and 12% of birds, and contributes to the worldwide emission of greenhouse gases including methane, carbon dioxide, and nitrogen oxide (6,14,15). In addition, discharge of pathogenic agents into aquatic environments can resulted in mutagenicity, the reduction of biological diversity, the bioaccumulation of toxins, the destruction of the aquatic environment due to the phenomenon of eutrophication or algal bloom due to the high concentration of nitrogen in wastewater, and the increase in water temperature, which should be taken into account in the mismanagement of industrial wastewater (16-18). Furthermore, the release of 300 to 400 megatons of various pollutants, including organic pollutants, dyes, and heavy metals, into waterways poses a significant threat to freshwater supplies (19). Therefore, water pollution is increasing rapidly and has become one of the most important problems in the world. Moreover, the lack of proper management and enforcement of environmental laws/limitations has exacerbated this problem (9,20).
Despite the harmful effects of wastewater containing pollutants entering ecosystems and water sources, rivers and surface water sources are still used as a place to discharge wastewater, and large amounts of pollutants enter them from industries and municipalities (5). In most Iranian cities, industrial wastewaters are discharged into the environment or water bodies after the treatment (21). For instance, regarding Bu-Ali industrial town in Hamadan, the effluent of the treatment plant was discharged into the environment and entered to the Jurqan River after treatment processes, and then it was used for agricultural purposes. Industrial units located in this industrial town sometimes do not comply with the standards for discharging wastewater into the treatment plant, and sometimes the improper performance of some treatment units during certain periods of operation has doubled the need to examine the performance of this treatment plant. Therefore, based on the above-mentioned background, we have investigated and evaluated the overall performance of the wastewater treatment plant (WWTP) of Bu-Ali Industrial Town.
2. Materials and Methods
2.1. Study Area
This study was conducted in the WWTP of Bu-Ali Industrial Town, Hamadan, Iran. The total area of this industrial town, which is geographically located 12 km northeast of Hamadan, is 145 hectares and contains 270 active industrial units, which occupy 85 hectares of the total area of the town. The food industry, metal industry, electrical industry, chemical industry, non-metal industry, wood industry, pulp and paper industry, and textile industry are among these industries. Wastewater from all of these industrial units is collected and entered into the WWTP of this industrial town.
2.2. Wastewater Treatment Plant
The WWTP is an aerated lagoon without sludge return, which has a daily capacity of 800 m3/d. The average inlet flow rate during the study period was 600 m³/d. The various units of this treatment plant include a pumping station, screening, grit chamber, equalization, anaerobic reactor, sedimentation lagoon, and chlorination pond (Fig. 1).
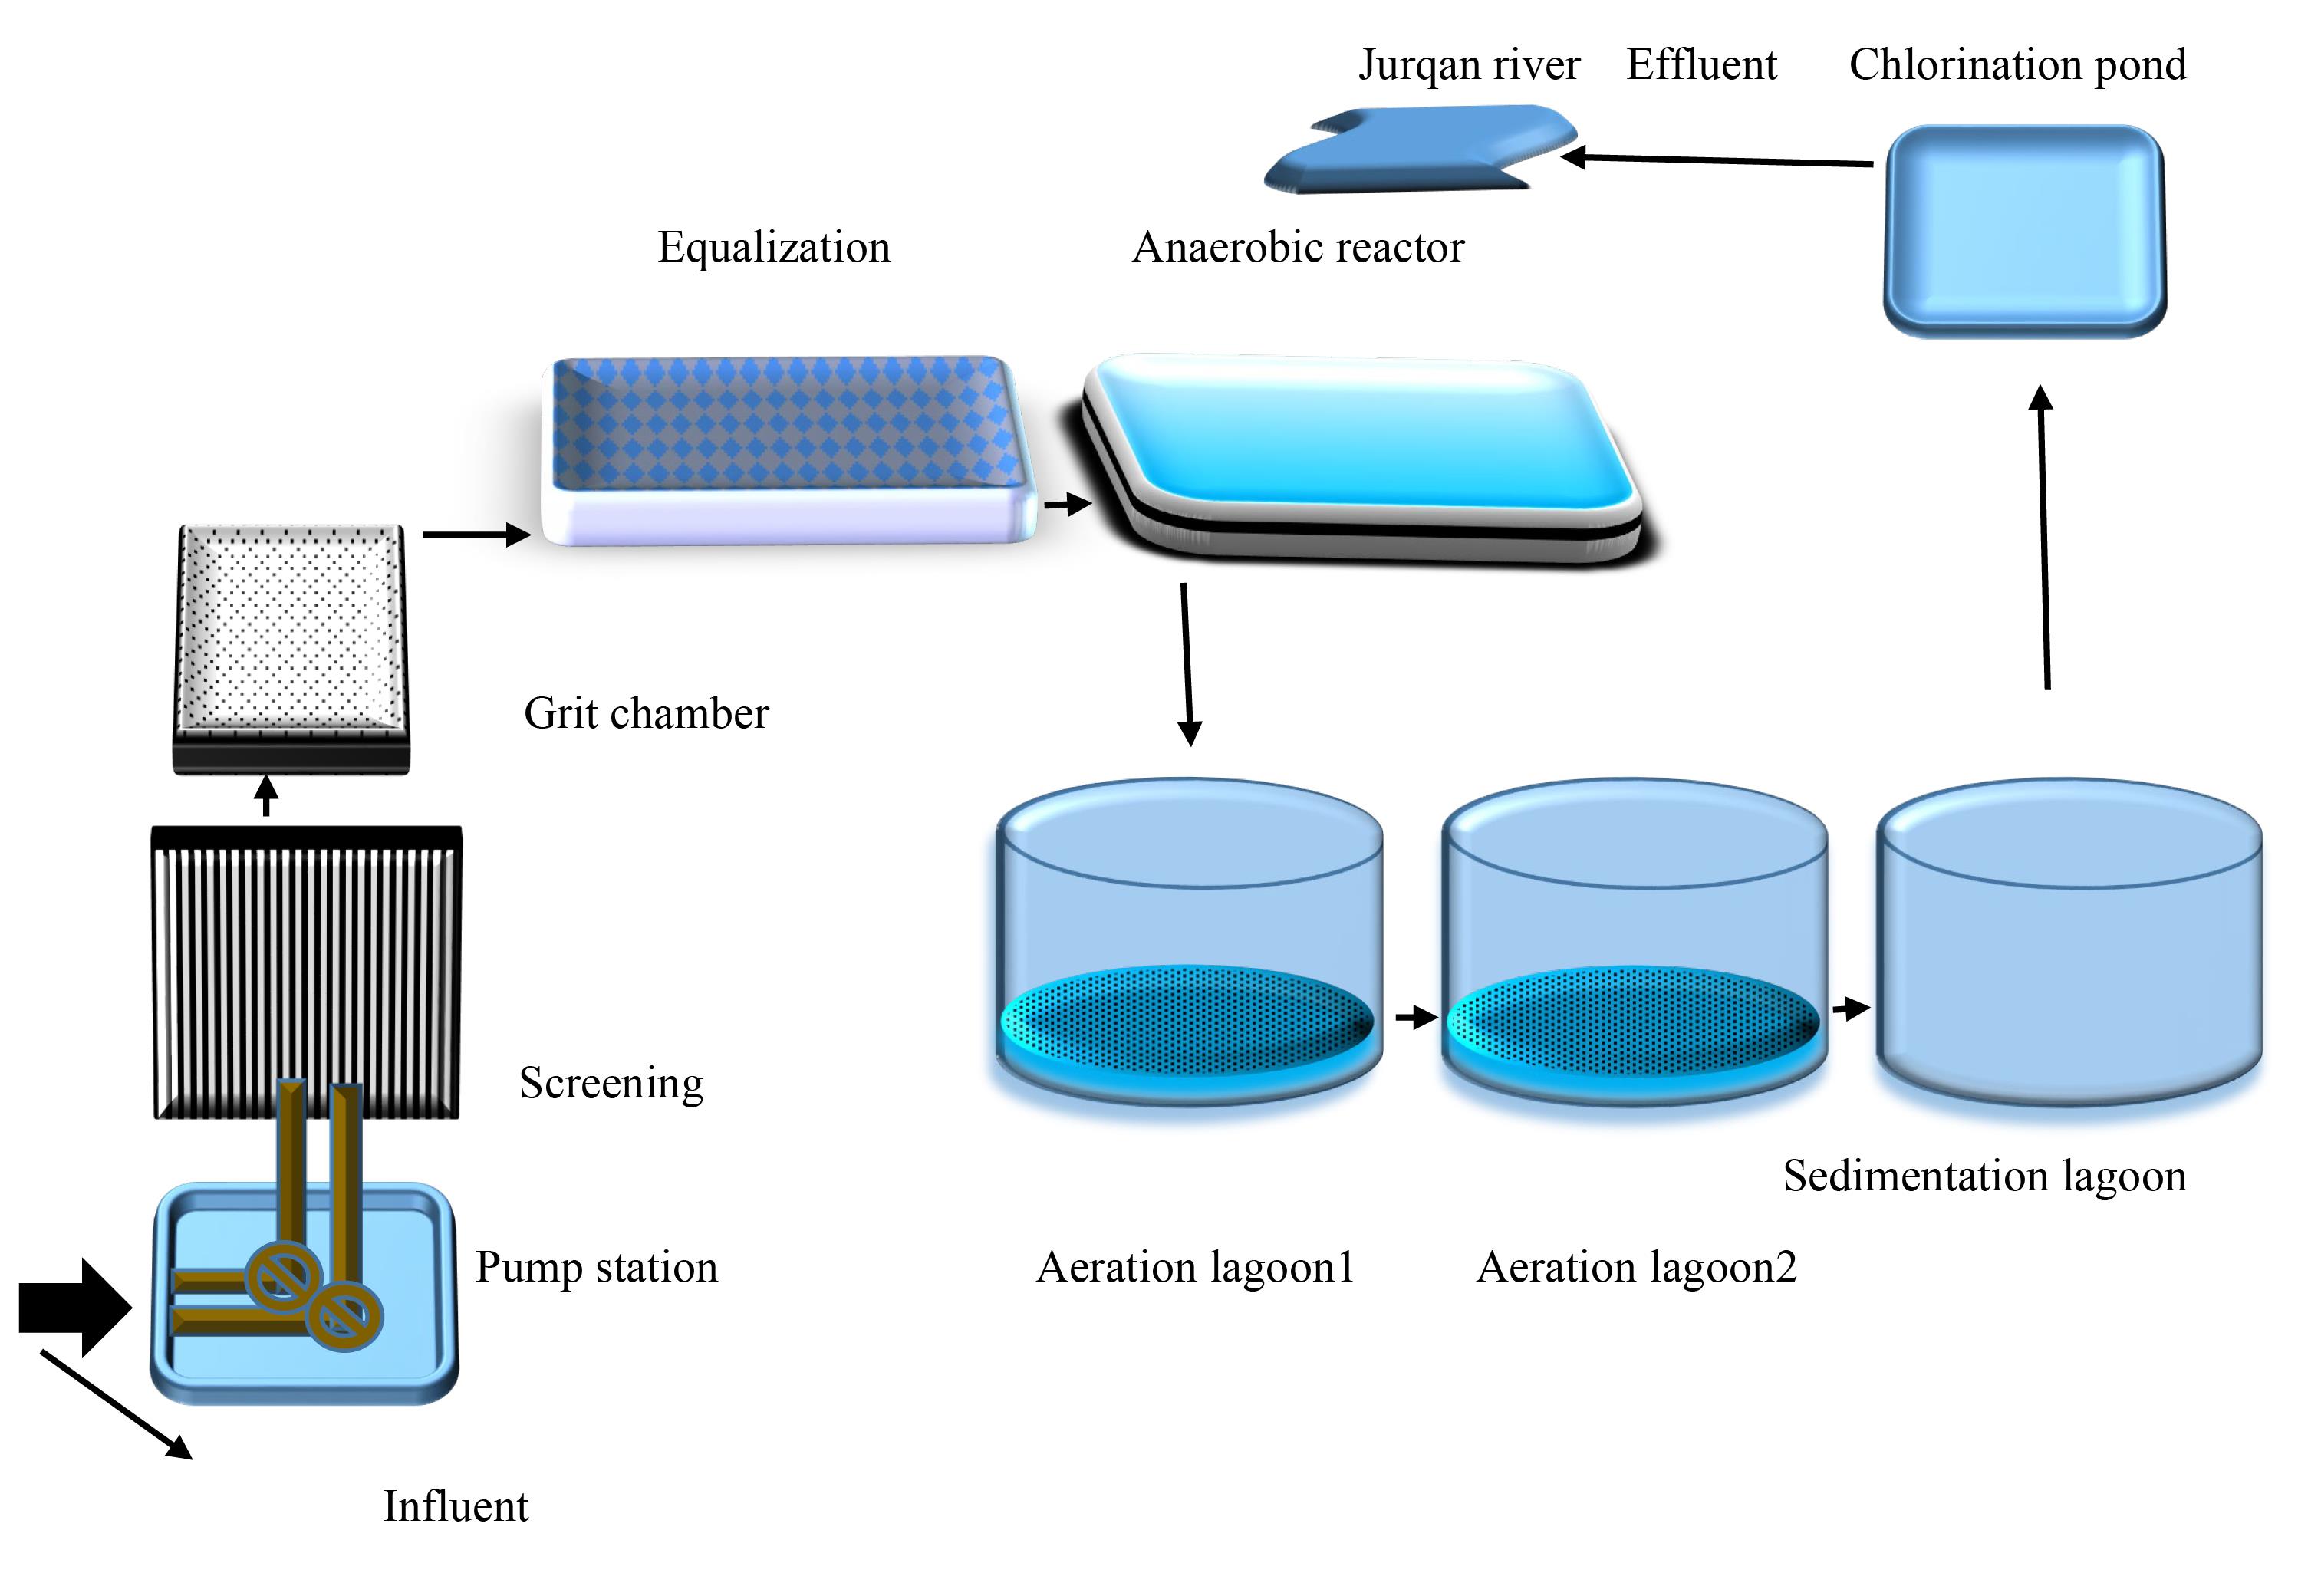
Fig. 1.
Schematic Illustration of the Main Processes of the WWTP
.
Schematic Illustration of the Main Processes of the WWTP
2.3. Sampling
This study was conducted in 2023. The required samples were randomly taken from the influent and effluent of the WWTP every two weeks. Microbial samples were stored in 300 mL glass containers containing thiosulfate. Additionally, 1000 mL glass containers were used for the analysis of chemical parameters and heavy metals. Before sampling, all the sampling containers were washed with dilute nitric acid and then washed three times with deionized water. The samples were stored in the cold box with ice packs at a temperature of less than 4 °C and transported to the laboratory within two hours (22).
2.4. Conducting the Tests
2.4.1. Assessment of Physico-chemical and Heavy Metals
To measure pH, electrical conductivity (EC), total dissolved solids (TDS), and dissolved oxygen (DO), a pH meter (desktop model of Radlab Company, Iran), a multimeter (model AD8000, Romania), and a DO meter (HACH model) were used, respectively. Total suspended solids (TSS), COD, BOD5, and cyanide were measured according to the method mentioned in sections A2540, A5220, B5210, and 4500 of the standard methods, respectively (23). Moreover, in order to measure heavy metal content of influent and effluent, the pH of the samples was first reduced to less than 2, and they were then sent to the reliable testing laboratory in Tehran University of Medical Sciences, where the samples were analyzed by an inductively coupled plasma (ICP) spectrometer.
2.4.2. Microbial Tests
In this study, the most probable number (MPN) method was used to measure total coliform (TC) and faecal coliform (FC). The MPN method includes three possible, confirmatory, and supplementary stages. TC and FC were measured using the three-tube method (22,24,25).
2.5. Statistical Analysis
In this study, SPSS version 16.0 was used to draw the graphs to analyze the changes in the mentioned parameters in the influent and effluent of the treatment plant. Pearson’s correlation coefficient was used to check the relationship between heavy metal parameters, physicochemical and microbial parameters, and their mutual effects, and a t-test was used to check the relationship between desired parameters.
3. Results and Discussion
3.1. Physico-chemical Parameters
3.1.1. BOD5 and COD
The mean values of the studied parameters and Iranian Environmental Protection Agency Standards are shown in Tables 1 and 2. As indicated in Table 1, the mean COD values of influent and effluent were 2187.5 and 220.7 mg/L, respectively. The high COD removal efficiency can be attributed to the function of the anaerobic reactor unit (26). In all the measured effluent samples, the mean COD value was higher than the allowed values for discharge into surface waters and absorption wells. As shown in Table 1, the above-average value of the parameter is not suitable for agricultural and irrigation purposes.
Table 1.
Comparison of Mean Values of Physicochemical Parameters with Iranian Standards
|
Parameter (unit)
|
Source
|
pH (-)
|
TSS (mg/L)
|
CN (mg/L)
|
DO (mg/L)
|
BOD5 (mg/L)
|
COD (mg/L)
|
| Mean |
Influent |
2187.50 |
967.50 |
2.41 |
20.77 |
1210 |
6.75 |
| Effluent |
220.69 |
113.37 |
5.18 |
2.01 |
94.50 |
8.71 |
| Iranian Environmental Protection Agency Standards |
Discharge to surface water |
100 |
50 |
2 |
0.5 |
60 |
6.5-8.5 |
| Discharge to absorption well |
100 |
50 |
- |
0.1 |
- |
5-9 |
| Agricultural and irrigation uses |
200 |
100 |
2 |
0.1 |
100 |
6-8.5 |
Table 2.
Mean Values of Physicochemical Parameters, Heavy Metals, and Microbial Parameters
|
Parameter
|
Group
|
Mean
|
Standard Deviation
|
P
Value
|
| BOD5 (mg/L) |
Influent |
967.50 |
70.68 |
0.000 |
| Effluent |
113.37 |
16.22 |
| COD (mg/L) |
Influent |
2187.50 |
58.05 |
0.000 |
| Effluent |
220.69 |
29.515 |
| TSS (mg/L) |
Influent |
1210.00 |
32.830 |
0.005 |
| Effluent |
94.50 |
22.19 |
| TDS (mg/L) |
Influent |
2165.52 |
15.72 |
0.395 |
| Effluent |
2370.45 |
25.39 |
| pH |
Influent |
6.75 |
0.45 |
0.000 |
| Effluent |
8.71 |
0.51 |
| EC (μS/cm) |
Influent |
3233.75 |
72.73 |
0.204 |
| Effluent |
3766.25 |
38.042 |
| DO (mg/L) |
Influent |
2.41 |
0.71 |
0.000 |
| Effluent |
5.18 |
1.23 |
| CN (mg/L) |
Influent |
20.76 |
2.46 |
0.000 |
| Effluent |
2.01 |
0.76 |
| FC (MPN/100 mL) |
Influent |
1.2 × 10⁹ |
3.2 × 10⁴ |
0.277 |
| Effluent |
3.5 × 10⁴ |
7.1 × 10² |
| TC (MPN/100 mL) |
Influent |
1.3 × 10¹⁰ |
2 × 10³ |
0.083 |
| Effluent |
1.7 × 10⁶ |
3.7 × 10² |
| V (ppb) |
Influent |
3.97 |
1.72 |
0.034 |
| Effluent |
< 0.06 |
0000 |
| Cd (ppb) |
Influent |
14.49 |
3.02 |
0.676 |
| Effluent |
11.78 |
2.43 |
| Co (ppb) |
Influent |
5.65 |
1.71 |
0.071 |
| Effluent |
2.36 |
0.66 |
| Cr (ppb) |
Influent |
142.41 |
46.19 |
0.033 |
| Effluent |
19.14 |
5.83 |
| Cu (ppb) |
Influent |
77.86 |
9.07 |
0.092 |
| Effluent |
14.59 |
1.99 |
| Hg (ppb) |
Influent |
< 0.351 |
0000 |
0.000 |
| Effluent |
< 0.351 |
0000 |
| Ni (ppb) |
Influent |
104.04 |
8.58 |
0.018 |
| Effluent |
73.09 |
5.90 |
| Pb (ppb) |
Influent |
73.85 |
2.75 |
0.000 |
| Effluent |
10.82 |
2.34 |
| Zn (ppb) |
Influent |
720.64 |
62.66 |
0.063 |
The high COD content (Table 2) indicates the presence of biologically degradable substances in the wastewater. Moreover, according to Table 3, it has been indicated that the amount of COD in the effluent has a direct relationship with the cyanide (CN) content of effluent, and considering the nature of cyanide, which is a very toxic substance, it can be concluded that the amount of COD is related to the toxicity of the environment (27,28). As can be seen, the BOD values (influent: 967.50 and effluent: 113.37) are usually lower than the corresponding COD values in the influent (2187.50) and effluent (220.69 mg/L), which is due to the presence of organic substances resistant to oxidation. In other words, BOD5 includes biodegradable substances, while COD also includes biodegradable substances and non-biodegradable substances (22,29).
Table 3.
Correlation Between Physico-chemical Parameters, Heavy Metals, and Microbial Effluents Using Pearson’s Correlation Coefficient
|
Correlations
|
BOD5
|
COD
|
TSS
|
TDS
|
pH
|
EC
|
DO
|
CN
|
FC
|
TC
|
V
|
Cd
|
Co
|
Cr
|
Cu
|
Hg
|
Ni
|
Pb
|
Zn
|
| BOD5 |
1 |
|
|
|
|
|
|
|
|
|
|
|
|
|
|
|
|
|
|
| COD |
0.988** |
1 |
|
|
|
|
|
|
|
|
|
|
|
|
|
|
|
|
|
| TSS |
0.404 |
0.520 |
1 |
|
|
|
|
|
|
|
|
|
|
|
|
|
|
|
|
| TDS |
0.300 |
0.341 |
0.314 |
1 |
|
|
|
|
|
|
|
|
|
|
|
|
|
|
|
| pH |
-0.372 |
-0.342 |
-0.251 |
0.007 |
1 |
|
|
|
|
|
|
|
|
|
|
|
|
|
|
| EC |
0.550 |
0.582 |
0.436 |
0.933** |
-0.175 |
1 |
|
|
|
|
|
|
|
|
|
|
|
|
|
| DO |
-0.170 |
-0.187 |
-0.532 |
0.138 |
0.172 |
-0.080 |
1 |
|
|
|
|
|
|
|
|
|
|
|
|
| CN |
0.751 * |
0.735* |
0.340 |
-0.123 |
-0.643 |
0.191 |
-0.314 |
1 |
|
|
|
|
|
|
|
|
|
|
|
| FC |
-0.221 |
-0.194 |
0.381 |
-0.577 |
-0.150 |
-0.511 |
-0.681 |
0.015 |
1 |
|
|
|
|
|
|
|
|
|
|
| TC |
-0.265 |
-0.224 |
0.419 |
-0.536 |
-0.110 |
-0.492 |
-0.642 |
-0.062 |
0.990** |
1 |
|
|
|
|
|
|
|
|
|
| V |
.c1 |
.c |
.c |
.c |
.c |
.c |
.c |
.c |
.c |
.c |
.c |
|
|
|
|
|
|
|
|
| C |
-0.379 |
-0.423 |
-0.475 |
-0.336 |
0.709* |
-0.463 |
0.025 |
-0.651 |
0.198 |
0.213 |
.c |
1 |
|
|
|
|
|
|
|
| Co |
0.457 |
0.532 |
0.670 |
0.556 |
0.189 |
0.530 |
-0.215 |
-0.049 |
0.084 |
0.113 |
.c |
0.006 |
1 |
|
|
|
|
|
|
| Cr |
0.710* |
0.685 |
0.073 |
0.144 |
0.164 |
0.214 |
0.138 |
0.188 |
-0.193 |
-0.206 |
.c |
0.282 |
0.574 |
1 |
|
|
|
|
|
| Cu |
-0.018 |
-0.041 |
-0.253 |
-0.323 |
0.496 |
-0.448 |
0.277 |
-0.383 |
0.168 |
0.181 |
.c |
0.753* |
0.295 |
0.663 |
1 |
|
|
|
|
| Hg |
.c |
.c |
.c |
.c |
.c |
.c |
.c |
.c |
.c |
.c |
.c |
.c |
.c |
.c |
.c |
.c |
|
|
|
| Ni |
-0.049 |
-0.100 |
-0.483 |
-0.232 |
0.656 |
-0.352 |
0.323 |
-0.454 |
-0.074 |
-0.069 |
.c |
0.867** |
0.156 |
0.642 |
0.921** |
.c |
1 |
|
|
| Pb |
-0.129 |
-0.147 |
-0.330 |
-0.345 |
0.250 |
-0.534 |
0.604 |
-0.320 |
0.038 |
0.053 |
.c |
0.432 |
0.092 |
0.452 |
0.852** |
.c |
0.694 |
1 |
|
| Zn |
0.621 |
0.657 |
0.590 |
0.686 |
-0.076 |
0.855** |
-0.472 |
0.252 |
-0.151 |
-0.134 |
.c |
-0.210 |
0.612 |
0.337 |
-0.293 |
.c |
-0.213 |
-0.609 |
1 |
1Cannot be computed because at least one of the variables is constant
*: Correlation is significant at the 0.05 level (2-tailed).
**: Correlation is significant at the 0.01 level (2-tailed).
In the study conducted by Tariq et al (22) as well as the present study, the amount of COD was higher than the national standard of Pakistan. Moreover, as expected, the amount of COD was higher than that of BOD in the above-mentioned study. In the study conducted by Godini et al (30), to assess the efficiency of the treatment plant of Bu-Ali Industrial Town, the mean COD value was 375 mg/L. Although the average value obtained in their study was similar to the current study and higher than the standards set by the Iranian Environmental Protection Organization, the removal efficiency of the parameter mentioned in this study was higher than in their study. The COD removal efficiency in their study was 77% (30), while in the present study, it was 89.91%. Emamjomeh et al conducted a study entitled comparing the quality of the WWTP effluent in Liya industrial zone (Qazvin) and compared the measured parameters with the Iranian Environmental Protection Agency standards. The results showed that it could be used for agricultural and irrigation purposes without any restriction, which is contrary to the results of the present study (31).
The measured BOD5 values were higher than the standards set by the Iranian Environmental Protection Organization for discharge into absorption wells and surface waters. According to Table 1, the mean influent and effluent BOD5 values were 967.5 and 113.4 mg/L, respectively, where the amount of BOD5 in the effluent was higher than the permissible limit determined by the Environmental Protection Organization of Iran for agricultural purposes. One of the harmful effects of high BOD5 values is the death of aquatic animals due to the reduction of oxygen in aquatic environments. In water environments with high BOD5 concentration, the amount of oxygen decreases, which leads to suffocation and death of aquatic animals (2,29). In other words, at high concentrations of BOD5, indicating the high amount of organic pollutants in aquatic environments, the amount of oxygen used to destroy organic compounds increases; therefore, the amount of oxygen available to aquatic animals decreases, which leads to their death (29,32). In addition, the amount of BOD5 was higher than the value determined by the WHO. Other harmful effects of the high concentration of BOD5 include the creation of an unpleasant smell due to the trapping of plants, which leads to the attraction of flies and mosquitoes. The attraction of these arthropods to water environments leads to disease in nearby residents, which can affect human health (22). Similar to the present study, in the study of Hina et al (33), the amount of BOD obtained from industrial drainage was higher than the standard set by WHO. Similar to the present study, in the study of Tariq et al (22), the BOD value was higher than the permissible limit of the WHO. In the study of Emamjomeh et al (31), the average of BOD in effluent, for agricultural and irrigation purposes, is allowed according to the standards of the Environmental Protection Organization of Iran. Moreover, the mean value obtained for BOD in their study was within the permissible limit of the WHO, unlike the present study.
3.1.2. Dissolved Oxygen
As shown in Table 1, the mean values of DO in the influent and effluent were 2.415 and 5.184 mg/L, respectively. Based on the results, the amount of DO is within the permissible limits set by the Iranian Environmental Protection Organization. The compounds present in the water environment, such as mineral compounds, absorb the available oxygen, which leads to a decrease in the DO value (2), however, the amount of DO is within the permissible range suggested by WHO.
Based on the results of Table 3, DO showed an inverse relationship with TSS and COD. The changes in water temperature and the activity of aerobic bacteria effective in destroying organic matter are the reasons for this phenomenon. As the weather gets warmer, the water temperature also increases, which leads to a decrease in DO and the activity of aerobic bacteria that are effective in destroying organic matter. Therefore, the organic matter is not destroyed and the concentration of COD and TSS in the effluent is high (34). Therefore, the concentration of DO is directly affected by the activity of aerobic bacteria. In addition to water temperature, water movement, and salinity also affect the amount of DO (29).
Aniyikaiye et al (29) investigated the physical and chemical properties of wastewater discharge from selected paint industries in Lagos, Nigeria. In their study, the DO concentration of three other industries was within the permissible range of WHO, and unlike this study, DO concentrations of two other industries were not within the standards set by the WHO. In the study of Olabode et al., (2), two treatment plants were examined, and the DO concentration of both industries was within the range approved by WHO.
3.1.3. Cyanide
According to the results presented in Table 1, the mean concentrations of cyanide in the influent and effluent were 20.762 and 2.015 mg/L, respectively. In other words, 90% of cyanide present in raw wastewater was removed by performing various treatment procedures. This can be due to the activity of microorganisms, the spontaneous hydrolysis of cyanide, and the production of formic acid. Therefore, cyanide is removed during purification and in the anaerobic reactor due to aerobic and anaerobic processes. In addition, sulfate-reducing bacteria in anaerobic conditions and nitrogenase are also able to decompose cyanide; however, due to the rarity of nitrogenase in microbial populations, a relatively small amount of cyanide is removed (35). In a study conducted by Avcioglu et al (36), it was found that K. pneumoniae can completely remove cyanide from electroplating industries. In addition, they proved in their study that K. oxytoca is also able to completely remove cyanide from electroplating wastewater.
Therefore, the reduction of cyanide during treatment can be due to the operation of the anaerobic reactor and the presence of some microorganisms in the treatment plant. According to the results shown in Table 1, the mean concentration of cyanide in the influent and effluent was higher than the standard set by the Iranian Environmental Protection Organization. In addition, the mean concentration of cyanide obtained for the effluent in this study was higher than the standards set by the EPA and the WHO. In a study conducted by Zareei et al (37), the production of cyanide in the effluent of different units of Shahin Steel Factory was investigated, and it was found that the concentration of cyanide in the coking unit and blast furnace exceeded the standards set by the Environmental Protection Organization of Iran, WHO, and EPA. However, unlike the above-mentioned study, the mean concentration of cyanide in the effluent was within the permissible limits of the Iranian Environmental Protection Organization, the WHO, and EPA. In addition, the cyanide removal efficiency was 89%, which is very close to the present study (90%). They also attributed one of the reasons for the reduction of cyanide to the activity of microorganisms. Contrary to our study, in the study conducted by Mousavi et al, the mean cyanide concentration measured was within the permissible limits set by the Iranian Environmental Protection Organization, EPA, and the WHO (38).
3.1.4. Electrical Conductivity
According to Table 2, the mean values of EC in influent and effluent were 3233.75 and 3766.25 µs/cm, respectively, which are higher than the standards set by the WHO. The high values of this parameter can be due to the activity of agricultural industries, battery manufacturing industries, and steel factories (3,39,40). As shown in Table 3, the amount of EC has a direct relationship with TDS. This shows that the amount of electric current can indicate a high amount of TDS (29). TDS and EC are significantly affected by the ambient temperature; therefore, in the summer season, the concentration of the mentioned parameters in water environments increases due to the increase in evaporation. In addition, the presence of pollutants such as Na+, Ca2+, Mg2+, K+, Cl-, and other metal salts in wastewater can lead to an increase in EC and TDS values (3).
Moreover, according to the results obtained from the Pearson’s correlation analysis (Table 3), the amount of EC is inversely proportional to the amount of DO. Therefore, the discharge of sewage or effluent with a high amount of EC into aquatic environments leads to a decrease in the level of DO, which leads to a decrease in the oxygen available to aquatic animals and ultimately to their death (29). Similar to the results of our study, it was also observed that EC had a direct relationship with TDS in the study of Aniyikaiye et al (29). Our results are in line with the results of Tariq et al., in which the amount of this parameter in most of the measured samples (more than 83%) was higher than the permissible standard set by WHO (22).
3.1.5. pH
As shown in Table 3, pH had an inverse relationship with BOD5 and COD based on Pearson’s correlation coefficient. This can be due to the involvement of organic compounds in two parameters (BOD5 and COD) and the effect of pH on the removal of organic compounds and heavy metals (29). In addition, the toxic effects of chemicals and some specific metals are greater at acidic pH than at neutral pH. In other words, with a decrease in pH, the amount of toxic substances and some heavy metals increases (41). This is evident in Table 3 by examining the relationship between the two parameters (pH and CN). According to the results presented in Table 3, pH had a strong inverse relationship with CN, which is toxic. Based on the results of the Pearson’s correlation coefficient shown in Table 3, it was also found that the relationship between pH and Zn was inverse, while in the above table, it was found that there was a direct relationship between pH and Cd and Ni. According to Table 1, the mean influent and effluent pH values were 6.75 and 8.71, respectively. The mean pH values obtained in the study and pH values suggested by the Iranian Environmental Protection Organization are presented in Table 1. Based on Table 1, although the effluent is not suitable for entering the surface water according to the established standards, it is within the limits set by this organization for discharge into the absorption well and for agricultural and irrigation purposes. In addition, the average effluent pH was not within the permissible range determined by the WHO. According to the results, the mean influent pH was in the acidic range. The acidity of wastewater can be caused by various factors, including urine entering the wastewater due to the presence of uric acid in it. In addition, the formation of carbonic acid due to the solubility of carbon dioxide is also involved in reducing pH. Carbonic acid is classified as a weak acid, but high amounts of this compound can lead to a decrease in pH (41).
The activity of the battery manufacturing industrial unit is among the effective factors in reducing pH. In addition to the presence of some heavy metals, the wastewater produced from this industry also contains lead and some mineral salts that lead to an increase in the TDS, EC, and salinity contents. Battery industry is associated with discharge of waste high in sulfuric acid, which can reduce the pH to 1.6 (3). When the pH is lower than the standard limits, metal cations are not absorbed and are released into the water environment. In addition, at low pH, the phenomenon of algal bloom occurs, in which water quality decreases, and it becomes impossible to use it (29,32). On the other hand, the activity of some industrial units, such as the paper and textile industries, leads to alkalinization of pH (5). Therefore, when the wastewaters from different industries are mixed together along the network and at the entrance of the treatment plant, the pH is somewhat close to the neutral range, similar to the present study. In a study conducted to investigate industrial effluent impacts on a municipal WWTP in Vaal, South Africa, the pH value exceeded the WHO standard range. The pH value in 3 industries was very high, indicative of highly alkaline wastewater (9.5), and in one industry, it was acidic (4.6), this difference can be attributed to the type and main activity of the industry and seasonal changes (3). Contrary to the results of the present study, in a study conducted by Hina et al, in 2021 under the title of “treatment of industrial wastewater with gamma radiation for removal of organic load in terms of biological and chemical oxygen demand”, the pH of wastewater in different industries ranged from 7.2 to 5.8, which was within the range set by the WHO in all industries. This difference is due to the fact that each industry was examined separately in their study, and the activity of the studied industry had a significant impact on determining the above-mentioned parameter (33). Contrary to our study, in a study conducted by Tariq et al, the pH range obtained was 6.02-8.18, which was within the allowable limits determined by the WHO (22).
3.1.6. Total Dissolved Solids
Based on the results shown in Table 1, the mean values of TDS in influent and effluent were 2165.524 mg/L and 2370.446 mg/L, respectively, which were higher than the range determined by WHO. When the concentration of TDS exceeds the permissible limit, excessive sedimentation occurs in water pipes, heaters, and household appliances, which limits the amount of water available to aquatic life, leading to damage to aquatic life, which may eventually result in their death due to dehydration (29). In addition, high concentration of TDS, similar to TSS, increases the risk of cancer in exposed people. The presence of soluble ions of resins, organic and inorganic solvents, and additives such as surfactants, as well as soluble ions of chemical reagents used for wastewater treatment in paint, can increase the concentration of this parameter (5). In the study conducted by Tariq et al, some samples, similar to the present study, exceeded the range established by the WHO and some other samples, contrary to the results of this study, were within the permissible range set by WHO (22). Unlike our study, in the study conducted by Hina et al, the minimum and maximum TDS values in different industries were 520 and 615 mg/L, respectively, which were within the range set by WHO (33).
3.1.7. Total Suspended Solids
In 37.5% of the samples, the measured TSS concentration was within the permissible range for entering surface water. According to the results of Table 2, the mean value of TSS in the inlet and effluent was 1210 and 94.5 mg/L, respectively. Based on the results shown in Table 2, the mean TSS concentration was suitable for agricultural uses. The high concentration of this parameter leads to the blackening of the soil surface; therefore, it is difficult for water to pass through the soil and the rate of water penetration in the soil decreases. Other effects of high concentration of TSS include the aesthetic effects of surface waters, the reduction of the photosynthesis rate due to the obstruction of the passage of light and the reduction of its intensity, the disturbance in the growth of primary producers, and the suffocation of fish due to the blockage of their airways, which can ultimately affect the food chain. In addition, destroying fish habitats, eggs, and larvae leads to the loss of abundance and biodiversity in aquatic environments (42). The value of the above-mentioned parameter obtained in the treatment plant was higher than the allowable limit of WHO. The high concentration of TSS can be attributed to the activities of industries such as agriculture, dyeing, and textiles, as well as the presence of a large amount of salt in the effluent (28,29,40). In addition, based on the results presented in Table 3, TSS has an inverse relationship with DO and pH. Similar to our results, in the study of Aniyikaiye et al (29), all of the studied industries were outside the scope of the WHO standard except for one of the industries. Similar to the results of our study, it was also observed that EC has a direct relationship with TDS in the study of Aniyikaiye et al (29). Our results are in line with the results of the study by Tariq et al, in which the amount of this parameter in most of the measured samples (more than 83%) was higher than the permissible standard set by WHO (22).
In the study conducted by Godini et al (30), the TSS concentration in effluent exceeded the standards set by the Environmental Protection Organization and WHO. The TSS removal efficiency in their study was 70%, while the TSS removal efficiency in the above study was 92.19%. This level of efficiency, like COD, can be attributed to temperature fluctuations, raw sewage, and problems related to exploitation. Therefore, according to the increase in efficiency, it can be seen that the operation of the refinery was probably improved, which led to an improvement in the performance of the refinery. Similar to our results, in the study of Emamjomeh et al (31), the mean TSS concentration of the effluent was not suitable for discharge into surface waters. It can be used for agricultural and irrigation purposes. Moreover, its amount was higher than the permissible limit of the WHO.
3.2. Heavy Metals
In this study, the concentrations of 9 heavy metals, including V, Cu, Cd, Cr, Co, Hg, Ni, Pb, and Zn, were measured in the influent and effluent, and the mean values are presented in Table 4. All metal concentrations were within the standard ranges of the Iranian Environmental Protection Organization for entering the wastewater into the environment. It was also found that among the studied metals, only Cd exceeded the standard limits set by the WHO and the EPA. As shown in Tables 2 and 4, the highest mean concentrations in influent were related to Zn, Cr, and Ni, respectively, while the highest concentrations in the effluent were related to Ni, Zn, and Cr, respectively. In other words, the removal efficiency of Ni by the treatment plant was lower than that of Zn and Cr. The removal efficiency of three metals, including Zn, Cr, and Ni, was determined to be 95%, 86%, and 29%, respectively. The high concentration of Zn can be attributed to the activity of the steel factory. Considering the heating and galvanizing of steel products with Zn coating as the main operation of the steel factory, the concentration of zinc in this factory is high (39). In addition, the presence of copper and zinc in brake pads and tires of cars (3), due to the activity of industrial units of car parts and rubber industries, is considered the main sources of copper and zinc. According to the conducted studies, industrial activities such as plating, cleaning and processing of metals, painting, and dyeing processes can increase the concentration of chromium in the wastewater entering the treatment plant and the outgoing effluent (43). The high removal efficiency of heavy metals in this study is probably due to the presence of some microorganisms. According to research, microorganisms can play a role in the decomposition and removal of toxic heavy metals. This is despite the fact that these microorganisms do not produce toxic byproducts during this process. Bacteria trap heavy metals by producing siderophores and remove their toxic effects by limiting their bioavailability. For example, three types of bacteria named Pseudomonas aeruginosa DSM 1117, Paenibacillus jamilae DSM 13815 T, Bacillus subtilis subsp. spizizenii DSM 15029 can remove lead and chromium. In addition, P. jamilae and P. aeruginosa can reduce the toxicity of Cd and Pb (44). According to a study conducted by Behnami et al (45), Pseudomonas and Bacillus subtilis are active among the dominant bacteria in sludge. Therefore, considering the management of the treatment plant with an activated sludge system and the presence of these bacteria as dominant bacteria in activated sludge, the removal of heavy metals can be attributed to these bacteria.
Table 4.
Comparison of Mean Concentration of Heavy Metals with Iranian Standards
|
Parameter (unit)
|
Source
|
V (mg/L)
|
Cd (mg/L)
|
Co (mg/L)
|
Cr (mg/L)
|
Cu (mg/L)
|
Hg (mg/L)
|
Ni (mg/L)
|
Pb (mg/L)
|
Zn (mg/L)
|
| Cr+6 |
Cr+3 |
| Mean |
Influent |
0.003 |
0.014 |
0.005 |
0.142 |
0.077 |
< 0.0003 |
0.104 |
0.073 |
720.0 |
| Effluent |
< 0.00006 |
0.011 |
0.002 |
0.019 |
0.014 |
< 0.0003 |
0.073 |
0.01 |
0.034 |
| Iranian Environmental Protection Agency standards |
|
0.1 |
0.1 |
1 |
2 |
0.5 |
1 |
nd |
2 |
1 |
2 |
|
|
0.1 |
0.1 |
1 |
2 |
1 |
1 |
nd |
2 |
1 |
2 |
|
|
0.1 |
0.05 |
0.05 |
2 |
1 |
0.2 |
nd |
2 |
1 |
2 |
Based on the Pearson’s correlation coefficient results shown in Table 3, BOD5 has a direct relationship with Cr and Zn. In addition, COD has a direct relationship with Cr and Zn, TSS with Co, TDS with Zn, pH with Cd, and EC with Zn. Similar to the present study, in the study conducted by Nadafi et al (46), the concentration of heavy metals (lead, copper, chromium and zinc) in the effluent was evaluated, and it was found that the concentrations of all these metals in the effluent were within the standard range set for discharge into absorbent wells and surface waters and agricultural and irrigation purposes. The average concentrations of lead, copper, chromium, and zinc were 0.13, 0.04, 0.03 and 0.88 mg/L, respectively, and the corresponding removal efficiencies were 59.08%, 62.24%, 62.57%, and 56.51% respectively. In the present study, the removal efficiency of lead, copper, chromium, and zinc was 85.34%, 81.26%, 86.56%, and 95.21%, respectively. This difference in efficiency can be explained by the fact that at higher pH, most of the heavy metals (including chromium) are removed from the solution by the sedimentation process and are absorbed in the lower sediment layers due to the production of hydroxide (3). In other words, the concentration of heavy metals is related to the pH level. The pH value obtained in the present study was higher than the pH obtained in the study conducted by Nadafi et al (46). Some heavy metals are soluble at acidic pH; in other words, with increasing pH, their dissolution rate decreases. Therefore, the amount of their effluent is reduced in proportion to the influent and the efficiency increases. As a result, their concentration will probably increase in the production sludge, or if they break down into non-toxic and less dangerous substances, they will be in the sewage or sludge. Moreover, the establishment of the anaerobic reactor unit in recent years can be one of the reasons for the increasing performance of the treatment plant in removing heavy metals. In a study conducted by Zeb BS et al, the removal of lead, nickel, and cadmium by the reactor was determined to be 2.7%, 79%, and 85% in real industrial wastewater (26). Unlike the present study, in the study of Iloms et al, metals such as nickel, zinc, copper, lead, and chromium were found in the industrial effluent, the concentration of which exceeded the legal limits. They attributed the concentration of metals such as lead, copper, nickel, and chromium to the activity of the battery industry. In addition, the high concentration of zinc and chromium was attributed to the activity of ferrous and non-ferrous metal industries. These industries lead to the release of copper, nickel, zinc, and chromium in their wastewater (26).
3.3. Total Coliform and Faecal Coliform
Based on the results of Table 5, the mean FC counts in influent and effluent of FC were 1.2 × 10⁹ and 3.5 × 10⁴, respectively, and the mean TC counts in influent and effluent were 1.3 × 10¹⁰ and 1.7 × 10⁶, respectively. Table 5 shows the mean FC and TC counts in the influent and effluent wastewater and their standard values according to the Iranian Environmental Protection Standard. According to Table 5, the amount of FC and TC exceeded the limits set by the Iranian Environmental Protection Organization for discharge into surface waters and absorption wells and agricultural and irrigation uses.
Table 5.
Comparison of Mean FC and TC Counts with Iranian Standards
|
Parameter
|
Source
|
FC (MPN/100 mL)
|
TC (MPN/100 mL)
|
| Mean |
Influent |
1.2 × 10⁹ |
1.3 × 10¹⁰ |
| Effluent |
3.5 × 10⁴ |
1.7 × 10⁶ |
| Iranian Environmental Protection Organization standards |
Discharge into surface water |
400 |
1000 |
| Discharge into absorption well |
400 |
1000 |
| Agricultural and irrigation uses |
400 |
1000 |
The standards/limits set by a few organizations (47-49) for discharge into surface waters and absorption wells and agricultural and irrigation uses were 400 (MPN/100 mL) for FC and 1000 (MPN/100 mL) for TC. According to these limits, the microbial contents of the effluent were higher than the WHO limits (Table 6). Similar to our study, in the study conducted by Nadafi et al (46) in the WWTP of Bu-Ali Industrial Town, the mean FC and TC counts of the effluent were 1.31 × 10³ and 1.98 × 10⁴ (MPN/100 mL), respectively, which exceeded the standards set by the Iranian Environmental Protection Organization for discharge into surface waters and absorption wells and agricultural and irrigation purposes.
Table 6.
Existing Limits for Physico-chemical, Microbial Parameters, and Heavy Metal Contents of the Effluent
|
Parameter (unit)
|
Iranian Environmental Protection Organization standards
|
WHO
|
EPA
|
|
Agricultural and Irrigation Uses
|
Discharge to Absorption Well
|
Discharge to Surface Water
|
| BOD5 (mg/L) |
100 |
50 |
50 |
80 |
- |
| COD (mg/L) |
200 |
100 |
100 |
- |
|
| TSS (mg/L) |
100 |
- |
60 |
60 |
- |
| TDS (mg/L) |
- |
- |
- |
1500 |
- |
| DO (mg/L) |
2 |
- |
2 |
1 |
- |
| EC (µS/cm) |
- |
- |
- |
900 |
- |
| pH (-) |
6-8.5 |
5-9 |
6.5-8.5 |
6.5-8.5 |
6-9 |
| CN (mg/L) |
0.1 |
0.1 |
0.5 |
0.07 |
0.2 |
| Cd (mg/L) |
0.05 |
0.1 |
0.1 |
0.003 |
0.005 |
| Cu (mg/L) |
0.2 |
1 |
1 |
1 |
0.25 |
| Cr+6 (mg/L) |
1 |
1 |
0.5 |
0.05 |
0.05 |
| Cr+3 (mg/L) |
2 |
2 |
2 |
- |
0.1 |
| Co (mg/L) |
0.05 |
1 |
1 |
0.1 |
|
| Ni (mg/L) |
2 |
2 |
2 |
0.015 |
0.2 |
| Pb (mg/L) |
1 |
1 |
1 |
0.05 |
- |
| Zn (mg/L) |
2 |
2 |
2 |
3 |
1 |
| Hg (mg/L) |
nd |
nd |
nd |
0.001 |
0.05 |
| V (mg/L) |
0.1 |
0.1 |
0.1 |
|
|
| FC (MPN/100 mL) |
400 |
400 |
400 |
400 |
- |
| TC (MPN/100 mL) |
1000 |
1000 |
1000 |
1000 |
- |
4. Conclusion
The results of this study showed that the amount of COD in the effluent was higher than the environmental protection standards of Iran. The BOD5 value was higher than the environmental protection standards of Iran and the WHO. DO in the effluent of the treatment plant was in accordance with the environmental protection standard of Iran, WHO, and EPA. The concentration of cyanide was higher than the environmental protection standard of Iran, WHO, and EPA. The pH of the effluent was not suitable for discharge into the surface water, while it was within the range of Iran’s environmental standards for discharging into absorption wells and agricultural and irrigation purposes. This parameter exceeded the WHO limits. The TDS value was also higher than the WHO limits. In addition, according to the standard values, the concentration of TSS was not suitable for entering surface water; however, it was suitable for agricultural and irrigation purposes. TSS concentration also exceeded the WHO limits. However, the concentrations of all the studied heavy metals, except for Cd, were within the Iranian Environmental Protection Standards, WHO limits, and EPA standards. FC and TC values were higher than the environmental protection standards of Iran and WHO limits. Considering the results and effects of high concentrations of some parameters on the environment and human health, the entry of wastewater with the current quality can have harmful effects on aquatic life, soil quality, and agricultural products. Therefore, continuous monitoring of wastewater by the relevant agency seems to be mandatory. In addition, due to the high microbial load of the effluent, improving and upgrading the sewage treatment unit and performing pre-treatment procedures by the industrial units themselves will play a significant role in increasing the quality of the effluent discharged to the WWTP or to the environment or receiving waters.
Acknowledgments
The present project was supported by the Deputy of Research and Technology of Hamadan University of Medical Sciences (Grant Number: 1401120210360). The authors appreciate the Organization of Small Industries and Industrial Towns of Iran for the collaboration and providing the data.
Competing Interests
The authors of the present study declare that there is no conflict of interests.
Ethical Approval
This research was approved by the Ethics Committee of Hamadan University of Medical Sciences (IR.UMSHA.REC.1401.921).
Funding
This study was financially supported by Hamadan University of Medical Sciences (Grant No. 1401120210360).
References
- Gulzar F, Mahmood Q, Bhatti ZA, Zeb BS, Shaheen S, Hayat T. Industrial wastewater treatment in internal circulation bioreactor followed by wetlands containing emergent plants and algae. World J Microbiol Biotechnol 2018; 34(8):119. doi: 10.1007/s11274-018-2496-6 [Crossref] [ Google Scholar]
- Olabode GS, Olorundare OF, Somerset VS. Physicochemical properties of wastewater effluent from two selected wastewater treatment plants (Cape Town) for water quality improvement. Int J Environ Sci Technol 2020; 17(12):4745-58. doi: 10.1007/s13762-020-02788-9 [Crossref] [ Google Scholar]
- Iloms E, Ololade OO, Ogola HJO, Selvarajan R. Investigating industrial effluent impact on municipal wastewater treatment plant in Vaal, South Africa. Int J Environ Res Public Health 2020; 17(3):1096. doi: 10.3390/ijerph17031096 [Crossref] [ Google Scholar]
- Kaur N, Brraich OS. Impact of industrial effluents on physico-chemical parameters of water and fatty acid profile of fish, Labeo rohita (Hamilton), collected from the Ramsar sites of Punjab, India. Environ Sci Pollut Res Int 2022; 29(8):11534-52. doi: 10.1007/s11356-021-16429-2 [Crossref] [ Google Scholar]
- Islam JB, Sarkar M, Lutfor Rahman AK, Shahin Ahmed K. Quantitative assessment of toxicity in the Shitalakkhya River, Bangladesh. Egypt J Aquat Res 2015; 41(1):25-30. doi: 10.1016/j.ejar.2015.02.002 [Crossref] [ Google Scholar]
- Damptey L, Jaato BN, Ribeiro CS, Varagnolo S, Power NP, Selvaraj V. Surface functionalized MXenes for wastewater treatment-a comprehensive review. Glob Chall 2022; 6(6):2100120. doi: 10.1002/gch2.202100120 [Crossref] [ Google Scholar]
- Devda V, Chaudhary K, Varjani S, Pathak B, Patel AK, Singhania RR. Recovery of resources from industrial wastewater employing electrochemical technologies: status, advancements and perspectives. Bioengineered 2021; 12(1):4697-718. doi: 10.1080/21655979.2021.1946631 [Crossref] [ Google Scholar]
- Khan S, Ahmad I, Shah MT, Rehman S, Khaliq A. Use of constructed wetland for the removal of heavy metals from industrial wastewater. J Environ Manage 2009; 90(11):3451-7. doi: 10.1016/j.jenvman.2009.05.026 [Crossref] [ Google Scholar]
- Mian HR, Haydar S, Hussain G, Gul-e-Hina Gul-e-Hina. Optimization of sequencing batch reactor for wastewater treatment using chemically enhanced primary treatment as a pre-treatment. Water SA 2018; 44(3):399-405. doi: 10.4314/wsa.v44i3.07 [Crossref] [ Google Scholar]
- Behnami A, Croué JP, Aghayani E, Pourakbar M. A catalytic ozonation process using MgO/persulfate for degradation of cyanide in industrial wastewater: mechanistic interpretation, kinetics and by-products. RSC Adv 2021; 11(58):36965-77. doi: 10.1039/d1ra07789a [Crossref] [ Google Scholar]
- Zafarzadeh A, Rezaei E, Aghahossini F, Charmsaz S. Evaluating the performance of wastewater treatment in nitrogen compound removal, phosphorus and chemical oxygen demand. J Health Syst Res 2012;8(7):1197-205. [Persian].
- Jackson R, Logue BA. A review of rapid and field-portable analytical techniques for the diagnosis of cyanide exposure. Anal Chim Acta 2017; 960:18-39. doi: 10.1016/j.aca.2016.12.039 [Crossref] [ Google Scholar]
- MacFarlane ID, Logan CM, Elseroad HJ. Evolving regulatory and risk assessment approaches for cyanide in wastewater discharges, receiving waters, and groundwater. Proc Water Environ Fed 1997; 111(3):119. [ Google Scholar]
- Vieira A, Galinha CF, Oehmen A, Carvalho G. The link between nitrous oxide emissions, microbial community profile and function from three full-scale WWTPs. Sci Total Environ 2019; 651(Pt 2):2460-72. doi: 10.1016/j.scitotenv.2018.10.132 [Crossref] [ Google Scholar]
- Chen WH, Yang JH, Yuan CS, Yang YH. Toward better understanding and feasibility of controlling greenhouse gas emissions from treatment of industrial wastewater with activated sludge. Environ Sci Pollut Res Int 2016; 23(20):20449-61. doi: 10.1007/s11356-016-7183-2 [Crossref] [ Google Scholar]
- Meiramkulova K, Devrishov D, Zhumagulov M, Arystanova S, Karagoishin Z, Marzanova S. Performance of an integrated membrane process with electrochemical pre-treatment on poultry slaughterhouse wastewater purification. Membranes (Basel) 2020; 10(10):256. doi: 10.3390/membranes10100256 [Crossref] [ Google Scholar]
- Khanitchaidecha W, Nakaruk A, Koshy P, Futaba K. Comparison of simultaneous nitrification and denitrification for three different reactors. Biomed Res Int 2015; 2015:901508. doi: 10.1155/2015/901508 [Crossref] [ Google Scholar]
- Lucena F, Duran AE, Morón A, Calderón E, Campos C, Gantzer C. Reduction of bacterial indicators and bacteriophages infecting faecal bacteria in primary and secondary wastewater treatments. J Appl Microbiol 2004; 97(5):1069-76. doi: 10.1111/j.1365-2672.2004.02397.x [Crossref] [ Google Scholar]
- Thangavelu L, Veeraragavan GR. A survey on nanotechnology-based bioremediation of wastewater. Bioinorg Chem Appl 2022; 2022:5063177. doi: 10.1155/2022/5063177 [Crossref] [ Google Scholar]
- Domagała K, Bell J, Yüzbasi NS, Sinnet B, Kata D, Graule T. Virus removal from drinking water using modified activated carbon fibers. RSC Adv 2021; 11(50):31547-56. doi: 10.1039/d1ra06373a [Crossref] [ Google Scholar]
- Hosseinzadeh M, Nabi Bidhendi G, Torabian A, Mehrdadi N. Evaluation of membrane bioreactor for advanced treatment of industrial wastewater and reverse osmosis pretreatment. J Environ Health Sci Eng 2013; 11(1):34. doi: 10.1186/2052-336x-11-34 [Crossref] [ Google Scholar]
- Tariq M, Anayat A, Waseem M, Rasool MH, Zahoor MA, Ali S. Physicochemical and bacteriological characterization of industrial wastewater being discharged to surface water bodies: significant threat to environmental pollution and human health. J Chem 2020; 2020(1):9067436. doi: 10.1155/2020/9067436 [Crossref] [ Google Scholar]
- Baird R, Rice E, Eaton A. Standard methods for the examination of water and wastewaters. Water Environment Federation, American Public Health Association, American Water Works Association; 2017.
- Bakaj A, Lika M, Rapi A. Estimation of Microbiological Quality of Sea Water on the Coast of Vlore, Albania. 2017. Available from: https://www.researchgate.net/publication/368247651_Estimation_of_Microbiological_Quality_of_Sea_Water_on_the_Coast_of_Vlore_Albania.
- Mok JS, Lee TS, Kim PH, Lee HJ, Ha KS, Shim KB. Bacteriological quality evaluation of seawater and oysters from the Hansan-Geojeman area in Korea, 2011-2013: impact of inland pollution sources. Springerplus 2016; 5(1):1412. doi: 10.1186/s40064-016-3049-9 [Crossref] [ Google Scholar]
- Zeb BS, Mahmood Q, Jadoon S, Pervez A, Irshad M, Bilal M. Combined industrial wastewater treatment in anaerobic bioreactor posttreated in constructed wetland. Biomed Res Int 2013; 2013:957853. doi: 10.1155/2013/957853 [Crossref] [ Google Scholar]
- Shokunbi O, Omenka RO. Physicochemical parameters and purification of pulp effluent (black liquor). J Trop Pharm Chem 2022; 6(1):49-54. doi: 10.30872/j.trop.pharm.chem.v6i1.225 [Crossref] [ Google Scholar]
- Berihun D, Solomon Y. Assessment of the physicochemical and heavy metal concentration from effluents of paint industry in Addis Ababa, Ethiopia. Int J Waste Resour 2017; 7(4):306. doi: 10.4172/2252-5211.1000306 [Crossref] [ Google Scholar]
- Aniyikaiye TE, Oluseyi T, Odiyo JO, Edokpayi JN. Physico-chemical analysis of wastewater discharge from selected paint industries in Lagos, Nigeria. Int J Environ Res Public Health 2019; 16(7):1235. doi: 10.3390/ijerph16071235 [Crossref] [ Google Scholar]
- Godini K, Azarian G, Kimiaei A, Dragoi EN, Curteanu S. Modeling of a real industrial wastewater treatment plant based on aerated lagoon using a neuro-evolutive technique. Process Saf Environ Prot 2021; 148:114-24. doi: 10.1016/j.psep.2020.09.057 [Crossref] [ Google Scholar]
- Emamjomeh MM, Mozaffari Siboni A, Seyed Mousavi SE, Tari K. Comparing quality of the wastewater treatment plant effluent in Lia industrial zone (Qazvin) with Iranian environmental protection standards (2015). J Qazvin Univ Med Sci 2016;20(5):60-6. [Persian].
- Asghar MZ, Arshad A, Hong L, Riaz M, Arfan M. Comparative assessment of physico-chemical parameters of waste water effluents from different industries in Lahore, Pakistan. Proc Int Acad Ecol Environ Sci 2018; 8(2):99-112. [ Google Scholar]
- Hina H, Nafees M, Ahmad T. Treatment of industrial wastewater with gamma irradiation for removal of organic load in terms of biological and chemical oxygen demand. Heliyon 2021; 7(2):e05972. doi: 10.1016/j.heliyon.2021.e05972 [Crossref] [ Google Scholar]
- Bachi OE, Halilat MT, Bissati S, Al-Ansari N, Saggai S, Kouadri S. Wastewater treatment performance of aerated lagoons, activated sludge and constructed wetlands under an arid Algerian climate. Sustainability 2022; 14(24):16503. doi: 10.3390/su142416503 [Crossref] [ Google Scholar]
- Luque-Almagro VM, Cabello P, Sáez LP, Olaya-Abril A, Moreno-Vivián C, Roldán MD. Exploring anaerobic environments for cyanide and cyano-derivatives microbial degradation. Appl Microbiol Biotechnol 2018; 102(3):1067-74. doi: 10.1007/s00253-017-8678-6 [Crossref] [ Google Scholar]
- Avcioglu NH, Bilkay IS. Cyanide removal in electroplating, metal plating and gold mining industries’ wastewaters by using Klebsiella pneumoniae and Klebsiella oxytoca species. Eur J Biol 2019; 78(1):5-10. [ Google Scholar]
- Zareei A. Decreasing the pollution load of Acid Black 29 in textile wastewater by electrocoagulation with the use of aluminium and steel electrodes. The Application of Chemistry in Environment 2015; 22(6):37-43. [ Google Scholar]
- Mousavi SR, Balali-Mood M, Riahi-Zanjani B, Sadeghi M. Determination of cyanide and nitrate concentrations in drinking, irrigation, and wastewaters. J Res Med Sci 2013; 18(1):65-9. [ Google Scholar]
- Zinabu E, Kelderman P, van der Kwast J, Irvine K. Impacts and policy implications of metals effluent discharge into rivers within industrial zones: a sub-Saharan perspective from Ethiopia. Environ Manage 2018; 61(4):700-15. doi: 10.1007/s00267-017-0970-9 [Crossref] [ Google Scholar]
- Terefe Gemeda F, Diriba Guta D, Senbeta Wakjira F, Gebresenbet G. Physicochemical characterization of effluents from industries in Sabata town of Ethiopia. Heliyon 2020; 6(8):e04624. doi: 10.1016/j.heliyon.2020.e04624 [Crossref] [ Google Scholar]
- Chidozie K, Nwakanma C. Assessment of Saclux Paint industrial effluents on Nkoho River in Abia state, Nigeria. J Ecosyst Ecogr 2017; 7(2):240. doi: 10.4172/2157-7625.1000240 [Crossref] [ Google Scholar]
- Appiah-Brempong M, Essandoh HM, Asiedu NY, Dadzie SK, Momade FW. Artisanal tannery wastewater: quantity and characteristics. Heliyon 2022; 8(1):e08680. doi: 10.1016/j.heliyon.2021.e08680 [Crossref] [ Google Scholar]
- Shrestha AM, Neupane S, Bisht G. An assessment of physicochemical parameters of selected industrial effluents in Nepal. J Chem 2017; 2017(1):3659561. doi: 10.1155/2017/3659561 [Crossref] [ Google Scholar]
- Gaur VK, Sharma P, Gaur P, Varjani S, Ngo HH, Guo W. Sustainable mitigation of heavy metals from effluents: toxicity and fate with recent technological advancements. Bioengineered 2021; 12(1):7297-313. doi: 10.1080/21655979.2021.1978616 [Crossref] [ Google Scholar]
- Behnami A, Shaker Khatibi M, Derafshi S, Fatehifar E, Chavoshbashi M, Akbari Z. Performance evaluation of Tabriz petrochemical wastewater treatment plant. Modares Civil Engineering Journal 2017;17(2):55-65. [Persian].
- Naddafi K, Vaezi F, Farzadkia M, Kimiaei Talab AR. Study of aerated lagoons in treating industrial effluent from industrial Bou-Ali zone in Hamedan. J Water Wastewater 2005;16(2):47-53. [Persian].
- World Health Organization (WHO). Guidelines for the safe use of wastewater, excreta and greywater. In: Wastewater Use in Agriculture. Vol 2. Geneva: WHO; 2006.
- USEPA. Guidelines for Water Reuse 600/R 12/618. Washington, DC: USEPA; 2012.
- Iran’s Department of Environment. Wastewater effluent standard provided in Iran. Iran’s Department of Environment; 2016.