Avicenna J Environ Health Eng. 12(1):58-68.
doi: 10.34172/ajehe.5486
Systematic Review
Evaluation of Polycyclic Aromatic Hydrocarbons in Vegetable Oils: A Review and Meta-analysis and Health Risk Assessment
Shima Khanverdiluo Conceptualization, Formal analysis, Investigation, Methodology, Project administration, 1
Elaheh Talebi-Ghane Conceptualization, Investigation, Methodology, Writing – review & editing, 2
Sahar Amirsadeghi Conceptualization, Investigation, Methodology, Writing – original draft, Writing – review & editing, 3
Ali Heshmati Conceptualization, Investigation, Methodology, Writing – review & editing, 3
Fereshteh Mehri Conceptualization, Formal analysis, Investigation, Methodology, Project administration, Writing – original draft, 3, * 
Author information:
1Food and Drug Administration, Hamadan University of Medical Sciences, Hamadan, Iran
2Modeling of Noncommunicable Diseases Research Center, Hamadan University of Medical Sciences, Hamadan, Iran
3Nutrition Health Research Center, Institute of Health Sciences and Technologies, Avicenna Health Research Institute, Hamadan University of Medical Sciences, Hamadan, Iran
Abstract
Individuals’ daily diets include a wide variety of vegetable oils worldwide. Our study assessed the concentrations of polycyclic aromatic hydrocarbons (PAHs) in several vegetable oils (corn, sunflower, olive, soybean, sesame, and canola). A search of major international databases was conducted to find published studies on PAHs in vegetable oils between May 12, 1986, and June 20, 2021. Based on the results of 13 research articles, out of 713 retrieved studies, the most common PAHs found in corn, sunflower, olive, sesame, soybean, and canola were fluoranthene (33.6 µg/kg), dibenz[a,h]anthracene (7.13 µg/kg), phenanthrene (22.45 µg/kg), benz[a]anthracene (16.49 µg/kg), naphthalene (3.92 µg/kg), and pyrene (8.01 µg/kg), respectively. However, the lowest concentrations of PAHs in the mentioned oils were associated with benzo[b]fluoranthene (11 µg/kg), benzo[b]fluoranthene (0.28 µg/kg), dibenz[a,h]anthracene (0.13 µg/kg), benzo [b]fluoranthene (0.22 µg/kg), acenaphthene (0.05 µg/kg), and benzo(g,h,i)perylene (0.150 µg/kg), respectively. According to the continent type, PAHs in vegetable oils were detected in countries of the European Region, Eastern Mediterranean Region, and Western Pacific Region. Based on the findings, there is a country-to-country variation in the carcinogenic and mutagenic risks of PAHs. As a result, vegetable oils pose no threat to human health.
Keywords: Vegetable oils, PAHs, Health risk assessment, Systematic review, Meta-analysis
Copyright and License Information
© 2025 The Author(s); Published by Hamadan University of Medical Sciences.
This is an open-access article distributed under the terms of the Creative Commons Attribution License (
https://creativecommons.org/licenses/by/4.0), which permits unrestricted use, distribution, and reproduction in any medium, provided the original work is properly cited.
Please cite this article as follows: Khanverdiluo S, Talebi-Ghane E, Amirsadeghi S, Heshmati A, MehriF. Evaluation of polycyclic aromatic hydrocarbons in vegetable oils: a review and meta-analysis and health risk assessment. Avicenna J Environ Health Eng. 2025;12(1):58-68. doi:10.34172/ajehe.5486
1. Introduction
Polycyclic aromatic hydrocarbons (PAHs) have long been recognized as a large collection of organic compounds containing hundreds of lipophilic organic compounds varying in the number of aromatic rings (1). Food matrices may contain PAHs due to incomplete combustion from both environmental contamination and certain processes during food manufacturing that are lipophilic and have an affinity for long importunity and transportation (2). A variety of preparation methods contribute to PAH production in food (3). The fat content of the food, fuel type (coal tar, coke, or asphalt), processing temperature, distance, and duration of cooking affect PAH levels in food (4). Several anthropogenic emissions play a role in PAH contamination in the environment, such as those produced by vehicles, heat and power plants, tobacco smoke, urbanization, and industrialization (5,6). Overall, 16 PAHs were classified as potent carcinogens to humans and annals (7). Environmental compartment and ecotoxicological characteristics affect the fate and transfer of PAHs (8). PAHs are categorized into two groups based on the number of aromatic rings; those having 2–3 rings are light PAHs, while the ones with 4–6 rings are called heavy PAHs, which are more stable and toxic (9). The European Union reported a level of 2 µg/kg for benzo[a]pyrene in oils and fats safe for health.
Many factors can influence the toxic effects of PAHs, including concentration, duration, and exposure route (10). As highlighted by animal studies, animals exposed to PAHs, especially benzo[a]pyrene, have shown multiple toxicological effects, including hematotoxicity, immunotoxicity, reproductive toxicity, developmental toxicity, and mutagenic and carcinogenic adverse effects (11). Another study indicated that exposure to PAHs and their derivatives may increase the risk of cancer in the skin and lungs (2). Many studies have approved the health risks associated with PAHs for animals and humans (12,13). Food is the primary source of human exposure to PAHs, and vegetable oils and fats are among the most significant sources. These oils are generally composed of triacylglycerol, a complex of minerals and natural chemicals (14-16). The tendency to use oils has increased due to the presence of fit-sterols, essential fatty acids, tocopherol, and low cholesterol (17). Previous studies reported that cereals and vegetable oils or fats not only had the highest dietary PAH load but also the concentration of heavy PAHs in this group was higher than that in fruits, sugar, some vegetables, and meat (18). Considering that oils are edible in the diet and both oils and fats are susceptible to PAH contamination due to the lipophilic nature of PAHs, many studies evaluated the level of PAHs in these types of foods (19-20). A meta-analytic review of food safety risk perception has recently conducted to condense the results obtained from preliminary investigations (21). Hence, using a systematic review and meta-analysis, this study seeks to evaluate the concentrations of PAHs in various vegetable oils (corn, sunflower, olive, soybean, sesame, and canola). Further, the risk of cancer or mutation of PAHs through the consumption of vegetable oils will be assessed in adults.
2. Methods and Materials
2.1. Search Scheme
Documents relating to the concentration of PAHs in various vegetable oils (corn, sunflower, olive, soybean, sesame, and canola) were assessed based on the Cochrane protocol (Fig. 1). First, several databases, such as ScienceDirect, Web of Science, Scopus, PubMed, and Google Scholar, were searched for published original studies from 1986 to 2021. Keywords used for this purpose included “polycyclic aromatic hydrocarbons” OR “PAHs” AND “food” OR “sunflower” OR “peanut” OR “corn” OR “olive” OR “soybean” OR “sesame” OR (contaminants, residual, and concentration). Moreover, the reference lists of similar studies provided additional articles. Then, the articles were screened for eligibility by screening their titles, abstracts, and full texts.
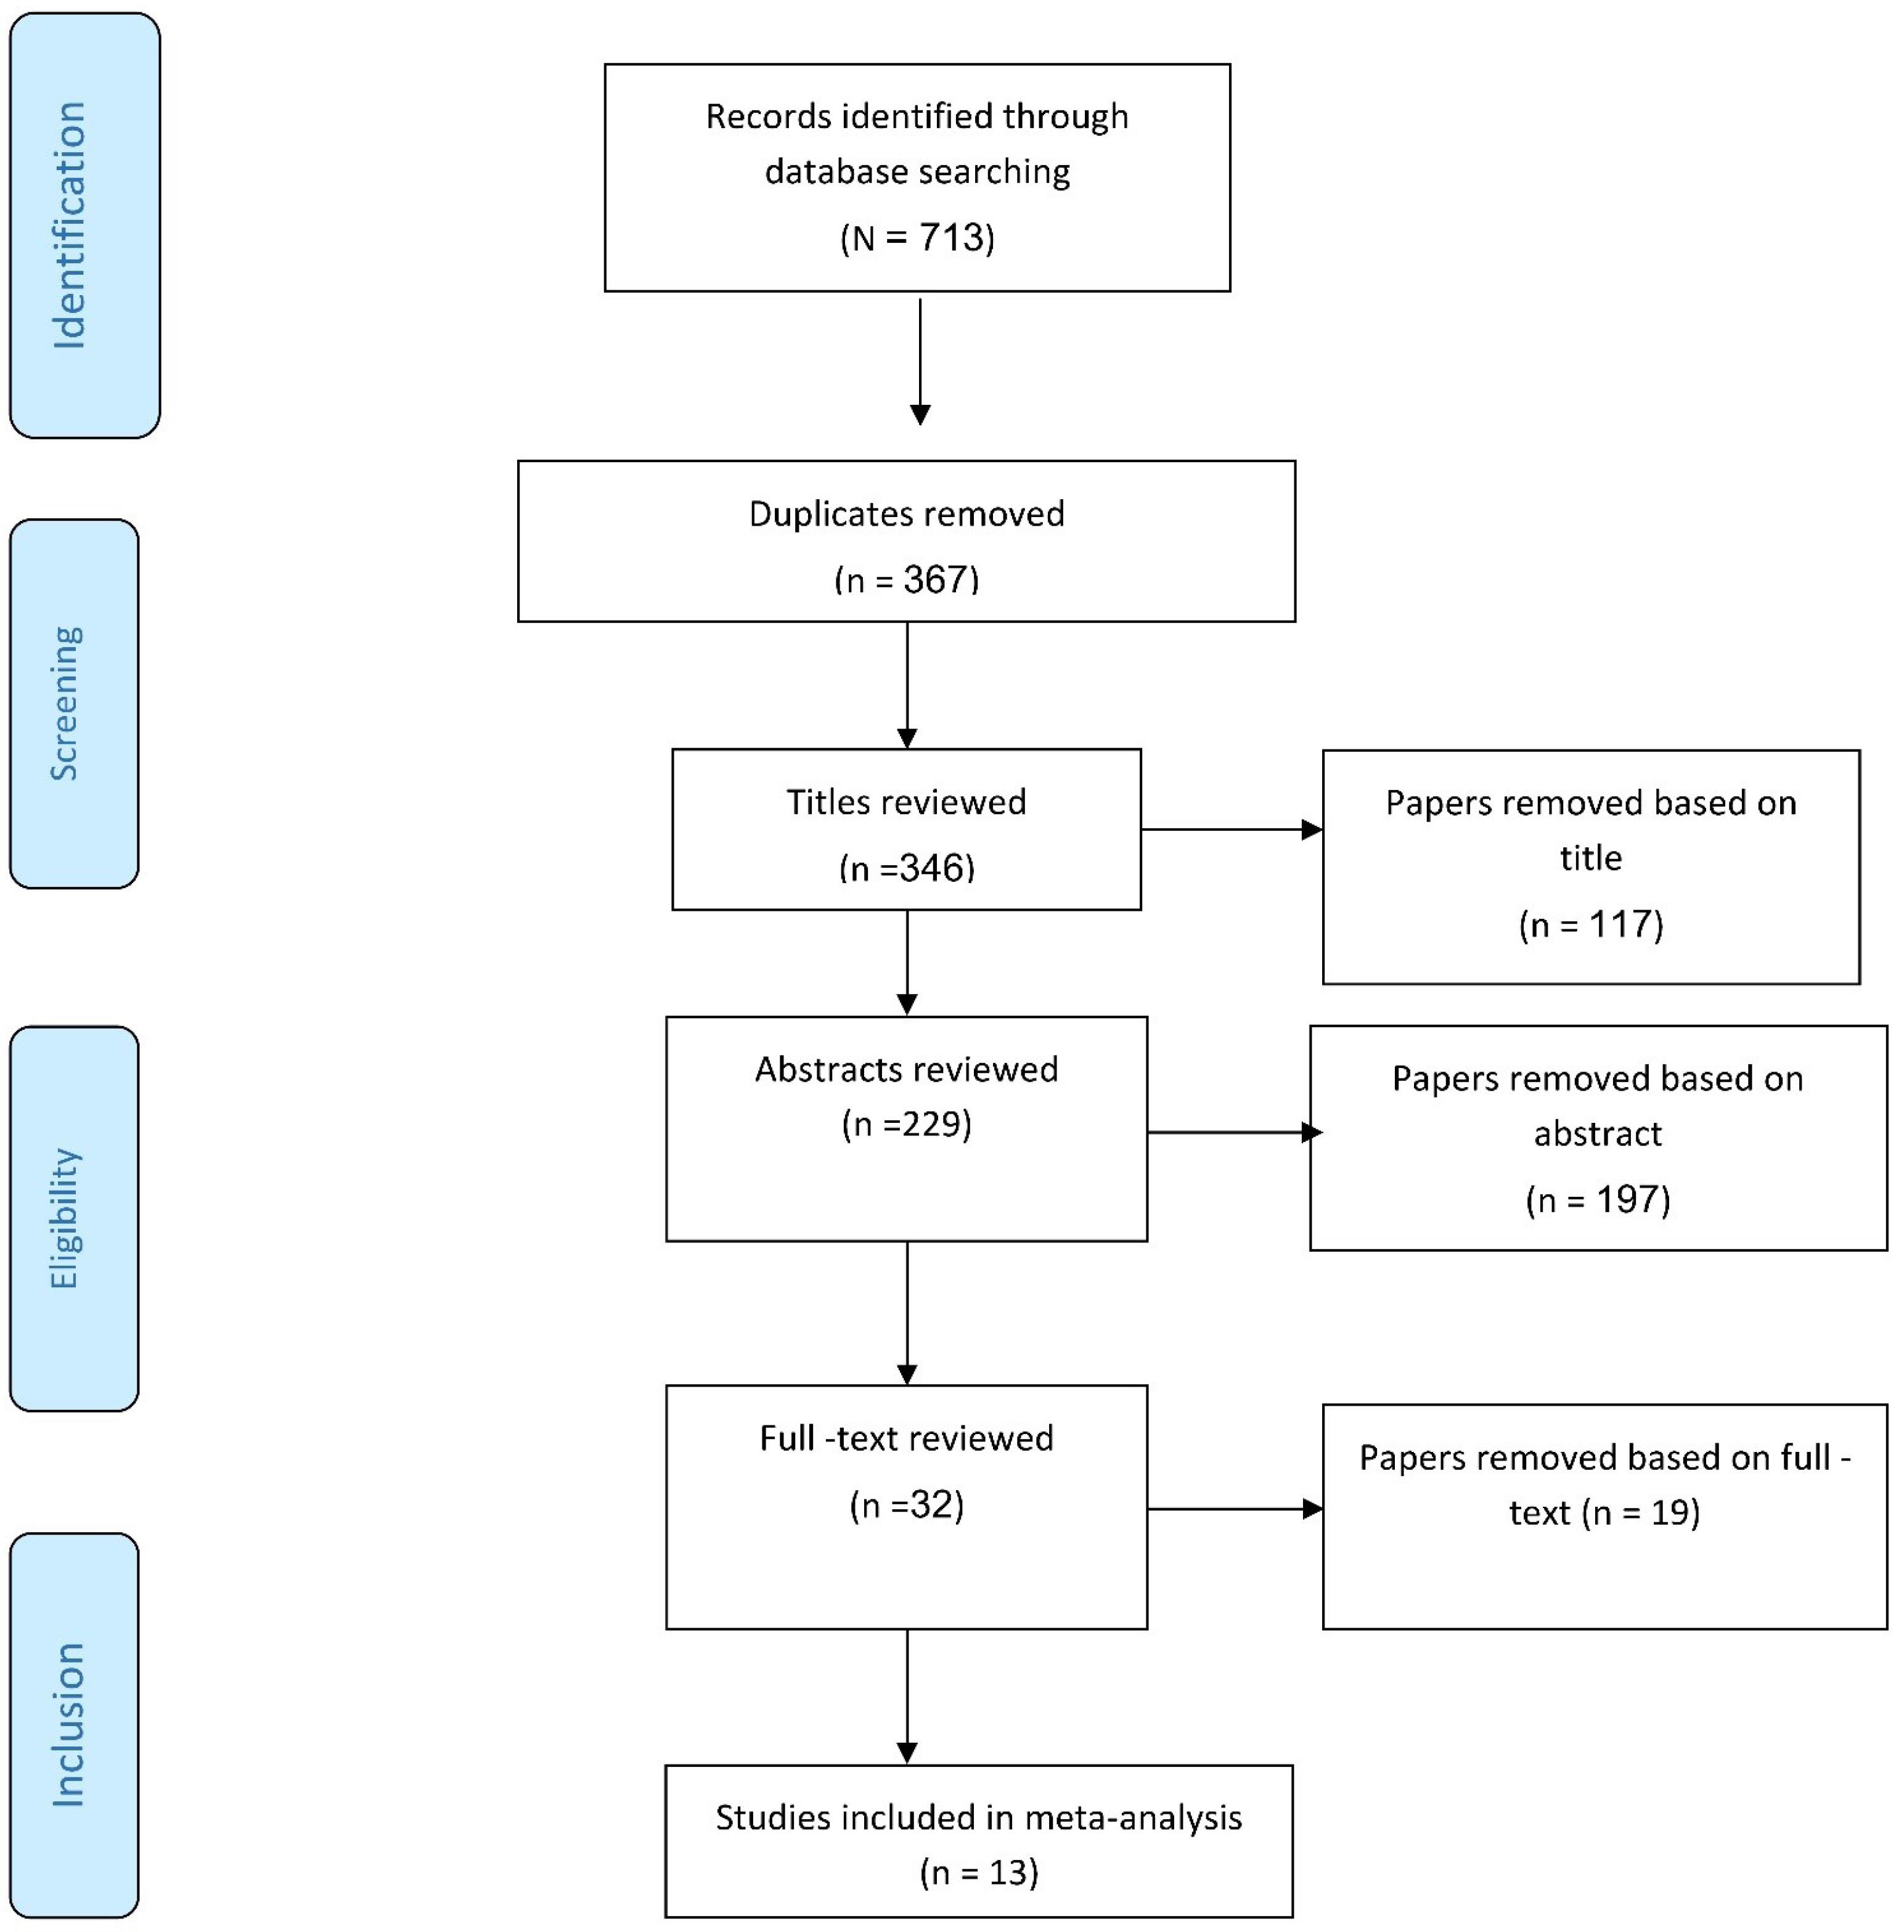
Fig. 1.
Flow diagram of study selection process
.
Flow diagram of study selection process
2.2. Inclusion and Exclusion Criteria
Two authors (S. K. and F. M.) independently selected the articles based on our research criteria after screening the databases using the same keywords and procedures. To select the articles that met the inclusion criteria, each author had to review all papers (titles, abstracts, and full texts). The inclusion criteria were (a) papers written in the English language, (b) original studies, (c) cross-sectional studies, and (d) readings reporting the mean and standard deviation. On the other hand, the exclusion criteria included papers published as (a) book studies, (b) workshops, and (c) clinical trials and reviews. Furthermore, articles without raw data, mean values, or standard deviations were excluded from the investigation (22-24). To keep the units consistent, all toxic metal measurement units were changed to ng/g (including μg/L, ppb, mg/L, and μg/kg).
2.3. Meta-analysis and Statistical Analysis
A mean ± standard error (SE) was used to evaluate the concentrations of PAHs in vegetable oils (corn, sunflower, olive, soybean, sesame, and canola). Equation (1) was utilized to calculate the SE of PAH levels (25):
where SD and N represent the standard deviation and the sample size, respectively. Based on the PAH type and country, the study was divided into subgroups. The I2 and Q tests were employed to measure heterogeneity. The Cochran Q tests and I2 statistics indicate statistical significance and a large degree of heterogeneity, respectively. Moreover, meta-regression was applied to determine whether the year of the study might contribute to heterogeneity. Finally, Stata software (version 14; Stata Corporation, USA) was used to survey the records, and the value of 0.05 was considered statistically significant.
2.4. Risk Assessment
The carcinogenic risks of 7 PAH compounds were determined using the BaP equivalent dose of mutagenic PAHs (BaPEQ) (26).
BaPEQ is dependent on TEQBaP or MEQBaP planned by the amount of mutagenic equivalent factor (MEF) or toxicity equivalent factor (TEF) × each PAH concentration. Eqs. (2) and (3) can be utilized to estimate the TEQBaP or MEQBaP and BaPEQ:
where Ci is the amount of each PAH with its associated TEFi or MEFi value, whereas the values of TEFi for BaA, BaP, BbFlu, BkFlu, Chr, DahA, and IndP are 0.1, 1, 0.1, 0.01, 0.001, 1, and 0.1, respectively (27). MEFi values for BaA, BaP, BbFlu, BkFlu, Chr, DahA, and IndP are 0.082, 1, 0.25, 0.11, 0.017, 0.290, and 0.310, respectively (28). The BaP equivalent dose can be calculated using Eq. (4):
(4)
where IR and EF (350 days/year) denote the ingestion rate of the vegetable oil (kg/day) and the exposure frequency, respectively. In addition, ED (adults = 30 years) and BW (adults = 70 kg) indicate the exposure duration and body weight EPA, respectively (29), and ATn (EF × ED) represents (average life time (that for adults equals to 10950 days)) (25,30). The risk of cancer or mutagenicity is shown by:
The SFBaP × BaP is the equivalent dose of a mixture of PAHs (5), and SFBaP shows the oral carcinogenic slope factor for benzo[a]pyrene (7.3 per mg/kg/day). Further, the USEPA command implies that CR values greater than 10-4 indicate risk. Furthermore, CR values between 10-6 and 10-4 are acceptable, and CR values less than 10-6 denote safety (30).
3. Results and Discussion
3.1. Structure and Process of the Systematic Review
The PRISMA flow chart of the process of the present study is depicted in Fig. 1. A total of 713 articles were obtained from international databases. Initially, 367 articles were excluded because of duplication. Only 346 articles were considered relevant based on their titles. Thus, 117 articles were eliminated from the research because of their unrelated titles. The abstracts of 229 articles were analyzed, and 197 articles were excluded from the analysis. In addition, 19 articles were excluded from the review due to inadequate full texts. Eventually, a total of 13 full texts were reviewed in this study.
3.2. Amounts of Various Polycyclic Aromatic Hydrocarbons in Vegetable Oils
The results revealed a significant heterogeneity based on Cochran’s Q test and I2 statistics (Q = 3289.3, df. = 480, P< 0.001, and I2 = 85.4%). Tables 1 and 2 present subgroup results based on PAH types and countries in order to reduce heterogeneity. According to the data in Table 1, a variety of PAH subgroups can be detected in vegetable oils. Among the vegetable oils (Table 1), corn, sunflower, olive, sesame, soybean, and canola had the highest concentrations of PAHs (33.6 µg/kg, 7.13 µg/kg, 22.45 µg/kg, 16.49 µg/kg, 3.92 µg/kg, and 8.01 µg/kg, which belonged to fluoranthene, dibenz[a,h]anthracene, phenanthrene, benzo[a]anthracene, naphthalene, and pyrene, respectively). On the other hand, the lowest PAH concentration was found in the corn, sunflower, olive, sesame, soybean, and canola (0.11 µg/kg, 0.28 µg/kg, 0.13 µg/kg, 0.22 µg/kg, 0.05 µg/kg, and 0.150 µg/kg for benzo[b]fluoranthene, benzo[b]fluoranthene, dibenz[a,h]anthracene, benzo[b]fluoranthene, acenaphthene, and benzo(g,h,i)perylene, respectively). Our findings showed that levels of PAHs in vegetable oils varied significantly (P < 0.05). The results are consistent with those of previous studies. According to Dost and İdeli, the mean concentrations of fluorine, phenanthrene, anthracene, fluoranthene, and pyrene identified in corn samples in Turkey were 16.84 µg/kg, 7.4 µg/kg, 10.84 µg/kg, 76.08 µg/kg, and 12.04 µg/kg, while they were 7.44 µg/kg, 4.96 µg/kg, 3.36 µg/kg, not detection (ND), and 1.44 µg/kg, respectively, in sunflower samples in Turkey (31). Ma et al found that the mean concentrations of acenaphthene, anthracene, chrysene, fluoranthene, fluorine, naphthalene, and pyrene in Korean corns were 2.47 µg/kg, 2.46 µg/kg, 1.72 µg/kg, 2.32 µg/kg, 1.96 µg/kg, 1.42 µg/kg, and 1.36 µg/kg, respectively. However, in Korean olive samples, they were 2.54 µg/kg, 2.31 µg/kg, 0.12 µg/kg, 0.34 µg/kg, 1.62 µg/kg, 1.58 µg/kg, and 2.03 µg/kg, respectively (32). Based on the results of Teixeira et al, the amounts of naphthalene, acenaphthene, fluorine, phenanthrene, anthracene, fluoranthene, and pyrene were 3.19 µg/kg, 0.10 µg/kg, 0.71 µg/kg, 1.92 µg/kg, 0.12 µg/kg, 0.93 µg/kg, and 1.29 µg/kg in the sunflower oil samples, whereas the corresponding amounts were 4.90 µg/kg, 1.57 µg/kg, 1.63 µg/kg, 7.07 µg/kg, 0.29 µg/kg, 2.15 µg/kg, and 1.63 µg/kg in olive oil samples, respectively (33). The high levels of PAHs in our study were significantly different from those found in previous studies, which can be attributed to the physical-chemical properties of PAHs in food preparation, drying processes of oil seeds, solvent extraction, packaging, soil burn, the residue of mineral oils, and raw material of vegetable oils (34-36). Drying the plant before oiling with direct combustion gases can affect the high amounts of PAHs in the final product (34). Olatunji concluded that poor combustion of organic material has important role in the PAHs levels of the final product. At high temperatures, organic compounds can produce dangerous free radicals that combine to form stable polycyclic aromatic compounds (pyrosynthesis) (1). According to Veyrand et al, the heating process used in oil preparation is also an important factor that can affect the concentration of PAHs in edible oils, which is dependent on several factors, such as the distance and source of heating, and the type of fuel (37). In this regard, in a study performed in India, it was revealed that 80% of the edible oil samples were contaminated with PAHs, and the average level of contamination tended to be between 40.2 µg/kg and 624 µg/kg. High levels of PAH may be attributed to the unrefined form of crude oils used during the preparation step based on kiln drying assisted by combustion gas and direct air heating (38). Additionally, Srivastava et al reported that the consumption of repeatedly heated oils was associated with high mean levels of 16 PAHs, which ranged from 30.91 µg/kg in the coconut oil after single heating to 66.25 µg/kg after repeated heating (39). The oil refinement process, however, has been mentioned by some researchers as an important factor in the observed differences in this study. Moret et al demonstrated that PAH levels were low in refined edible oils in the range of a few µg/kg versus the crude oil contaminated by environmental factors (40). Based on the findings obtained by Teixeira et al, the contamination levels of 15 PAHs in various commercially refined oils (e.g., virgin olive, sunflower, and soybean) were generally lower than those of the crude oil (33). Hossain and Salehuddin examined the effect of refining on the decrease of low molecular weight PAHs and found that different oils contained low amounts of these compounds (2). Several other studies have confirmed the impact of packaging on the production of PAHs in foods. Chen et al concluded that PAHs can diffuse into packaging prepared using low-density polyethylene and polytetrafluorethylene; thus, they believed packaging is a potent method for reducing the presence of PAH in rapeseed oil (41).
Table 1.
Meta-analysis of the Concentration of Polycyclic Aromatic Hydrocarbons in Vegetable Oils Based on Type of Oil
|
Metal
|
Meat
|
Number of Studies
|
ES (95% CI)
|
Heterogeneity
|
|
Weight (%)
|
Statistics
|
df
|
P
Value
|
I2 (%)
|
| Acenaphthene |
Corn |
1 |
2.470 (2.270, 2.670) |
11.19 |
- |
- |
- |
- |
| Sunflower |
2 |
1.546 (-1.302, 4.435) |
22.63 |
3998.44 |
1 |
< 0.001 |
100.0 |
| Olive |
3 |
2.670 (1.589, 3.751) |
32.82 |
140.77 |
2 |
< 0.001 |
98.6 |
| Seasame |
1 |
0.450 (0.372, 0.528) |
11.31 |
- |
- |
- |
- |
| Soybean |
1 |
0.055 (0.050, 0.060) |
11.33 |
- |
- |
- |
- |
| Canola |
1 |
6.170 (5.751, 6.589) |
10.72 |
- |
- |
- |
- |
| Total |
9 |
2.224 (1.633, 2.816) |
100.0 |
1.2e + 05 |
8 |
< 0.001 |
100.0 |
| Acenaphthylene |
Sunflower |
2 |
2.450 (2.080, 2.820) |
35.87 |
0.0 |
1 |
1.00 |
0.0 |
| Olive |
5 |
8.252 (5.849, 10.655) |
64.13 |
233.91 |
4 |
< 0.001 |
98.3 |
| Total |
7 |
5.104 (3.643, 6.565) |
100.0 |
234.67 |
6 |
< 0.001 |
97.4 |
| Anthracene |
Corn |
1 |
6.277 (-0.021, 12.574) |
11.69 |
553.81 |
2 |
< 0.001 |
99.6 |
| Sunflower |
2 |
2.157 (1.051, 3.263) |
33.23 |
705.02 |
5 |
< 0.001 |
99.3 |
| Olive |
1 |
2.711 (1.287, 4.134) |
27.67 |
564 |
4 |
< 0.001 |
99.3 |
| Seasame |
1 |
0.650 (0.537, 0.763) |
9.23 |
- |
- |
- |
- |
| Soybean |
1 |
0.116 (0.109, 0.123) |
9.97 |
- |
- |
- |
- |
| Canola |
1 |
4.810 (4.626, 4.994) |
8.21 |
- |
- |
- |
- |
| Total |
9 |
2.022 (1.897, 2.148) |
100.0 |
6671.97 |
16 |
< 0.001 |
99.8 |
| Benzo[a]anthracene |
Corn |
3 |
5.672 (1.030, 10.313) |
13.08 |
3855.04 |
2 |
< 0.001 |
99.9 |
| Sunflower |
5 |
0.693 (0.312, 1.074) |
31.70 |
667.15 |
4 |
< 0.001 |
99.4 |
| Olive |
6 |
1.506 (1.115, 1.897) |
29.61 |
617.72 |
5 |
< 0.001 |
99.2 |
| Seasame |
2 |
16.499 (-13.802, 46.80) |
6.54 |
376.34 |
1 |
< 0.001 |
99.7 |
| Soybean |
2 |
0.377 (-0.035, 0.788) |
12.98 |
62.46 |
1 |
< 0.001 |
98.4 |
| Canola |
1 |
1.020 (0.812, 1.228) |
6.09 |
16397.73 |
- |
- |
- |
| Total |
19 |
1.426 (1.232, 1.620) |
100.0 |
6671.97 |
18 |
< 0.001 |
99.9 |
| Benzo[a]pyrene |
Corn |
2 |
0.379 (0.164, 0.595) |
13.97 |
33.93 |
1 |
< 0.001 |
97.1 |
| Sunflower |
4 |
0.695 (0.131, 1.259) |
21.16 |
19.64 |
3 |
< 0.001 |
98.4 |
| Olive |
7 |
0.716 (0.522, 0.909) |
34.70 |
445.17 |
6 |
< 0.001 |
98.7 |
| Seasame |
3 |
1.290 (0.606, 1.974) |
13.45 |
69.50 |
2 |
< 0.001 |
97.1 |
| Soybean |
2 |
0.413 (-0.169, 0.995) |
14.49 |
6529.76 |
1 |
< 0.001 |
100.0 |
| Canola |
2 |
3.626 (2.695, 4.557) |
2.24 |
2.56 |
1 |
0.110 |
60.9 |
| Total |
20 |
0.677 (0.605, 0.749) |
100.0 |
10759.79 |
19 |
< 0.001 |
99.8 |
| Benzo[b]fluoranthene |
Corn |
1 |
0.110 (0.086, 0.134) |
14.39 |
- |
- |
- |
- |
| Sunflower |
2 |
0.285 (0.063, 0.508) |
28.41 |
86.89 |
1 |
< 0.001 |
98.8 |
| Olive |
2 |
0.207 (-0.082, 0.497) |
29.05 |
1120.49 |
1 |
< 0.001 |
99.9 |
| Soybean |
1 |
0.226 (0.216, 0.236) |
14.54 |
- |
- |
- |
- |
| Canola |
1 |
0.300 (0.245, 0.355) |
13.62 |
- |
- |
- |
- |
| Total |
7 |
0.230 (0.151, 0.309) |
100.0 |
1322.12 |
6 |
< 0.001 |
99.5 |
| Benzo[b]fluorene |
Corn |
2 |
10.082 (9.882, 10.282) |
12.33 |
0.07 |
1 |
0.787 |
0.0 |
| Sunflower |
3 |
0.973 (0.363, 1.583) |
32.12 |
71.24 |
2 |
< 0.001 |
97.2 |
| Olive |
5 |
1.386 (0.776, 1.997) |
44.66 |
371.14 |
4 |
< 0.001 |
98.9 |
| Seasame |
1 |
0.770 (0.637, 0.903) |
10.89 |
- |
- |
- |
- |
| Total |
11 |
2.309 (1.866, 2.752) |
100.0 |
11412.64 |
10 |
< 0.001 |
99.9 |
| Benzo[e]pyrene |
Corn |
4 |
7.291 (5.244, 9.338) |
43.92 |
4885.18 |
3 |
< 0.001 |
99.9 |
| Sunflower |
2 |
0.793 (0.156, 1.430) |
28.01 |
89.06 |
1 |
< 0.001 |
98.9 |
| Olive |
1 |
0.240 (0.181, 0.299) |
14.03 |
- |
- |
- |
- |
| Canola |
1 |
0.340 (0.277, 0.403) |
14.03 |
- |
- |
- |
- |
| Total |
8 |
3.221 (2.565, 3.877) |
100.0 |
5101.67 |
7 |
< 0.001 |
99.9 |
| Benzo(g,h,i)perylene |
Corn |
2 |
3.136 (-2.578, 8.850) |
9.61 |
36.17 |
1 |
< 0.001 |
97.2 |
| Sunflower |
4 |
0.492 (0.368, 0.615) |
29.92 |
193.60 |
3 |
< 0.001 |
98.5 |
| Olive |
5 |
0.705 (0.476, 0.935) |
34.79 |
466.50 |
4 |
< 0.001 |
99.1 |
| Seasame |
1 |
0.960 (0.794, 1.126) |
6.71 |
- |
- |
- |
- |
| Soybean |
1 |
0.356 (0.326, 0.386) |
9.45 |
- |
- |
- |
- |
| Canola |
1 |
0.150 (0.130, 0.173) |
9.53 |
- |
- |
- |
- |
| Total |
14 |
0.508 (0.430, 0.587) |
100.0 |
1114.06 |
13 |
< 0.001 |
98.8 |
| Benzo[k]fluoranthene |
Corn |
3 |
14.168 (-12.793, 41.130) |
9.95 |
10227.24 |
2 |
< 0.001 |
100.0 |
| Sunflower |
5 |
0.541 (0.238, 0.843) |
34.23 |
948.87 |
4 |
< 0.001 |
99.6 |
| Olive |
6 |
1.083 (0.617, 1.549) |
34.35 |
22118.52 |
5 |
< 0.001 |
100.0 |
| Seasame |
1 |
0.420 (0.347, 0.493) |
7.05 |
- |
- |
- |
- |
| Soybean |
1 |
0.066 (0.064, 0.068) |
7.22 |
- |
- |
- |
- |
| Canola |
1 |
0.210 (0.183, 0.237) |
7.20 |
- |
- |
- |
- |
| Total |
17 |
1.333 (1.206, 1.460) |
100.0 |
1.1e + 05 |
16 |
< 0.001 |
100.0 |
| Chrysene |
Corn |
2 |
57.875 (-55.041, 170.79) |
6.72 |
38.83 |
1 |
< 0.001 |
97.4 |
| Sunflower |
4 |
0.934 (0.251, 1.617) |
26.10 |
149.18 |
3 |
< 0.001 |
98.0 |
| Olive |
6 |
0.873 (0.679, 1.067) |
30.74 |
1182.72 |
5 |
< 0.001 |
99.6 |
| Seasame |
2 |
0.962 (0.139, 1.785) |
16.03 |
42.39 |
1 |
< 0.001 |
97.6 |
| Soybean |
1 |
0.183 (0.173, 0.193) |
10.77 |
- |
- |
- |
- |
| Canola |
1 |
0.630 (0.534, 0.724) |
9.64 |
- |
- |
- |
- |
| Total |
16 |
0.760 (0.670, 0.849) |
100.0 |
2016.78 |
15 |
< 0.001 |
100.0 |
| Dibenz[a,h]anthracene |
Corn |
2 |
1.204 (-0.941, 3.349) |
11.26 |
35.33 |
1 |
< 0.001 |
97.2 |
| Sunflower |
6 |
7.137 (2.503, 11.771) |
32.72 |
6.2e + 05 |
5 |
< 0.001 |
100.0 |
| Olive |
5 |
0.137 (0.085, 0.189) |
26.13 |
205.21 |
4 |
< 0.001 |
98.1 |
| Seasame |
2 |
6.044 (-3.668, 15.756) |
11.80 |
2422.98 |
1 |
< 0.001 |
100.0 |
| Soybean |
1 |
0.073 (0.068, 0.078) |
6.03 |
- |
- |
- |
- |
| Canola |
2 |
0.314 (-0.009, 0.638) |
12.06 |
137.99 |
1 |
< 0.001 |
99.3 |
| Total |
18 |
2.933 (2.483, 3.383) |
100.0 |
6.3e + 05 |
17 |
< 0.001 |
100.0 |
| Fluoranthene |
Corn |
3 |
33.683 (-24.717, 92.083) |
13.16 |
16763.67 |
2 |
< 0.001 |
100.0 |
| Sunflower |
4 |
1.975 (1.231, 2.720) |
24.10 |
630.34 |
3 |
< 0.001 |
99.5 |
| Olive |
8 |
6.295 (4.653, 7.938) |
44.92 |
11309.88 |
7 |
< 0.001 |
99.9 |
| Seasame |
1 |
5.380 (4.448, 6.312) |
5.76 |
- |
- |
- |
- |
| Soybean |
1 |
0.923 (0.885, 0.961) |
6.08 |
- |
- |
- |
- |
| Canola |
1 |
6.020 (5.514, 6.526) |
5.98 |
- |
- |
- |
- |
| Total |
18 |
8.779 (7.812, 9.746) |
100.0 |
31552.30 |
17 |
< 0.001 |
99.9 |
| Fluorene |
Corn |
2 |
9.401 (-5.181, 23.983) |
14.46 |
4676.72 |
1 |
< 0.001 |
100.0 |
| Sunflower |
4 |
3.148 (1.240, 5.055) |
28.95 |
9798.76 |
3 |
< 0.001 |
100.0 |
| Olive |
5 |
3.576 (2.830, 4.322) |
34.87 |
217.83 |
4 |
< 0.001 |
98.2 |
| Seasame |
1 |
1.120 (0.926, 1.314) |
7.26 |
- |
- |
- |
- |
| Soybean |
1 |
0.677 (0.628, 0.726) |
7.28 |
- |
- |
- |
- |
| Canola |
1 |
4.810 (4.394, 5.226) |
7.18 |
- |
- |
- |
- |
| Total |
14 |
4.129 (3.181, 5.077) |
100.0 |
32422.25 |
13 |
< 0.001 |
100.0 |
Indeno
(l,2,3-c,d)pyrene |
Corn |
1 |
7.260 (5.010, 9.510) |
0.24 |
- |
- |
- |
- |
| Sunflower |
3 |
0.780 (0.200, 1.215) |
36.26 |
81.43 |
2 |
< 0.001 |
97.5 |
| Olive |
4 |
1.504 (0.900, 2.108) |
37.15 |
134.82 |
3 |
< 0.001 |
97.8 |
| Seasame |
1 |
1.030 (0.852, 1.208) |
11.0 |
- |
- |
- |
- |
| Soybean |
1 |
0.280 (0.260, 0.300) |
15.35 |
- |
- |
- |
- |
| Total |
10 |
0.712 (0.602, 0.823) |
100.0 |
518.49 |
9 |
< 0.001 |
98.3 |
| Naphthalene |
Corn |
2 |
1.420 (1.295, 1.545) |
9.74 |
- |
- |
- |
- |
| Sunflower |
4 |
4.556 (3.384, 5.727) |
25.79 |
46.48 |
2 |
< 0.001 |
95.7 |
| Olive |
5 |
11.264 (8.837, 13.691) |
35.74 |
2816.15 |
4 |
< 0.001 |
99.9 |
| Seasame |
1 |
4.190 (3.464, 4.916) |
9.38 |
- |
- |
- |
- |
| Soybean |
1 |
3.920 (3.659, 4.181) |
9.70 |
- |
- |
- |
- |
| Canola |
1 |
4.650 (4.289, 5.011) |
9.65 |
- |
- |
- |
- |
| Total |
14 |
6.489 (5.336, 7.643) |
100.0 |
3669.72 |
11 |
< 0.001 |
99.8 |
| Phenanthrene |
Corn |
2 |
4.291 (-1.795,10.377) |
13.44 |
595.09 |
1 |
< 0.001 |
100.0 |
| Sunflower |
4 |
3.103 (1.577, 4.629) |
26.90 |
1189.07 |
3 |
< 0.001 |
99.7 |
| Olive |
6 |
22.451 (15.911, 28.990) |
39.57 |
34492.22 |
5 |
< 0.001 |
100.0 |
| Seasame |
1 |
5.220 (4.316, 6.124) |
6.64 |
- |
- |
- |
- |
| Soybean |
1 |
1.680 (1.616, 1.744) |
6.73 |
- |
- |
- |
- |
| Canola |
1 |
3.970 (3.551, 4.389) |
6.71 |
- |
- |
- |
- |
| Total |
15 |
10.994 (8.967, 13.021) |
100.0 |
39136.22 |
14 |
< 0.001 |
100.0 |
| Pyrene |
Corn |
3 |
10.443 (1.688, 19.199) |
12.81 |
12938.13 |
2 |
< 0.001 |
100.0 |
| Sunflower |
5 |
2.187 (1.435, 2.939) |
28.16 |
1090.61 |
4 |
< 0.001 |
99.6 |
| Olive |
8 |
3.755 (2.714, 4.795) |
42.45 |
8765.13 |
7 |
< 0.001 |
99.9 |
| Seasame |
1 |
5.740 (4.746, 6.734) |
5.26 |
- |
- |
- |
- |
| Soybean |
1 |
1.080 (0.991, 1.169) |
7.28 |
- |
- |
- |
- |
| Canola |
1 |
8.010 (7.708, 8.312) |
5.65 |
- |
- |
- |
- |
| Total |
19 |
4.107 (3.280, 4.934) |
100.0 |
32952.81 |
18 |
< 0.001 |
99.9 |
Note. ES: Effect size; CI: Confidence interval; df: Degree of freedom.
Table 2.
Meta-Analysis of the Concentration of Polycyclic Aromatic Hydrocarbons in Vegetable Oils Based on the Type of WHO Regions
|
Metal
|
Meat
|
Number of studies
|
ES (95% CI)
|
Heterogeneity
|
|
Weight (%)
|
Statistics
|
df
|
P
Value
|
I2 (%)
|
| Acenaphthene |
EURO |
4 |
0.545 (-0.319, 1.409) |
45.30 |
1.1e + 05 |
3 |
< 0.001 |
100.0 |
| EMRO |
4 |
3.527 (2.600, 4.455) |
44.33 |
260.60 |
3 |
< 0.001 |
98.8 |
| WPRO |
1 |
4.000 (3.467, 4.533) |
10.37 |
- |
- |
- |
- |
| Acenaphthylene |
EURO |
4 |
2.474 (2.210, 2.739) |
71.71 |
0.03 |
3 |
0.998 |
0.0 |
| WPRO |
3 |
26.654 (4.135, 49.173) |
28.29 |
231.57 |
2 |
< 0.001 |
99.1 |
| Anthracene |
EURO |
11 |
0.881 (0.776, 0.986) |
63.59 |
2416.35 |
10 |
< 0.001 |
99.6 |
| EMRO |
4 |
3.312 (1.993, 4.632) |
29.06 |
429.15 |
3 |
< 0.001 |
99.3 |
| WPRO |
2 |
4.405 (0.211, 8.598) |
7.35 |
51.97 |
1 |
< 0.001 |
98.1 |
| Benzo[a]anthracene |
EURO |
13 |
1.678 (1.440, 1.917) |
67.0 |
16019.84 |
12 |
< 0.001 |
99.9 |
| EMRO |
4 |
0.614 (0.296, 0.932) |
25.44 |
139.49 |
3 |
< 0.001 |
97.8 |
| WPRO |
2 |
5.106 (-3.821, 14.033) |
7.56 |
115.97 |
1 |
< 0.001 |
99.1 |
| Benzo(a)pyrene |
EURO |
11 |
0.395 (0.348, 0.442) |
62.66 |
1915.59 |
10 |
< 0.001 |
99.5 |
| EMRO |
8 |
1.135 (0.903, 1.367) |
37.12 |
593.94 |
7 |
< 0.001 |
98.8 |
| WPRO |
1 |
8.900 (7.382, 10.418) |
0.22 |
- |
- |
- |
- |
| Benzo[b]fluoranthene |
EURO |
3 |
0.251 (0.153, 0.349) |
43.61 |
563.97 |
2 |
< 0.001 |
99.6 |
| EMRO |
4 |
0.215 (0.091, 0.339) |
56.39 |
250.54 |
3 |
< 0.001 |
98.8 |
| Benzo[b]fluorene |
EURO |
9 |
2.185 (1.709, 2.661) |
87.02 |
11215.11 |
8 |
< 0.001 |
99.9 |
| WPRO |
2 |
8.446 (-6.920, 23.811) |
12.98 |
121.24 |
1 |
< 0.001 |
99.2 |
| Benzo[e]pyrene |
EURO |
2 |
15.130 (6.836, 23.424) |
15.86 |
24.28 |
1 |
< 0.001 |
95.9 |
| EMRO |
5 |
0.464 (0.263, 0.665) |
70.12 |
282.06 |
4 |
< 0.001 |
98.6 |
| WPRO |
1 |
0.740 (0.665, 0.815) |
14.02 |
- |
- |
- |
- |
| Benzo(g,h,i)perylene |
EURO |
9 |
0.646 (0.537, 0.755) |
58.84 |
268.83 |
8 |
< 0.001 |
97.0 |
| EMRO |
4 |
0.176 (0.107, 0.245) |
38.07 |
183.84 |
3 |
< 0.001 |
98.4 |
| WPRO |
1 |
2.160 (1.792, 2.528) |
3.09 |
- |
- |
- |
- |
| Benzo[k]fluoranthene |
EURO |
11 |
1.835 (1.674, 1.996) |
63.50 |
1.1e + 05 |
10 |
< 0.001 |
100.0 |
| EMRO |
4 |
0.257 (0.109, 0.405) |
28.77 |
394.79 |
3 |
< 0.001 |
99.2 |
| WPRO |
2 |
4.520 (-3.133, 12.174) |
7.74 |
112.19 |
1 |
< 0.001 |
99.1 |
| Chrysene |
EURO |
12 |
0.711 (0.605, 0.817) |
58.79 |
1068.79 |
9 |
< 0.001 |
99.2 |
| EMRO |
4 |
0.890 (0.319, 1.461) |
30.92 |
356.51 |
3 |
< 0.001 |
99.2 |
| WPRO |
2 |
4.942 (-3.740, 13.625) |
10.28 |
116.75 |
1 |
< 0.001 |
99.1 |
| Dibenz[a,h]anthracene |
EURO |
12 |
3.927 (3.303, 4.551) |
67.76 |
6.3e + 05 |
11 |
< 0.001 |
100.0 |
| EMRO |
4 |
0.139 (0.092, 0.185) |
24.13 |
123.78 |
3 |
< 0.001 |
97.6 |
| WPRO |
2 |
7.602 (-6.470, 21.674) |
8.10 |
123.55 |
1 |
< 0.001 |
99.2 |
| Fluoranthene |
EURO |
12 |
11.173 (9.776, 12.569) |
65.28 |
28948.67 |
11 |
< 0.001 |
100.0 |
| EMRO |
4 |
2.625 (1.373, 3.877) |
24.20 |
1818.97 |
3 |
< 0.001 |
99.8 |
| WPRO |
2 |
9.231 (2.746, 15.717) |
10.51 |
31.91 |
1 |
< 0.001 |
96.9 |
| Fluorene |
EURO |
8 |
4.175 (2.813, 5.537) |
57.86 |
30944.68 |
7 |
< 0.001 |
100.0 |
| EMRO |
4 |
2.560 (1.841, 3.279) |
28.93 |
199.50 |
3 |
< 0.001 |
98.5 |
| WPRO |
2 |
7.211 (6.453, 7.969) |
13.21 |
0.58 |
1 |
0.448 |
0.0 |
| Indeno(l,2,3-c,d)pyrene |
EURO |
9 |
0.637 (0.537, 0.737) |
98.82 |
400.59 |
8 |
< 0.001 |
98.0 |
| WPRO |
1 |
5.730 (4.753, 6.707) |
1.18 |
- |
- |
- |
- |
| Naphthalene |
EURO |
6 |
5.442 (4.469, 6.415) |
51.29 |
206.10 |
5 |
< 0.001 |
97.6 |
| EMRO |
4 |
2.764 (1.718, 3.810) |
38.85 |
560.28 |
3 |
< 0.001 |
99.5 |
| WPRO |
2 |
24.631 (13.145, 36.117) |
9.86 |
15.59 |
1 |
< 0.001 |
93.6 |
| Phenanthrene |
EURO |
9 |
14.601 (10.986, 18.216) |
52.72 |
37733.77 |
8 |
< 0.001 |
100.0 |
| EMRO |
4 |
2.599 (1.821, 3.378) |
26.91 |
363.35 |
3 |
< 0.001 |
99.2 |
| WPRO |
2 |
11.991 (4.221, 19.762) |
12.80 |
37.46 |
1 |
< 0.001 |
97.3 |
| Pyrene |
EURO |
13 |
3.748 (2.708, 4.788) |
67.04 |
26874.31 |
12 |
< 0.001 |
100.0 |
| EMRO |
4 |
3.617 (2.149, 5.084) |
22.70 |
2356.22 |
3 |
< 0.001 |
99.9 |
| WPRO |
2 |
7.662 (5.065, 10.259) |
10.26 |
10.32 |
1 |
0.001 |
90.3 |
Note. ES: Effect size; CI: Confidence interval; df: Degree of freedom; WHO: World Health Organization. EURO, European Region; EMRO, Eastern Mediterranean Region; WPRO,Western Pacific Region.
3.3. Levels of Polycyclic Aromatic Hydrocarbons in Vegetable Oils According to the World Health Organization Region
The concentration of PAHs in vegetable oils (corn, sunflower, olive, sesame, soybean, and canola) varied by country (Table 2). Among vegetable oils, the highest PAH concentrations in the European Region (EURO), Eastern Mediterranean Region (EMRO), and Western Pacific Region (WPRO) concerning vegetable oils (corn, sunflower, olive, sesame, soybean, and canola) were 15.13 µg/kg, 3.617 µg/kg, and 26.65 µg/kg, which were attributed to benzo[e]pyrene, pyrene, and acenaphthylene, respectively. In the EURO, EMRO, and WPRO regions, the lowest amounts of PAHs in vegetable oils (corn, sunflower, olive, sesame, soybean, and canola) were 0.25 µg/kg, 0.139 µg/kg, and 0.74 µg/kg, respectively, which belonged to benzo[b]fluoranthene, dibenz[a,h]anthracene, and benzo(g,h,i)perylene, respectively. The results of the present meta-analysis revealed that there were noteworthy alterations (P < 0.05) between PAH concentrations in countries from the WHO. Various countries have surveyed the level of PAHs in vegetable oil samples. In Italy, Vichi et al investigated the content of PAHs in olives. According to their analysis, the amounts of phenanthrene, anthracene, and fluoranthene were 16.00 µg/kg, 2.3 µg/kg, and 6.00 µg/kg, respectively (42). The results of another study conducted by Martorell et al showed that naphthalene, acenaphthylene, acenaphthene, fluorine, phenanthrene, anthracene, and fluoranthene levels in the corn oil were 12.5 µg/kg, 2.45 µg/kg, 2.45 µg/kg, 2.45 µg/kg, 2.45 µg/kg, 2.45 µg/kg, and 2.45 µg/kg, respectively (43). According to Wu et al, in olive samples collected from China, fluorine, benzo[k]fluoranthene, acenaphtelene, chrysene indeno[1,2,3-cd]pyrene, and anthracene were present at mean concentrations of 3.81 µg/kg, 4.23 µg/kg, 11.31 µg/kg, 4.70 µg/kg, 2.86 µg/kg, and 3.29 µg/kg, respectively (44). Alomirah et al reported that the mean concentrations of benzo[a]pyrene in the soybean, corn, sesame, canola, and sunflower were 0.71 µg/kg, 0.27 µg/kg, 2.05 µg/kg, 4.26 µg/kg, and 0.71 µg/kg, respectively (45). As a result, there are significant differences in PAH contamination between various regions. According to the results of this study (Table 2), this difference is likely caused by environmental contamination from the region of the cultivation, pollution from active industries and mines, pollution in urban and rural areas, and cooking techniques. Various studies have examined the presence of PAHs in food samples, and many publications discuss differences in the contamination of PAHs in different vegetable oils. Emissions from traffic, vehicular exhausts, and industrial sources may be mainly responsible for the PAH contamination of edible oils. In this regard, Corradetti et al found that vegetable oils from plants exposed to vehicular exhausts were highly contaminated with PAHs compared to vegetable oils from plants exposed to pitch condensate emissions (46). According to another study, plants that grow in industrial areas and high-traffic environments have higher levels of PAH pollution than other regions (47). Bishnoi et al concluded that soil layers in busy traffic areas were more contaminated with PAHs (48). Further, Srogi reported that high concentrations of atmospheric PAHs are caused by increased vehicular traffic and the limited dispersion of pollutants in the urban environment, which has an effect on the production of plant oil (49). The environmental contamination of the region also influences different levels of PAHs in various oils. In this respect, Wennrich et al demonstrated that the concentration of PAHs in vegetables was affected by distance from sources and atmospheric conditions, including pollution of water, soil, and exogenous compounds present in the plant (50). Studies have shown that contamination can enter the plant’s roots, leaves, and stems. A direct relationship between soil PAH concentrations and plants was reported by Srogi, who found that plants grown on polluted sediment soils had the highest concentration of PAHs. Moreover, the main routes of entry for PAHs into surface waters were atmospheric fallout, urban runoff, municipal effluents, industrial effluents, and oil spills or leaks (49). The results of a review study indicated that vegetable oil producers irrigated with wastewater had higher levels of PAHs than those from rural areas (51). Several factors influence the content of PAHs in food, including the type, county of origin, ecological and. PAHs can be released by natural processes, such as volcanic eruptions or forest fires, or by human activities, such as industry, mining, vehicles, or household processes (52).
3.4. Health Risk Assessment
Vegetable oils made from agricultural products (e.g., fruits and seeds) are extensively used throughout the world (53). PAHs can pose a risk to human health. The responsible and relevant organizations list PAHs as carcinogenic. The European Union reported 2 µg/kg of benzo[a]pyrene in oils and fats safe for health (54). Cancers of the lung, respiratory system, and stomach caused by PAHs have been established by several studies (55). Tables 3 and 4 present data on the risks of carcinogenic or mutagenic PAHs in different countries. Among countries with the highest carcinogenic risk, the Netherlands ranked first, followed by Turkey, Spain, China, Poland, Portugal, Egypt, Korea, Greece, and Kuwait. In addition, from the viewpoint of mutagenic risk, the Netherlands ranked first, followed by Spain, Portugal, Poland, Turkey, China, Korea, Egypt, Greece, and Kuwait. There has been research on the carcinogenicity and metastasis risk of different products, the results of which are in line with ours. Based on a typical Indian diet, the cancer risk of PAHs depends on consumption patterns, preparation methods, contamination sources, the body weight of people, gender, and age (56). To reduce the contamination, transfer, and formation of PAHs in foods, food safety and regulatory authorities must develop guidelines for food and packaging providers. Governmental regulators should be responsible for conducting periodic food testing, including testing the oils that go through refining and deodorization processes. The findings of this study indicated that consumers can prevent PAH contamination in food during cooking by preventing the frequent use of cooking oils, removing burnt parts of food, choosing suitable fuel and heat sources, and the like (57).
Table 3.
Carcinogenic Risk Assessment Based on BaP Equivalency for Vegetable Oils
|
Country
|
IR (kg)
|
BaA
|
BaP
|
BbFlu
|
BkFlu
|
Chr
|
DahA
|
IndP
|
Total
|
| Greece |
26.5 |
3.09E-09 |
1.42E-09 |
4.79E-11 |
6.39E-12 |
3.09E-11 |
|
|
4.60E-09 |
| Turkey |
24.9 |
2.71E-09 |
4.43E-09 |
3.59E-09 |
2.54E-09 |
|
|
|
1.33E-08 |
| China |
8.1 |
2.15E-09 |
1.98E-08 |
3.63E-09 |
1.88E-10 |
2.09E-11 |
3.29E-08 |
1.27E-09 |
5.99E-08 |
| Egypt |
6.1 |
1.04E-10 |
2.55E-09 |
3.63E-11 |
4.30E-12 |
1.51E-12 |
2.34E-10 |
|
2.93E-09 |
| Korea |
18.6 |
3.01E-10 |
|
3.41E-10 |
3.31E-11 |
2.80E-12 |
2.45E-09 |
|
3.12E-09 |
| Kuwait |
20.2 |
|
8.85E-09 |
|
|
|
|
|
8.85E-09 |
| Netherlands |
14.3 |
1.62E-09 |
3.58E-09 |
1.76E-09 |
8.36E-11 |
1.59E-10 |
3.57E-09 |
1.14E-09 |
1.19E-08 |
| Poland |
13.4 |
6.07E-09 |
4.59E-09 |
2.83E-10 |
1.54E-11 |
5.10E-12 |
4.96E-08 |
3.78E-10 |
6.10E-08 |
| Portugal |
20.5 |
1.90E-10 |
7.06E-10 |
1.41E-10 |
1.89E-11 |
1.30E-12 |
3.39E-10 |
1.95E-10 |
1.59E-09 |
| Spain |
33.3 |
8.94E-10 |
8.23E-09 |
8.94E-10 |
8.94E-11 |
8.94E-12 |
8.94E-09 |
8.94E-10 |
2.00E-08 |
| Total |
--- |
1.71E-08 |
5.41E-08 |
1.07E-08 |
2.97E-09 |
2.30E-10 |
9.81E-08 |
3.88E-09 |
1.87E-07 |
Note. Chr: Chrysen; BaA: Benzo[a]anthracene; BaP: Benzo[a]pyrene; BkF: Benzo[k]fluoranthene; BbF: Benzo[b]fluranthene; BghiP: Benzo[g,h,i]perylene; DahA: Dibenz[a,h]anthracene; IndP: Indeno[1,2,3,c,d]pyrene.
Table 4.
Mutagenic Risk Assessment Based on BaP Equivalency for Vegetable Oils
|
Country
|
IR (kg)
|
BaA
|
BaP
|
BbFlu
|
BkFlu
|
Chr
|
DahA
|
IndP
|
Total
|
| Greece |
26.5 |
2.53E-09 |
1.42E-09 |
1.20E-10 |
7.03E-11 |
5.25E-10 |
|
|
4.67E-09 |
| Turkey |
24.9 |
2.22E-09 |
4.43E-09 |
8.97E-09 |
2.79E-08 |
|
|
|
4.35E-08 |
| China |
8.1 |
1.77E-09 |
1.98E-08 |
9.07E-09 |
2.07E-09 |
3.55E-10 |
9.55E-09 |
3.94E-09 |
4.65E-08 |
| Egypt |
6.1 |
8.57E-11 |
2.55E-09 |
9.09E-11 |
4.73E-11 |
2.56E-11 |
6.79E-11 |
|
2.87E-09 |
| Korea |
18.6 |
2.47E-10 |
|
8.54E-10 |
3.64E-10 |
4.76E-11 |
7.09E-10 |
|
2.22E-09 |
| Kuwait |
20.2 |
|
8.85E-09 |
|
|
|
|
|
8.85E-09 |
| Netherlands |
14.3 |
1.33E-09 |
3.58E-09 |
4.40E-09 |
9.19E-10 |
2.70E-09 |
1.03E-09 |
3.54E-09 |
1.75E-08 |
| Poland |
13.4 |
4.98E-09 |
4.59E-09 |
7.07E-10 |
1.70E-10 |
8.68E-11 |
1.44E-08 |
1.17E-09 |
2.61E-08 |
| Portugal |
20.5 |
1.56E-10 |
7.06E-10 |
3.53E-10 |
2.08E-10 |
2.22E-11 |
9.83E-11 |
6.04E-10 |
2.15E-09 |
| Spain |
33.3 |
7.33E-10 |
8.23E-09 |
2.24E-09 |
9.83E-10 |
1.52E-10 |
2.59E-09 |
2.77E-09 |
1.77E-08 |
| Total |
--- |
1.41E-08 |
5.41E-08 |
2.68E-08 |
3.27E-08 |
3.91E-09 |
2.84E-08 |
1.20E-08 |
1.72E-07 |
Note. Chr: Chrysen; BaA: Benzo[a]anthracene; BaP: Benzo[a]pyrene; BkF: Benzo[k]fluoranthene; BbF: Benzo[b]fluranthene; BghiP: Benzo[g,h,i]perylene; DahA: Dibenz[a,h]anthracene; IndP: Indeno[1,2,3,c,d]pyrene.
4. Conclusion
This research evaluated the PAH content in various vegetable oils, depending on the kind of PAH and country of origin. Further, the health risk was investigated according to the oil consumption pattern in different countries. Thirteen studies reported that the levels of PAHs in different countries varied based on the inclusion and exclusion criteria. Additionally, the physicochemical characteristics of PAHs, the drying processes of the oil seeds, packaging material, soil burning, and the source of the vegetable oil were considered critical factors in determining the levels of PAHs in vegetable oils. In different countries, PAHs were found to pose risks to health. Therefore, vegetable oils should be monitored by different agencies to reduce contaminants.
Acknowledgments
The authors would like to acknowledge the Deputy of Research and Technology, Hamadan University of Medical Sciences, for their financial support (Grant No. 140205343394).
Competing Interests
The authors declared no conflict of interests regarding this paper.
Funding
This study was funded by the Deputy of Research and Technology, Hamadan University of Medical Sciences (Grant No: 140205343394).
References
- Olatunji OS, Fatoki OS, Ximba BJ, Opeolu BO. Polycyclic aromatic hydrocarbons (PAHs) in edible oil: temperature effect on recovery from base hydrolysis product and health risk factor. Food Public Health 2014; 4(2):23-30. [ Google Scholar]
- Hossain MA, Salehuddin SM. Polycyclic aromatic hydrocarbons (PAHs) in edible oils by gas chromatography coupled with mass spectroscopy. Arab J Chem 2012; 5(3):391-6. doi: 10.1016/j.arabjc.2010.09.012 [Crossref] [ Google Scholar]
- Zedeck MS. Polycyclic aromatic hydrocarbons: a review. J Environ Pathol Toxicol 1980; 3(5-6):537-67. [ Google Scholar]
- Barranco A, Alonso-Salces RM, Bakkali A, Berrueta LA, Gallo B, Vicente F. Solid-phase clean-up in the liquid chromatographic determination of polycyclic aromatic hydrocarbons in edible oils. J Chromatogr A 2003; 988(1):33-40. doi: 10.1016/s0021-9673(02)02059-9 [Crossref] [ Google Scholar]
- Aguinaga N, Campillo N, Viñas P, Hernández-Córdoba M. Determination of 16 polycyclic aromatic hydrocarbons in milk and related products using solid-phase microextraction coupled to gas chromatography-mass spectrometry. Anal Chim Acta 2007; 596(2):285-90. doi: 10.1016/j.aca.2007.06.005 [Crossref] [ Google Scholar]
- Asamoah A, Nikbakht Fini M, Essumang DK, Muff J, Søgaard EG. PAHs contamination levels in the breast milk of Ghanaian women from an e-waste recycling site and a residential area. Sci Total Environ 2019; 666:347-54. doi: 10.1016/j.scitotenv.2019.02.204 [Crossref] [ Google Scholar]
- Olyaei SR, Riahi Bakhtiari AR, Sharifpour I. Pyrene’s bioaccumulation in muscle, gill and liver tissues of common carp (Cyprinus carpio): in vitro study. Iran J Health Environ 2015;8(2):191-202. [Persian].
- Bandowe BA, Bigalke M, Boamah L, Nyarko E, Saalia FK, Wilcke W. Polycyclic aromatic compounds (PAHs and oxygenated PAHs) and trace metals in fish species from Ghana (West Africa): bioaccumulation and health risk assessment. Environ Int 2014; 65:135-46. doi: 10.1016/j.envint.2013.12.018 [Crossref] [ Google Scholar]
- Bandowe BA, Meusel H. Nitrated polycyclic aromatic hydrocarbons (nitro-PAHs) in the environment - a review. Sci Total Environ 2017; 581-582:237-57. doi: 10.1016/j.scitotenv.2016.12.115 [Crossref] [ Google Scholar]
- Nwaichi EO, Ntorgbo SA. Assessment of PAHs levels in some fish and seafood from different coastal waters in the Niger Delta. Toxicol Rep 2016; 3:167-72. doi: 10.1016/j.toxrep.2016.01.005 [Crossref] [ Google Scholar]
- Khanverdiluo S, Talebi-Ghane E, Heshmati A, Mehri F. The concentration of polycyclic aromatic hydrocarbons (PAHs) in mother milk: a global systematic review, meta-analysis and health risk assessment of infants. Saudi J Biol Sci 2021; 28(12):6869-75. doi: 10.1016/j.sjbs.2021.07.066 [Crossref] [ Google Scholar]
- IARC. Agents classified by the IARC monographs, vol 1-100. https://monographs.iarc.who.int/agents-classified-by-the-iarc/.
- World Health Organization (WHO), International Programme on Chemical Safety (IPCS). Environmental Health Criteria 202: Selected Non-Heterocyclic Polycyclic Aromatic Hydrocarbon. Geneva: WHO; 1998.
- Kara D, Fisher A, Hill S. Extraction of trace elements by ultrasound-assisted emulsification from edible oils producing detergentless microemulsions. Food Chem 2015; 188:143-8. doi: 10.1016/j.foodchem.2015.04.057 [Crossref] [ Google Scholar]
- Assiri AM, Elbanna K, Abulreesh HH, Ramadan MF. Bioactive compounds of cold-pressed thyme (Thymus vulgaris) oil with antioxidant and antimicrobial properties. J Oleo Sci 2016; 65(8):629-40. doi: 10.5650/jos.ess16042 [Crossref] [ Google Scholar]
- Ben Hsouna A, Gargouri M, Dhifi W, Ben Saad R, Sayahi N, Mnif W. Potential anti-inflammatory and antioxidant effects of Citrus aurantium essential oil against carbon tetrachloride-mediated hepatotoxicity: a biochemical, molecular and histopathological changes in adult rats. Environ Toxicol 2019; 34(4):388-400. doi: 10.1002/tox.22693 [Crossref] [ Google Scholar]
- Chanson-Rolle A, Braesco V, Chupin J, Bouillot L. Nutritional composition of orange juice: a comparative study between French commercial and home-made juices. Food Nutr Sci 2016; 7(4):252-61. doi: 10.4236/fns.2016.74027 [Crossref] [ Google Scholar]
- Dennis MJ, Massey RC, McWeeny DJ, Knowles ME, Watson D. Analysis of polycyclic aromatic hydrocarbons in UK total diets. Food Chem Toxicol 1983; 21(5):569-74. doi: 10.1016/0278-6915(83)90142-4 [Crossref] [ Google Scholar]
- Moret S, Piani B, Bortolomeazzi R, Contel LS. HPLC determination of polycyclic aromatic hydrocarbons in olive oils. Z Lebensm Unters Forsch A 1997; 205(2):116-20. doi: 10.1007/s002170050136 [Crossref] [ Google Scholar]
- Guillén MD, Sopelana P. Load of polycyclic aromatic hydrocarbons in edible vegetable oils: importance of alkylated derivatives. J Food Prot 2004; 67(9):1904-13. doi: 10.4315/0362-028x-67.9.1904 [Crossref] [ Google Scholar]
- Abbasi-Ghahramanloo A, Safiri S, Torkamannezhad-Sabzevari J, Kogani M, Holakuie Naeini K, Hassanipour Azgomi S. Community assessment for identification and prioritization health problems in Navai Kola village, Babol, Iran. J Anal Res Clin Med 2016; 4(1):47-52. doi: 10.15171/jarcm.2016.008 [Crossref] [ Google Scholar]
- Salahinejad M, Aflaki F. Toxic and essential mineral elements content of black tea leaves and their tea infusions consumed in Iran. Biol Trace Elem Res 2010; 134(1):109-17. doi: 10.1007/s12011-009-8449-z [Crossref] [ Google Scholar]
- Piskin MB, Ozdemir OD, Kipcak AS, Tuğrul N, Derun EM. Some essential element concentrations of Turkish rosehip teas. Adv Sci Lett 2013; 19(11):3148-50. doi: 10.1166/asl.2013.5132 [Crossref] [ Google Scholar]
- Özden H, Özden S. Levels of heavy metals and ochratoxin a in medicinal plants commercialized in Turkey. Turk J Pharm Sci 2018; 15(3):376-81. doi: 10.4274/tjps.74936 [Crossref] [ Google Scholar]
- Talebi Ghane E, Poormohammadi A, Khazaei S, Mehri F. Concentration of potentially toxic elements in vegetable oils and health risk assessment: a systematic review and meta-analysis. Biol Trace Elem Res 2022; 200(1):437-46. doi: 10.1007/s12011-021-02645-x [Crossref] [ Google Scholar]
- Asamoah A. Assessment of the Contamination Level of Persistent Organic Pollutants in Breast Milk of Ghanian Women from a Polluted Area in Accra. Aalborg Universitetsforlag; 2017. doi: 10.5278/vbn.phd.eng.00011.
- United States Environmental Protection Agency (USEPA). Provisional Guidance for Quantitative Risk Assessment of Polycyclic Aromatic Hydrocarbons (PAH). Washington, DC: USEPA; 1993.
- Durant JL, Busby WF, Jr Jr, Lafleur AL, Penman BW, Crespi CL. Human cell mutagenicity of oxygenated, nitrated and unsubstituted polycyclic aromatic hydrocarbons associated with urban aerosols. Mutat Res 1996; 371(3-4):123-57. doi: 10.1016/s0165-1218(96)90103-2 [Crossref] [ Google Scholar]
- Phillips L, Johnson M, Deener K, Bonanni C. EPA’s exposure assessment toolbox (EPA-Expo-Box). J Environ Inform 2015; 25(2):81-4. doi: 10.3808/jei.201400269 [Crossref] [ Google Scholar]
- Heshmati A, Mehri F, Karami-Momtaz J, Mousavi Khaneghah A. The concentration and health risk of potentially toxic elements in black and green tea—both bagged and loose-leaf. Qual Assur Saf Crops Foods 2020; 12(3):140-50. doi: 10.15586/qas.v12i3.761 [Crossref] [ Google Scholar]
- Dost K, İdeli C. Determination of polycyclic aromatic hydrocarbons in edible oils and barbecued food by HPLC/UV–Vis detection. Food Chem 2012; 133(1):193-9. doi: 10.1016/j.foodchem.2012.01.001 [Crossref] [ Google Scholar]
- Ma Y, Deng L, Ma P, Wu Y, Yang X, Xiao F. In vivo respiratory toxicology of cooking oil fumes: evidence, mechanisms and prevention. J Hazard Mater 2021; 402:123455. doi: 10.1016/j.jhazmat.2020.123455 [Crossref] [ Google Scholar]
- Teixeira VH, Casal S, Oliveira MB. PAHs content in sunflower, soybean and virgin olive oils: evaluation in commercial samples and during refining process. Food Chem 2007; 104(1):106-12. doi: 10.1016/j.foodchem.2006.11.007 [Crossref] [ Google Scholar]
- Swetman T. Contamination of coconut oil by PAH. International News on Fats, Oils, and Related Materials 1999; 10(7):706-12. [ Google Scholar]
- Moreda W, Pérez-Camino MC, Cert A. Gas and liquid chromatography of hydrocarbons in edible vegetable oils. J Chromatogr A 2001; 936(1-2):159-71. doi: 10.1016/s0021-9673(01)01222-5 [Crossref] [ Google Scholar]
- Larsson BK, Eriksson AT, Cervenka M. Polycyclic aromatic hydrocarbons in crude and deodorized vegetable oils. J Am Oil Chem Soc 1987; 64(3):365-70. doi: 10.1007/bf02549296 [Crossref] [ Google Scholar]
- Veyrand B, Brosseaud A, Sarcher L, Varlet V, Monteau F, Marchand P. Innovative method for determination of 19 polycyclic aromatic hydrocarbons in food and oil samples using gas chromatography coupled to tandem mass spectrometry based on an isotope dilution approach. J Chromatogr A 2007; 1149(2):333-44. doi: 10.1016/j.chroma.2007.03.043 [Crossref] [ Google Scholar]
- Pandey MK, Mishra KK, Khanna SK, Das M. Detection of polycyclic aromatic hydrocarbons in commonly consumed edible oils and their likely intake in the Indian population. J Am Oil Chem Soc 2004; 81(12):1131-6. doi: 10.1007/s11746-004-1030-4 [Crossref] [ Google Scholar]
- Srivastava S, Singh M, George J, Bhui K, Murari Saxena A, Shukla Y. Genotoxic and carcinogenic risks associated with the dietary consumption of repeatedly heated coconut oil. Br J Nutr 2010; 104(9):1343-52. doi: 10.1017/s0007114510002229 [Crossref] [ Google Scholar]
- Moret S, Purcaro G, Conte LS. Polycyclic aromatic hydrocarbons in vegetable oils from canned foods. Eur J Lipid Sci Technol 2005; 107(7-8):488-96. doi: 10.1002/ejlt.200501060 [Crossref] [ Google Scholar]
- Chen J, Chen S. Removal of polycyclic aromatic hydrocarbons by low density polyethylene from liquid model and roasted meat. Food Chem 2005; 90(3):461-9. doi: 10.1016/j.foodchem.2004.05.010 [Crossref] [ Google Scholar]
- Vichi S, Pizzale L, Conte LS, Buxaderas S, López-Tamames E. The occurrence of volatile and semi-volatile aromatic hydrocarbons in virgin olive oils from north-eastern Italy. Food Control 2007; 18(10):1204-10. doi: 10.1016/j.foodcont.2006.07.015 [Crossref] [ Google Scholar]
- Martorell I, Perelló G, Martí-Cid R, Castell V, Llobet JM, Domingo JL. Polycyclic aromatic hydrocarbons (PAH) in foods and estimated PAH intake by the population of Catalonia, Spain: temporal trend. Environ Int 2010; 36(5):424-32. doi: 10.1016/j.envint.2010.03.003 [Crossref] [ Google Scholar]
- Wu S, Bao J, Wang Z, Zhang H, Xiao R. The regulated emissions and PAH emissions of bio-based long-chain ethers in a diesel engine. Fuel Process Technol 2021; 214:106724. doi: 10.1016/j.fuproc.2021.106724 [Crossref] [ Google Scholar]
- Alomirah H, Al-Zenki S, Husain A, Sawaya W, Ahmed N, Gevao B. Benzo[a]pyrene and total polycyclic aromatic hydrocarbons (PAHs) levels in vegetable oils and fats do not reflect the occurrence of the eight genotoxic PAHs. Food Addit Contam Part A Chem Anal Control Expo Risk Assess 2010; 27(6):869-78. doi: 10.1080/19440040903493793 [Crossref] [ Google Scholar]
- Corradetti E, Abbondanza C, Mazzanti L, Poli G. Determinazione gascromatografica e spettrofluorimetrica degli Idrocarburi Policiclici Aromatici (IPA) nell’olio extra vergine di oliva prodotto da olive contaminate da condensa di pece di origine industriale Considerazioni sulle possibili vie di contaminazione. Boll Chim Igien 1988; 39:297-317. [ Google Scholar]
- Farhadian A, Jinap S, Abas F, Sakar ZI. Determination of polycyclic aromatic hydrocarbons in grilled meat. Food Control 2010; 21(5):606-10. doi: 10.1016/j.foodcont.2009.09.002 [Crossref] [ Google Scholar]
- Bishnoi NR, Mehta U, Pandit GG. Quantification of polycyclic aromatic hydrocarbons in fruits and vegetables using high performance liquid chromatography. Indian J Chem Technol 2006; 13(1):30-5. [ Google Scholar]
- Srogi K. Monitoring of environmental exposure to polycyclic aromatic hydrocarbons: a review. Environ Chem Lett 2007; 5(4):169-95. doi: 10.1007/s10311-007-0095-0 [Crossref] [ Google Scholar]
- Wennrich L, Peter P, Zeibig M. Polycyclic aromatic hydrocarbon burden in fruit and vegetable species cultivated in allotments in an industrial area. Int J Environ Anal Chem 2002; 82(10):667-90. doi: 10.1080/0306731021000075401 [Crossref] [ Google Scholar]
- Zelinkova Z, Wenzl T. The occurrence of 16 EPA PAHs in food - a review. Polycycl Aromat Compd 2015; 35(2-4):248-84. doi: 10.1080/10406638.2014.918550 [Crossref] [ Google Scholar]
- Baek SO, Field RA, Goldstone ME, Kirk PW, Lester JN, Perry R. A review of atmospheric polycyclic aromatic hydrocarbons: sources, fate and behavior. Water Air Soil Pollut 1991; 60(3):279-300. doi: 10.1007/bf00282628 [Crossref] [ Google Scholar]
- Karunarathna NB, Fernando CJ, Munasinghe DM, Fernando R. Occurrence of aflatoxins in edible vegetable oils in Sri Lanka. Food Control 2019; 101:97-103. doi: 10.1016/j.foodcont.2019.02.017 [Crossref] [ Google Scholar]
- European Commission. Opinion of the scientific committee on food on the risks to human health of polycyclic aromatic hydrocarbons in food. European Commission Document SCF/CS/CNTM/PAH/29 Final. https://ec.europa.eu/food/fs/sc/scf/out153_en.pdf.
- Ledesma E, Rendueles M, Díaz M. Benzo(a)pyrene penetration on a smoked meat product during smoking time. Food Addit Contam Part A Chem Anal Control Expo Risk Assess 2014; 31(10):1688-98. doi: 10.1080/19440049.2014.949875 [Crossref] [ Google Scholar]
- Singh L, Varshney JG, Agarwal T. Polycyclic aromatic hydrocarbons’ formation and occurrence in processed food. Food Chem 2016; 199:768-81. doi: 10.1016/j.foodchem.2015.12.074 [Crossref] [ Google Scholar]
- Singh L, Agarwal T. PAHs in Indian diet: assessing the cancer risk. Chemosphere 2018; 202:366-76. doi: 10.1016/j.chemosphere.2018.03.100 [Crossref] [ Google Scholar]