Avicenna J Environ Health Eng. 12(1):1-9.
doi: 10.34172/ajehe.5471
Original Article
Application of Response Surface Methodology to Optimize Removal Efficiency of Fluoride by Ionic Liquid Modified Magnetic Activated Carbon Nanocomposite From Aqueous Solution
Leili Mohammadi Conceptualization, Data curation, Investigation, Project administration, Supervision, Writing – original draft, 1 
Mojtaba Davoudi Formal analysis, Investigation, Validation, 2, 3
Abbas Rahdar Visualization, 4
Somayeh Rahdar Data curation, Investigation, Methodology, Software, 5, 6, *
Muhammad Nadeem Zafar Project administration, 7
Mojdeh Jahantigh Resources, Writing – original draft, Writing – review & editing, 1, *
Javad Shahraki Formal analysis, Methodology, 8
Author information:
1Infectious Diseases and Tropical Medicine Research Center, Research Institute of Cellular and Molecular Sciences in Infectious Diseases, Zahedan University of Medical Sciences, Zahedan, Iran
2Department of Environmental Health Engineering, School of Health, Mashhad University of Medical Sciences, Mashhad, Iran
3Social Determinants of Health Research Center, Mashhad University of Medical Sciences, Mashhad, Iran.
4Department of Physics, Faculty of Science, University of Zabol, Zabol, Iran
5Student Research Committee, Department of Environmental Health Engineering, School of Health, Mashhad University of Medical Sciences, Mashhad, Iran
6Department of Environmental Health, Zabol University of Medical Sciences, Zabol, Iran
7Department of Chemistry, University of Gujrat, Gujrat, Pakistan
8Social Determinants of Health Research Center, Department Health Education and Promotion, School of Public Health, Shahid Sadoughi University of Medical Sciences, Yazd, Iran
Abstract
Fluoride in high concentrations is hazardous and a threat to human life. This study used response surface methodology (RSM) to remove fluoride using ionic liquid-modified magnetic activated carbon (IL@mAC) nanocomposite and optimized the process parameters. The IL@mAC nanocomposite was synthesized by Fourier transform infrared spectroscopy (FTIR) and X-ray powder diffraction (XRD), and its adsorption efficiency for removal of fluoride was investigated under different operational such as pH (2-8), contact time (15-100 minutes), initial concentration (10-50 mg/L), and IL@mAC composite (0.01-0.1 g) at room temperature. The equilibrium experiment showed that the highest removal efficiency (~88%) was obtained at pH 5, the initial concentration of adsorbent of 0.1 mg/L, the initial concentration of fluoride of 50 mg/L, and the processing time of 15 minutes. The findings indicated high correlation coefficients for the proposed model (adjusted R2=0.9527 and R2=0.8048). Furthermore, the pseudo-second-order kinetic model was ideal (R2=0.998). The current study suggested that the adsorption process optimized by effective operational factors is highly efficient for fluoride removal.
Keywords: Fluoride, Ionic liquid modification, Magnetic activated carbon, Response surface methodology, Aqueous solution
Copyright and License Information
© 2025 The Author(s); Published by Hamadan University of Medical Sciences.
This is an open-access article distributed under the terms of the Creative Commons Attribution License (
https://creativecommons.org/licenses/by/4.0), which permits unrestricted use, distribution, and reproduction in any medium, provided the original work is properly cited.
Please cite this article as follows: Mohammadi L, Davoudi M, Rahdar A, Rahdar S, Nadeem Zafar M, Jahantigh M, et al. Application of response surface methodology to optimize removal efficiency of fluoride by ionic liquid modified magnetic activated carbon nanocomposite from aqueous solution. Avicenna J Environ Health Eng. 2025;12(1):1-9. doi:10.34172/ajehe.5471
1. Introduction
Fluorine is the most electronegative element with high chemical reactivity in the form of fluoride (F-) (1). India accounts for 14.1% of all fluorine deposits in the earth’s crust, and fluorine sources are present in 17 Indian states (2). The World Health Organization (WHO) has determined that the ideal fluoride concentration for optimal efficacy is 1.5-5.5 mg/L (3), but due to high water consumption, the standard level for tropical regions was set lower, at about 1 mg/L (1). Fluoride has both beneficial and harmful effects on the body depending on its concentration. Its therapeutic effects include bone strengthening and prevention of tooth decay (2,4), and its harmful effects include skeletal diseases, fluorosis, brittle bones, liver and kidney cancers, brain injury, Alzheimer’s syndrome, thyroid disorder, neurological disorders, and low birth weight babies (5-8).
During the growth of permanent teeth in children, dental fluorosis increases enamel porosity and reduces mineral content, resulting in abnormal tooth growth (9). Some researchers have reported that fluorosis is irreversible, consequently necessitating many interventions for follow-up (10,11). In addition, children living in areas with high fluoride are five times more likely to have a low IQ compared to those residing in areas with low fluoride levels (9). Therefore, before consumption, water should be de-fluoridated to meet the standard range recommended by the WHO (12).
Conventional methods for removing fluoride ions from water include chemical oxidation, membrane filtration, reverse osmosis, biological processes, chemical deposition, electrodialysis, advanced oxidation, and adsorption (13-17). The use of the ion exchange method is limited due to the regeneration of the resin waste disposal and the high cost of the resin. Using the membrane method requires a wastewater treatment method due to the high costs of operation, clogging, and generation of wastewater. Coagulation and flocculation produce significant amounts of sludge, and the inclusion of aluminum in coagulants has been linked to the onset of Alzheimer’s disease, posing a potential health hazard. Chemical deposition that relies on the application of calcium salts such as lime is hindered by the limited solubility of calcium hydroxide, thus impeding thorough fluoride removal from water reservoirs (18-20).
Carbon-based materials are still considered highly effective for removing organic and mineral pollutants (21,22). Activated carbon (AC) can be prepared from various waste products. The biggest advantage of using plant residues to produce AC nanoparticles is the low cost of materials capable of being converted into AC. On the other hand, these materials are effective absorbents for all kinds of pollutants. To save the amount of these materials and solve the problem of the smallness of carbon nanoparticle absorption pores, intensifying factors such as magnetization of these materials can be used, which leads to better and more economical results (23).
Ionic liquids, categorized as organic compounds, have numerous unique physicochemical properties, including lower toxicity, high stability, and negligible vapor pressure (24). Hence, to use the aforementioned potential, a new material was created through the alteration of the magnetic activated carbon (MAC) surface with an ionic liquid (IL), resulting in an ionic liquid-modified magnetic activated carbon (IL@mAC) nanocomposite. This nanocomposite was utilized in fluoride elimination from water. Consequently, the objective of this study was to fabricate an IL@mAC nanocomposite for fluoride removal, while also analyzing the impact of operational factors such as pH, IL@mAC nanocomposite dosage, contact duration, and fluoride concentration in aqueous solutions through modeling employing the response surface methodology (RSM).
2. Methods
2.1. Preparation of the Ionic Liquid-modified Magnetic Activated Carbon Nanocomposite
The preparation of nonabsorbent followed the method presented in similar articles (25,26). In this study, carbon was obtained from the acacia plant leaves, which were collected, washed, and dried. Then, the dried leaves were passed through 40 and 50-mesh sieves and heated in an oven at 600 °C for one hour. The obtained black powder was oxidized using 0.1 M hydrochloric acid for 24 hours and repeatedly washed with double distilled water.
The preparation of MAC involved dissolving AC powder in a 10% w/v FeCl3⋅6H2O alcoholic solution, followed by a 24-hour magnetization process. Subsequently, the MAC was dried at room temperature and then subjected to charring and ignition in a setup equipped with an electric heater, wire gauze, and outlets for gas exhaust and nitrogen inlet. The synthesis of IL@mAC involved modifying MAC with 1-vinyl-3-butylimidazolium hexafluorophosphate with varying weight ratios of MAC/IL/ACN (10/1/20, 10/2/20, and 10/3/20) in a mixture refluxed at 303 K for 50 minutes. The temperature was then raised to 355 K to remove ACN by evaporation. Subsequently, 0.5 g of the resulting product was combined with 0.5 g of azobisisobutyronitrile in a 30 mL EtOH solution and agitated at 120 rpm at 333 K. The final product (IL@mAC) was filtered, washed thrice with EtOH, labeled, and stored for future applications (26,27).
2.2. Experimental Procedure
Batch adsorption experiments were conducted to examine the adsorption behavior of fluoride using IL@mAC from aqueous solutions. The physical characteristics of the resulting substance were determined utilizing Fourier-transform infrared spectroscopy (FTIR), X-ray powder diffraction (XRD), and scanning electron microscopy (SEM). A fluoride stock solution (1000 mg/L) was prepared by dissolving 2.211 g of NaF in 1.0 L of deionized water, with varying concentrations obtained by diluting this stock solution. The conducted experiments examined pivotal parameters such as fluoride concentrations ranging from 10 to 50 mg/L, pH levels from 2.0 to 8.0, IL@mAC quantities from 0.01 to 0.1 mg, and contact times ranging from 15 to 100 minutes. These parameters were evaluated to determine their influence on fluoride removal during batch tests. pH adjustments were made by the addition of 1 M HCl and 1 M NaOH solutions, with the adsorbent being added to 100 mL of the fluoride-laden solution. This amalgamation was agitated at 180 rpm in a shaker at ambient temperatures ranging from 25 °C to 30 °C. The efficiency of fluoride removal and the extent of adsorption were quantitatively determined through a specific equation.
where CO and Ce are the initial and final fluoride concentrations, respectively.
The amount of fluoride adsorbed qe (mg/g) was determined using equation 2 (13).
2.3. Kinetic Models
Adsorption is a complex phenomenon typically involving a sequence comprising both diffusion into the pores and surface adsorption.
2.3.1. Pseudo-First-Order Kinetic Model
The Lagergren kinetic model is widely utilized in liquid-solid adsorption systems, employing the pseudo-first-order equation to describe the adsorption kinetics of a substance within an adsorbent particle through a differential equation (27-29).
In this differential equation, the presented data indicates that the adsorption capacity is directly related to the “space to equilibrium”, which is defined as the difference between the average concentration of the species in the adsorbed phase and the ultimate concentration of the phase adsorbed at equilibrium with the fluid phase. Initially, for a pristine particle, the average concentration of species in the adsorbed phase is zero, and the distance to equilibrium matches the final concentration of the adsorbed phase in equilibrium with the liquid phase. Over time, this distance diminishes until it vanishes upon reaching equilibrium. The disparity between the concentration of the final adsorbed phase in equilibrium with the liquid phase and the average concentration of species in the adsorbed phase is reduced to zero (28,30). The relationship is given by:
(Eq. 4)
where Qe is the amount of adsorbate in the adsorbent at equilibrium (mg/g), Qt is the amount of adsorbate in the adsorbent at time t (mg/g), K1 is the constant rate of Lagergren’s first order, and t is the contact time (25).
2.3.2. Pseudo--Second-Order Kinetic Model
Adsorption that takes place on two surface sites and exhibits pseudo-second-order kinetics can be described through the application of a second-order differential equation (Eq. 5) (31):
where Qe is the amount of adsorbate in the adsorbent at equilibrium (mg/g), Qt is the amount of adsorbate in the adsorbent at time t (mg/g), K2 is the constant rate of pseudo-second-order, and t is the contact time (25).
The mathematical equation of the pseudo-second-order kinetic model is (28):
2.4. Response Surface Methodology
The model was established using analysis of variance (ANOVA). The evaluation included the mean, standard deviation, coefficient of variation, and the agreement between the model and data for each response variable, as well as the explanatory coefficients R2, adjusted determination coefficient R2, and predicted explanatory coefficient R2. The adjusted coefficient of determination is a measure that accounts for supplementary variables within the model and functions as a tool for assessing its fit. Conversely, the predicted coefficient of determination measures the predictive capability of the regression model for new data points, preventing an overestimation beyond the model’s values (32). The significance of the model and the influence of individual parameters were determined using the P value and F-value (33). A P value lower than 0.05 indicates significance, whereas a value below 0.0001 denotes a substantial impact of the parameter. Conversely, a higher F-value for a particular parameter signifies its greater influence in the process.
RSM was utilized to explore the interplay among various factors such as pH, adsorbent dosage, contact time, and fluoride concentrations to optimize the removal conditions for fluoride through adsorption. Consequently, 30 experiments were devised using Design Expert Software (version 7.0.0). These factors were categorized into three levels ( + 1, 0, -1) as outlined in Table 1. The quadratic equation illustrates the relationships between the dependent and independent variables, where Y represents the response variable (fluoride removal efficiency).
Table 1.
Levels of the Independent Test Variables
|
Code
|
Name
|
Units
|
Low Actual
|
Mean
|
High Actual
|
|
|
|
|
-1 |
0 |
1 |
| A |
Concentration |
mg/L |
10 |
30 |
50 |
| B |
Time |
min |
15 |
57.5 |
100 |
| C |
pH |
|
2 |
5 |
8 |
| D |
Dose |
mg/L |
0.01 |
0.06 |
0.1 |
Y= α0 + α1A+ α2B+ α3C+ α4D+ α11A2 + α22B2 + α33C2 + α44D2 + α12AB + α13AC+ α14AD+ α23BC+ α24BD+ α 34CD
where α0 denotes the constant factor, while α4, α3, α2, and α1 signify the correlation coefficients of linear factors. In addition, α44, α33, α22, and α11 indicate the correlation coefficients of second-order factors. Lastly, α34, α24, α23, α14, α13, and α12 demonstrate the correlation coefficients of interactive factors (13).
3. Results and Discussion
3.1. Characterization of the Ionic Liquid-Modified Magnetic Activated Carbon
To assess the purity and crystalline characteristics of AC, the XRD spectrum of AC was acquired (Fig. 1) and compared with the reference XRD spectrum (Card No. 926-91) provided by the Joint Powder Diffraction Standards Committee (JCPDS). The obtained XRD pattern exhibits a high level of agreement with the standard AC. The scanning electron microscope images of AC are illustrated in Figs. 2a and 2b. The morphology of AC displays a rugged and permeable surface. This porous nature of the fabricated specimen enhances its capacity to absorb contaminants from an aqueous environment (34).
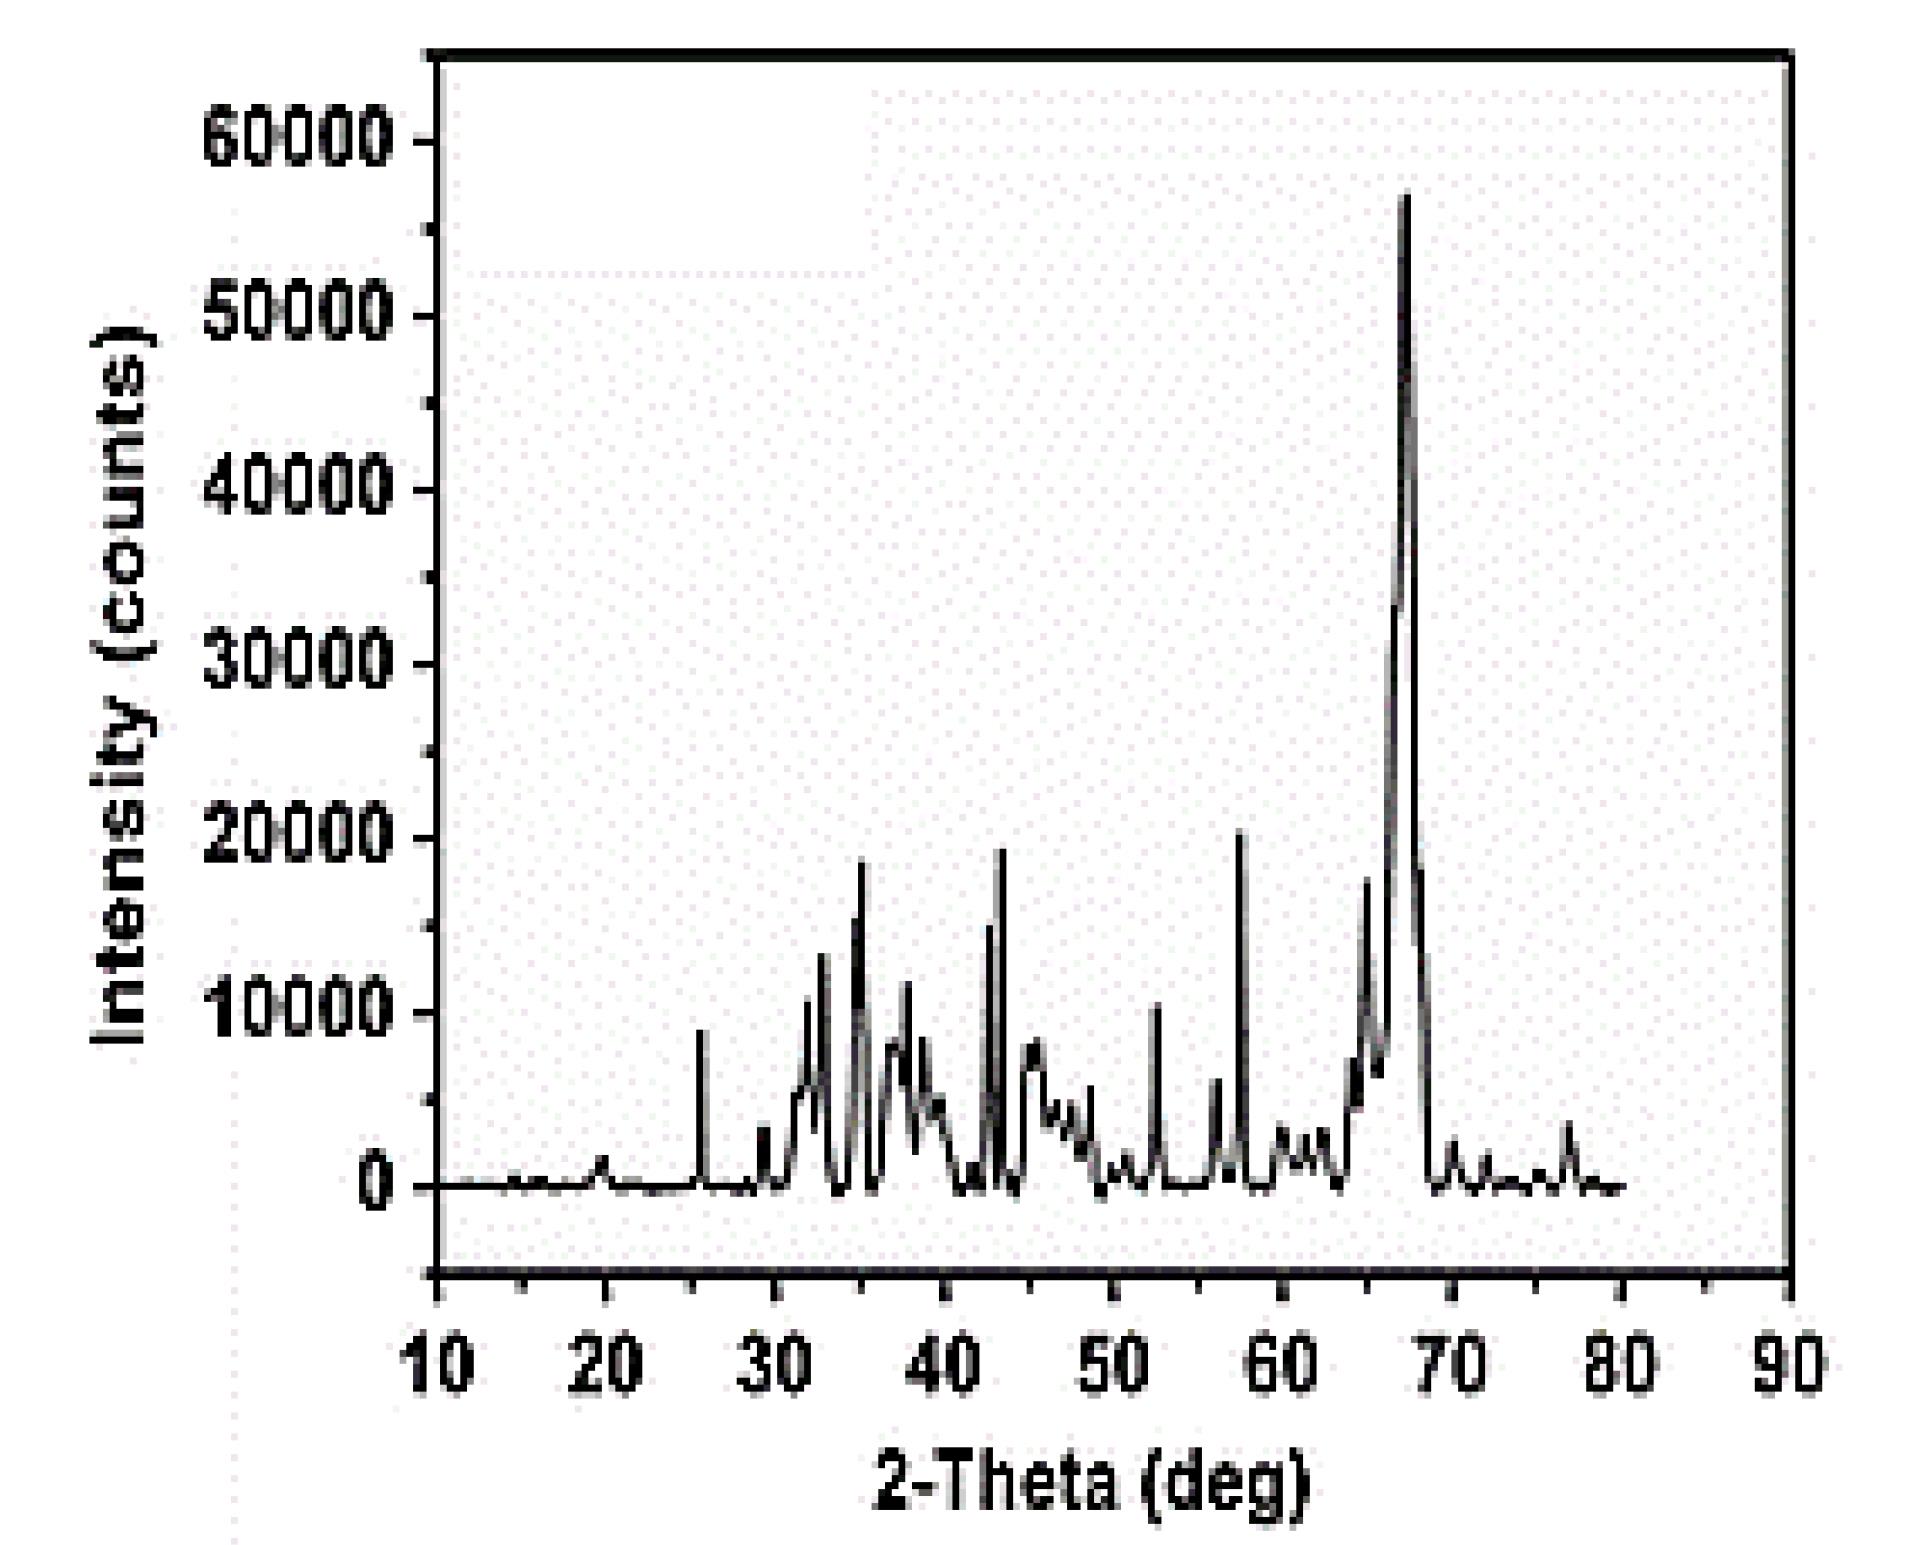
Fig. 1.
X-Ray Diffraction Spectrum of Activated Carbon
.
X-Ray Diffraction Spectrum of Activated Carbon
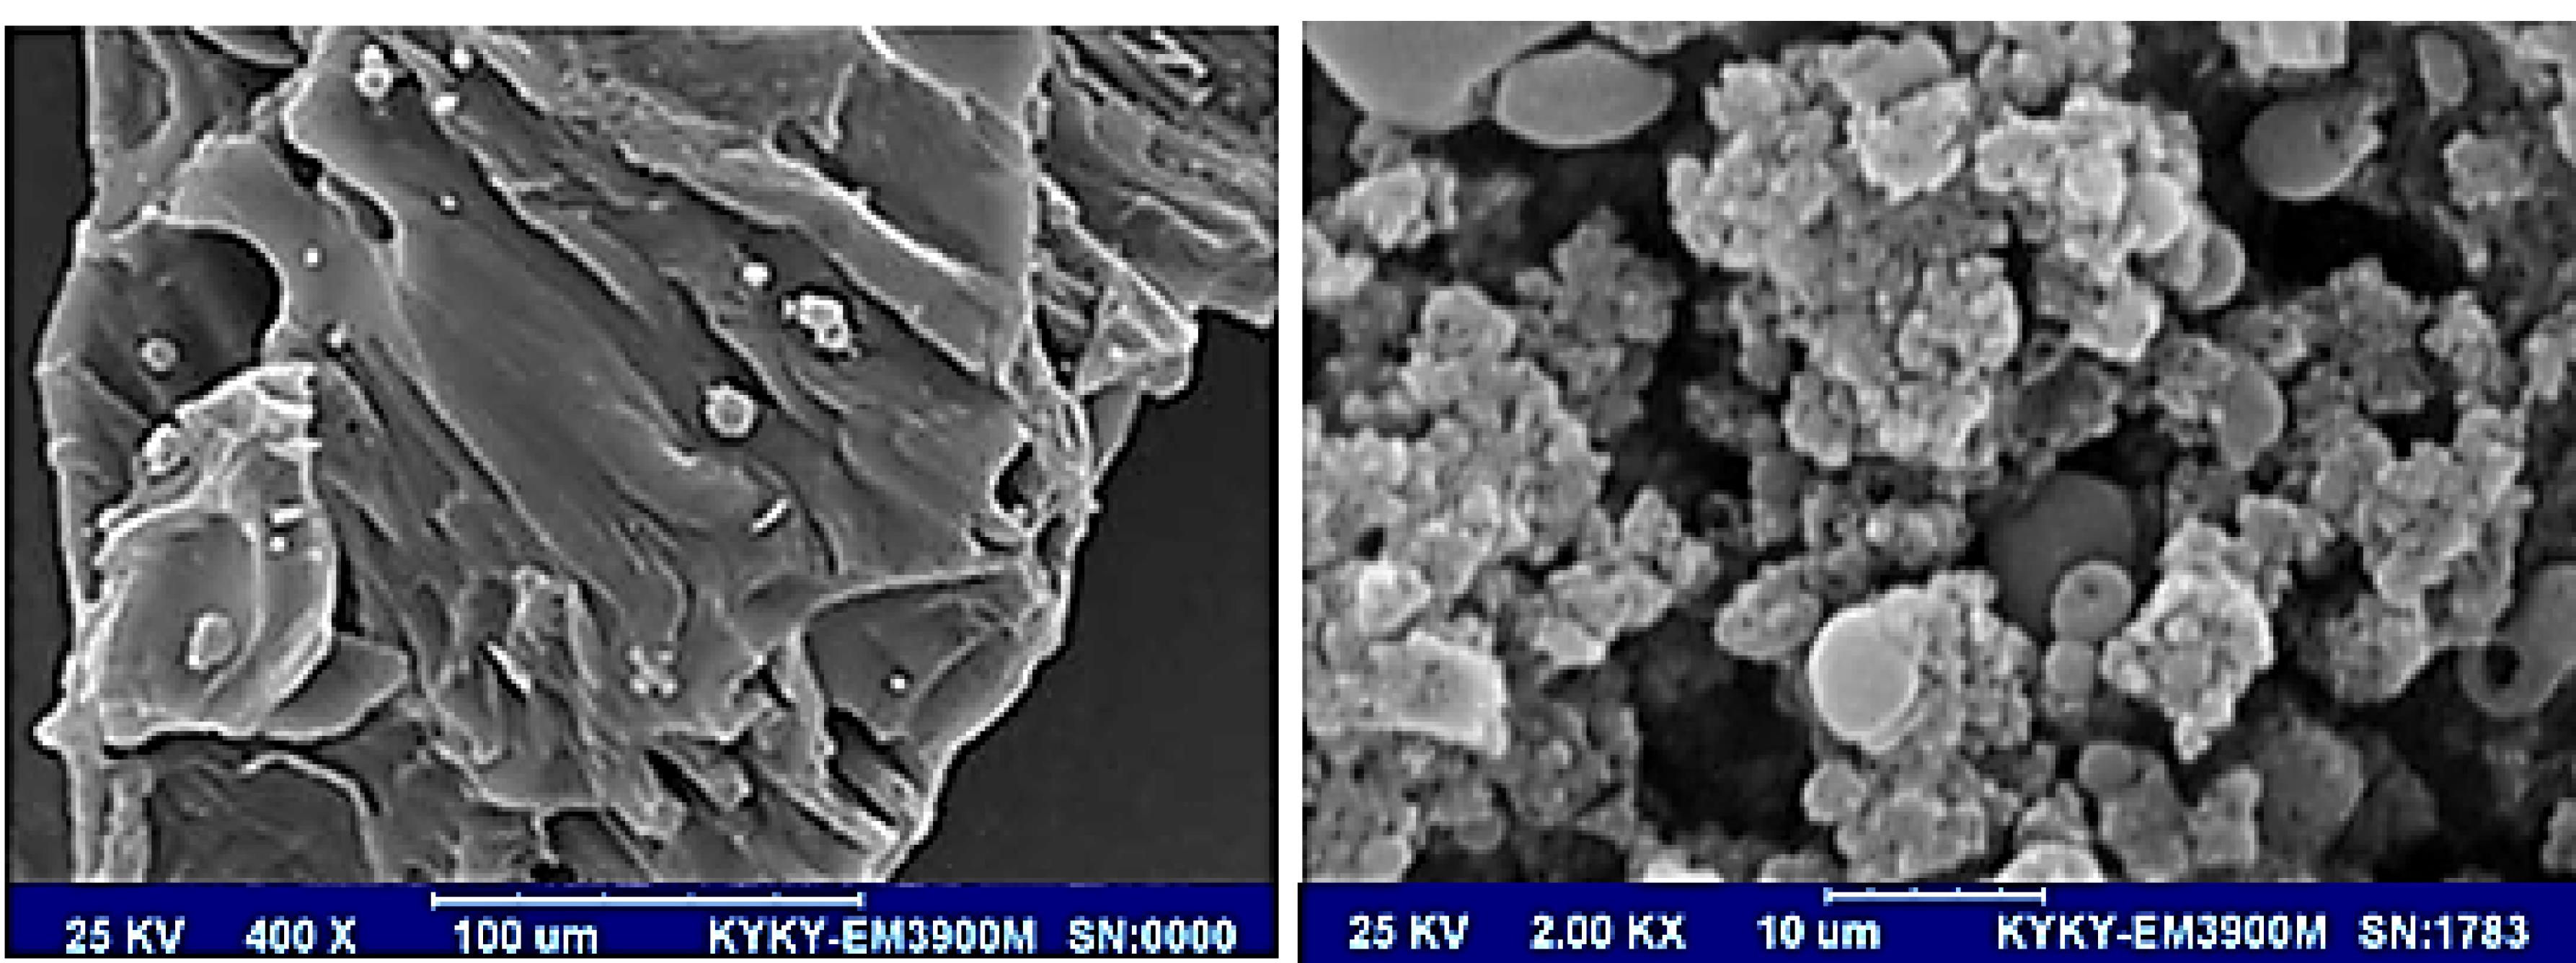
Fig. 2.
Scanning Electron Microscope Images of Activated carbon
.
Scanning Electron Microscope Images of Activated carbon
The FTIR spectrum of the as-synthesized AC was recorded, as depicted in Fig. 3. The presence of a peak at 1039 cm-1 corresponds to the -OH functional group. A distinct peak is identified at 3700 cm-1. Vibration modes within the range of 1200 cm−1 to 2100 cm−1 are attributed to the symmetric and asymmetric stretching vibrations of C–H, while the peak at 1500 cm-1 is linked to the C≡N stretching vibration. Furthermore, the peak at 2800 cm−1 corresponds to the vibration of the hetero aromatic C-H bond, and the C-N vibration is evident at 2100 cm-1. The peak observed at 1039 cm-1 in the FTIR spectrum indicates the tensile band associated with the amide group.
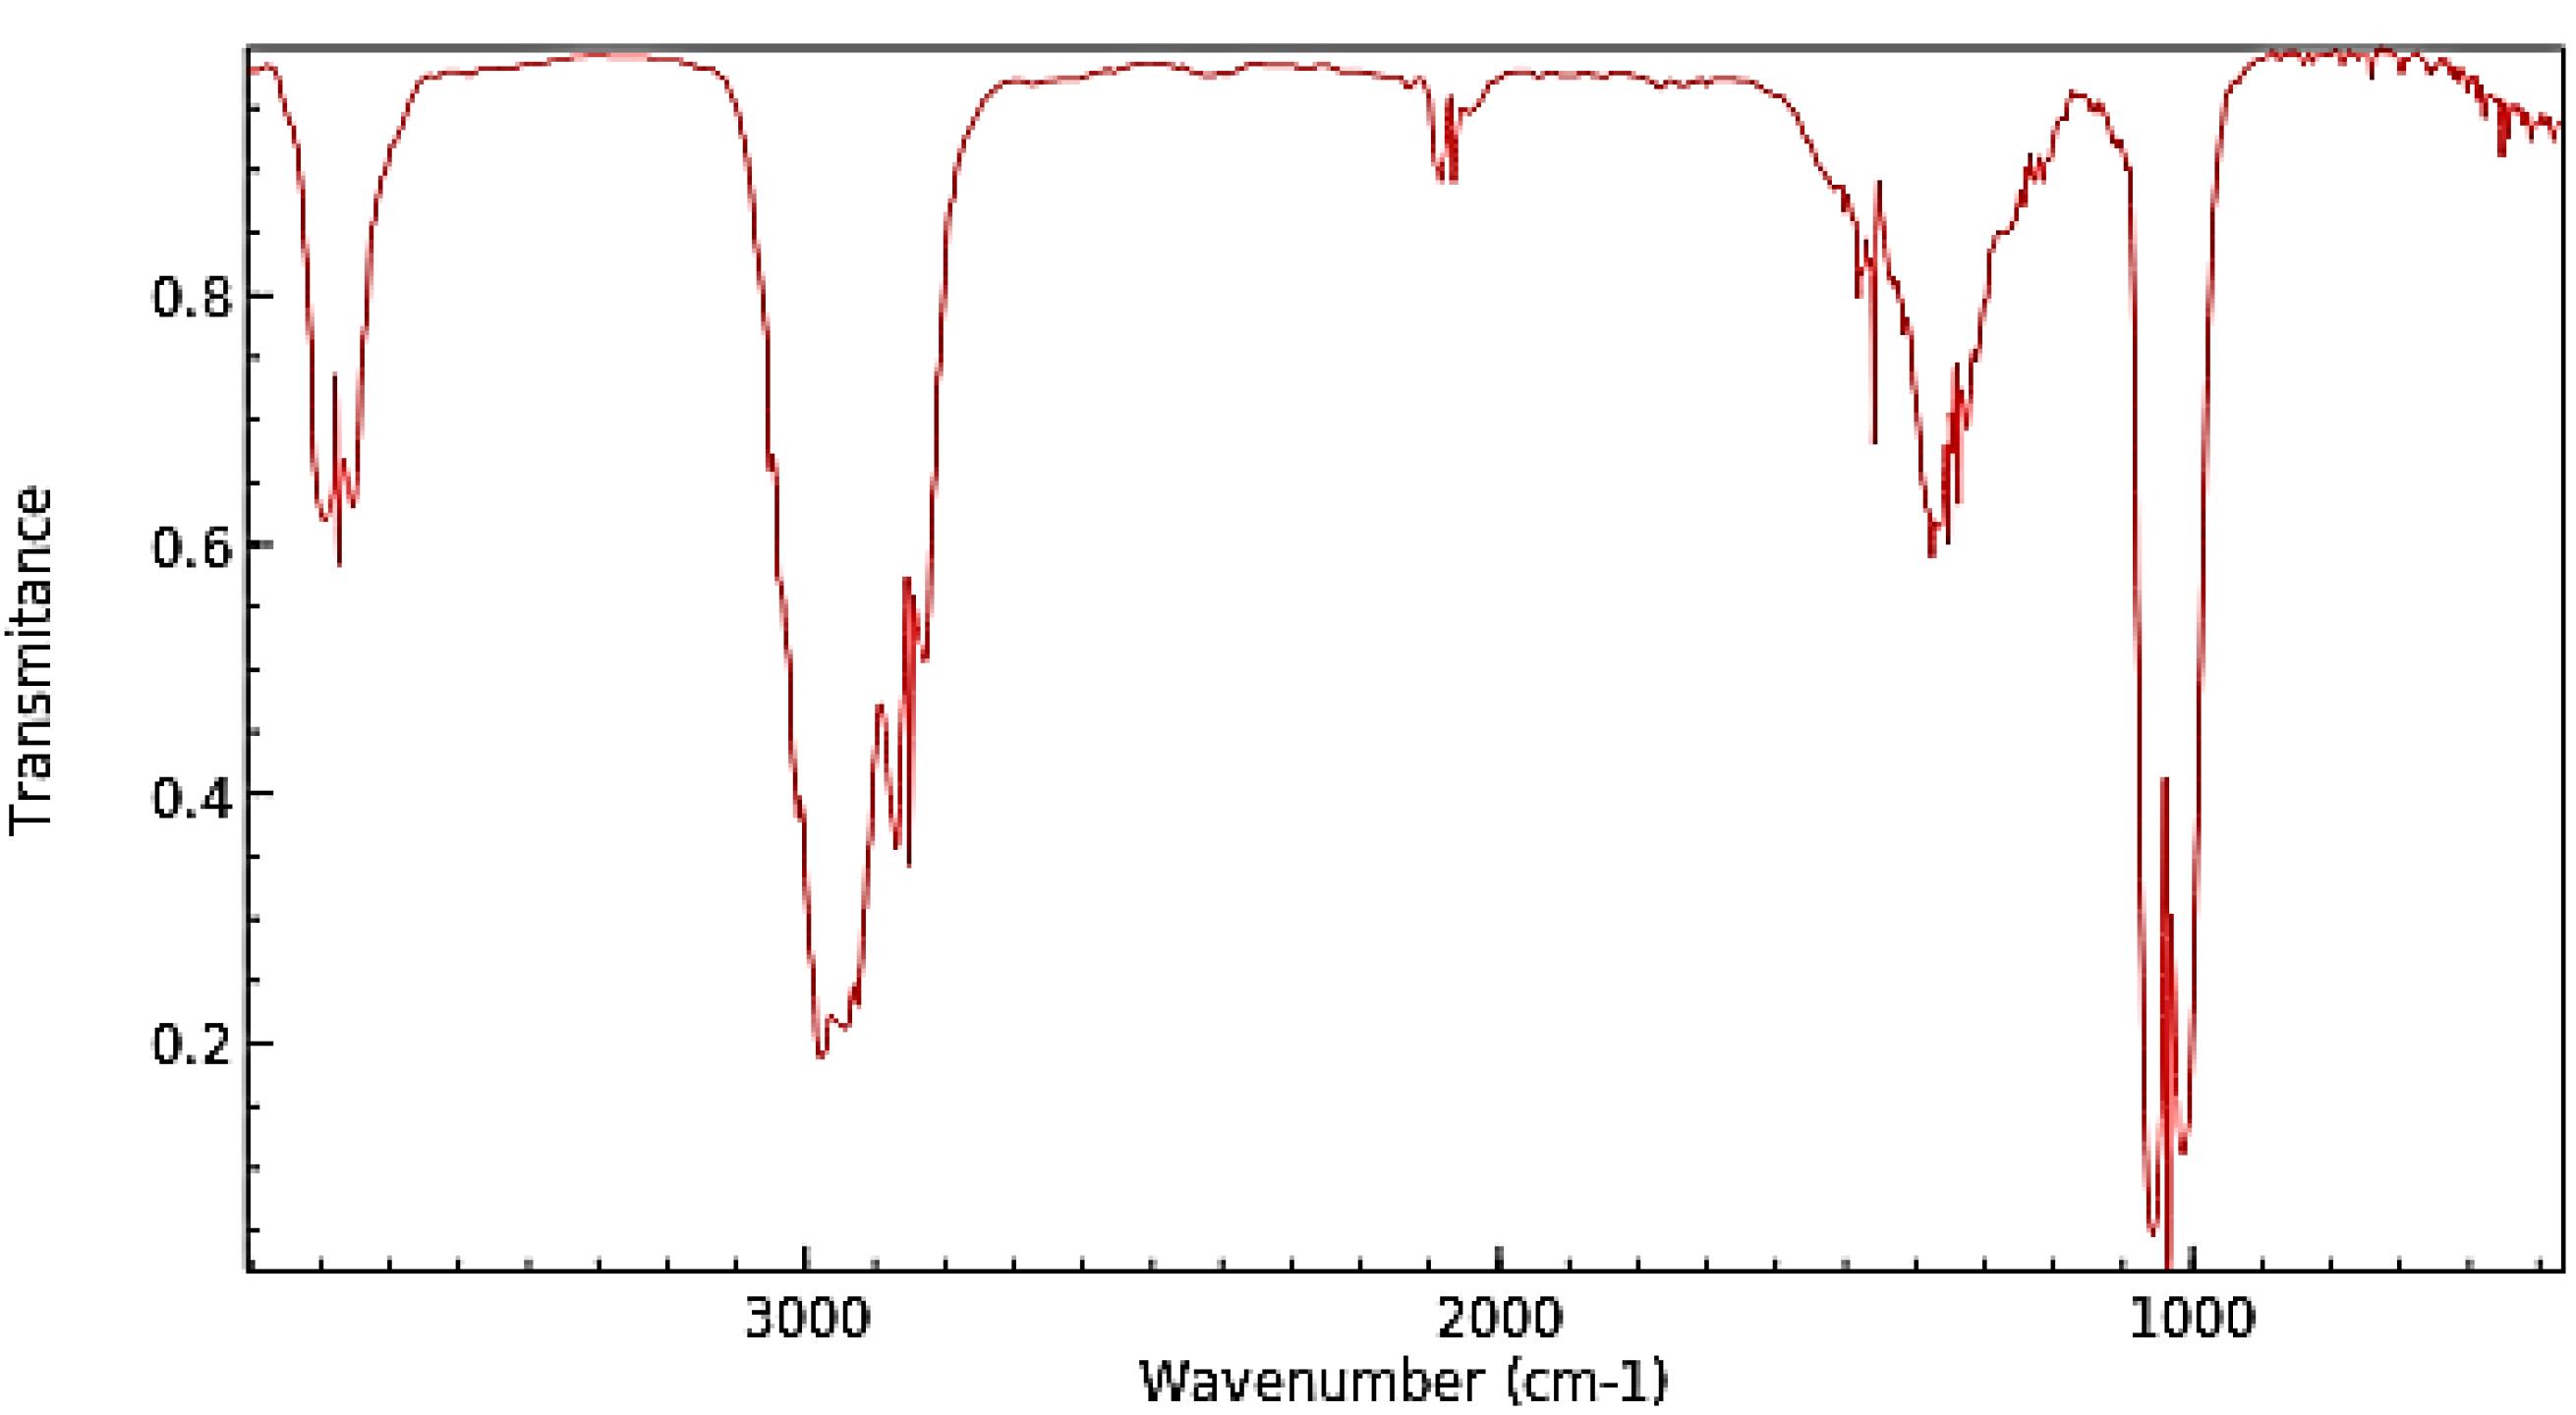
Fig. 3.
Fourier-Transform Infrared Spectrum of the as-synthesized Activated carbon
.
Fourier-Transform Infrared Spectrum of the as-synthesized Activated carbon
3.2. Response Surface Methodology Analysis
The proposed tests and results of fluoride removal percentage are presented in Table 2.
Table 2.
Experimental and Predicted Efficiency for the Adsorption of Fluoride
|
Run
|
Concentration
|
Time
|
pH
|
Dose g/L
|
Fluoride Removal (%)
|
| 1 |
50 |
100 |
8 |
0.01 |
79.692 |
| 2 |
10 |
15 |
8 |
0.1 |
52.538 |
| 3 |
30 |
100 |
5 |
0.06 |
55.897 |
| 4 |
50 |
57.5 |
5 |
0.06 |
75.564 |
| 5 |
30 |
57.5 |
5 |
0.1 |
71.282 |
| 6 |
10 |
15 |
2 |
0.1 |
29.23 |
| 7 |
50 |
100 |
8 |
0.1 |
82.769 |
| 8 |
30 |
57.5 |
5 |
0.06 |
68.461 |
| 9 |
50 |
15 |
8 |
0.01 |
81.23 |
| 10 |
10 |
57.5 |
5 |
0.06 |
23.682 |
| 11 |
30 |
57.5 |
5 |
0.06 |
66.892 |
| 12 |
10 |
15 |
8 |
0.01 |
44.615 |
| 13 |
30 |
57.5 |
5 |
0.01 |
61.025 |
| 14 |
10 |
100 |
8 |
0.01 |
36.923 |
| 15 |
30 |
57.5 |
5 |
0.06 |
66.153 |
| 16 |
10 |
100 |
2 |
0.1 |
24.769 |
| 17 |
30 |
57.5 |
5 |
0.06 |
67.895 |
| 18 |
10 |
100 |
2 |
0.01 |
21.538 |
| 19 |
50 |
15 |
2 |
0.1 |
85.846 |
| 20 |
50 |
100 |
2 |
0.01 |
70.769 |
| 21 |
50 |
15 |
2 |
0.01 |
75.07306 |
| 22 |
30 |
15 |
5 |
0.06 |
68.298 |
| 23 |
30 |
57.5 |
5 |
0.06 |
66.58 |
| 24 |
50 |
15 |
8 |
0.1 |
88.153 |
| 25 |
50 |
100 |
2 |
0.1 |
78.153 |
| 26 |
30 |
57.5 |
2 |
0.06 |
66.152 |
| 27 |
10 |
100 |
8 |
0.1 |
52.307 |
| 28 |
10 |
15 |
2 |
0.01 |
22.769 |
| 29 |
30 |
57.5 |
5 |
0.06 |
67.012 |
| 30 |
30 |
57.5 |
8 |
0.06 |
82.958 |
The final equation in terms of coded factors is given by:
Removal efficiency (%) = + 66.19 + 22.72 A -2.50 B + 7.05 C + 3.97 D -0.33 AB -4.13 AC -0.30 AD + 0.18 BC -0.19 BD + 0.34 CD-15.59A2 -3.11 B2+ 9.34 C2+ 0.94 D2
where R1 is the response in terms of removal of fluoride (%), A is the concertation of fluoride (h), B is the time, C is pH, and D is the dose. The statistical parameters, viz R2, R2Adj, and R2Pred were obtained as 0.9751, 0.9527, and 0.8048, respectively.
To evaluate the importance and suitability of the acquired model, the ANOVA technique was employed. The outcomes of ANOVA are displayed in Table 3. The R2 value estimated for fluoride removal was 0.8048, indicating a coherent relationship with R2Adj (0.9527). Consequently, a strong correspondence was observed between the anticipated values of the model and the experimental findings. The significance of the model terms for fluoride removal is evident through Prob > F values below 0.05. With a P value below 0.05, it is affirmed that the proposed model is capable of accurately forecasting experimental outcomes. The results from the second-order regression model reveal a highly significant second-order model, with Fmodel = 95.04. The lack-of-fit evaluation contrasts the pure error with the residual error from duplicated design points. The lack-of-fit F-value of 0.0027 is considered significant given the P value being less than 0.05.
Table 3.
Analysis of Variance
|
Source
|
Sum of Squares
|
df
|
Mean Square
|
F
-value
|
P
Value
|
| Model |
11906.47 |
14 |
850.46 |
95.04 |
< 0.0001 |
| A-Fluoride concentration |
9287.85 |
1 |
9287.85 |
1037.93 |
< 0.0001 |
| B-Time |
112.18 |
1 |
112.18 |
12.54 |
0.0030 |
| C-pH |
894.45 |
1 |
894.45 |
99.96 |
< 0.0001 |
| D-Adsorbent |
283.32 |
1 |
283.32 |
31.66 |
< 0.0001 |
| AB |
1.76 |
1 |
1.76 |
0.20 |
0.6639 |
| AC |
272.86 |
1 |
272.86 |
30.49 |
< 0.0001 |
| AD |
1.47 |
1 |
1.47 |
0.16 |
0.6914 |
| BC |
0.51 |
1 |
0.51 |
0.056 |
0.8153 |
| BD |
0.56 |
1 |
0.56 |
0.063 |
0.8052 |
| CD |
1.86 |
1 |
1.86 |
0.21 |
0.6548 |
| A2 |
629.49 |
1 |
629.49 |
70.35 |
< 0.0001 |
| B2 |
25.10 |
1 |
25.10 |
2.81 |
0.1147 |
| C2 |
226.25 |
1 |
226.25 |
25.28 |
0.0001 |
| D2 |
2.31 |
1 |
2.31 |
0.26 |
0.6191 |
| Residual |
134.23 |
15 |
8.95 |
|
|
| Lack of fit |
130.55 |
10 |
13.06 |
|
0.0027 |
| Pure error |
3.68 |
5 |
0.74 |
17.75 |
|
| Cor Total |
16578.72 |
29 |
8.95 |
|
|
Note. df: Degree of freedom.
According to the observable distributions illustrated in Fig. 4, the residuals exhibit a normal distribution characterized by constant variance and a mean of zero. Furthermore, the residuals demonstrate independence, indicating the completion of experimental analysis and model utilization. A normal probability plot effectively illustrates the normal distribution of residuals, as denoted by the alignment of data points on a linear trajectory. Despite the typical nature of normally distributed data, a certain degree of dispersion is still observable, suggesting a minor deviation in residual distribution. Nevertheless, it is reasonable to presume that the distribution remains normal (35).
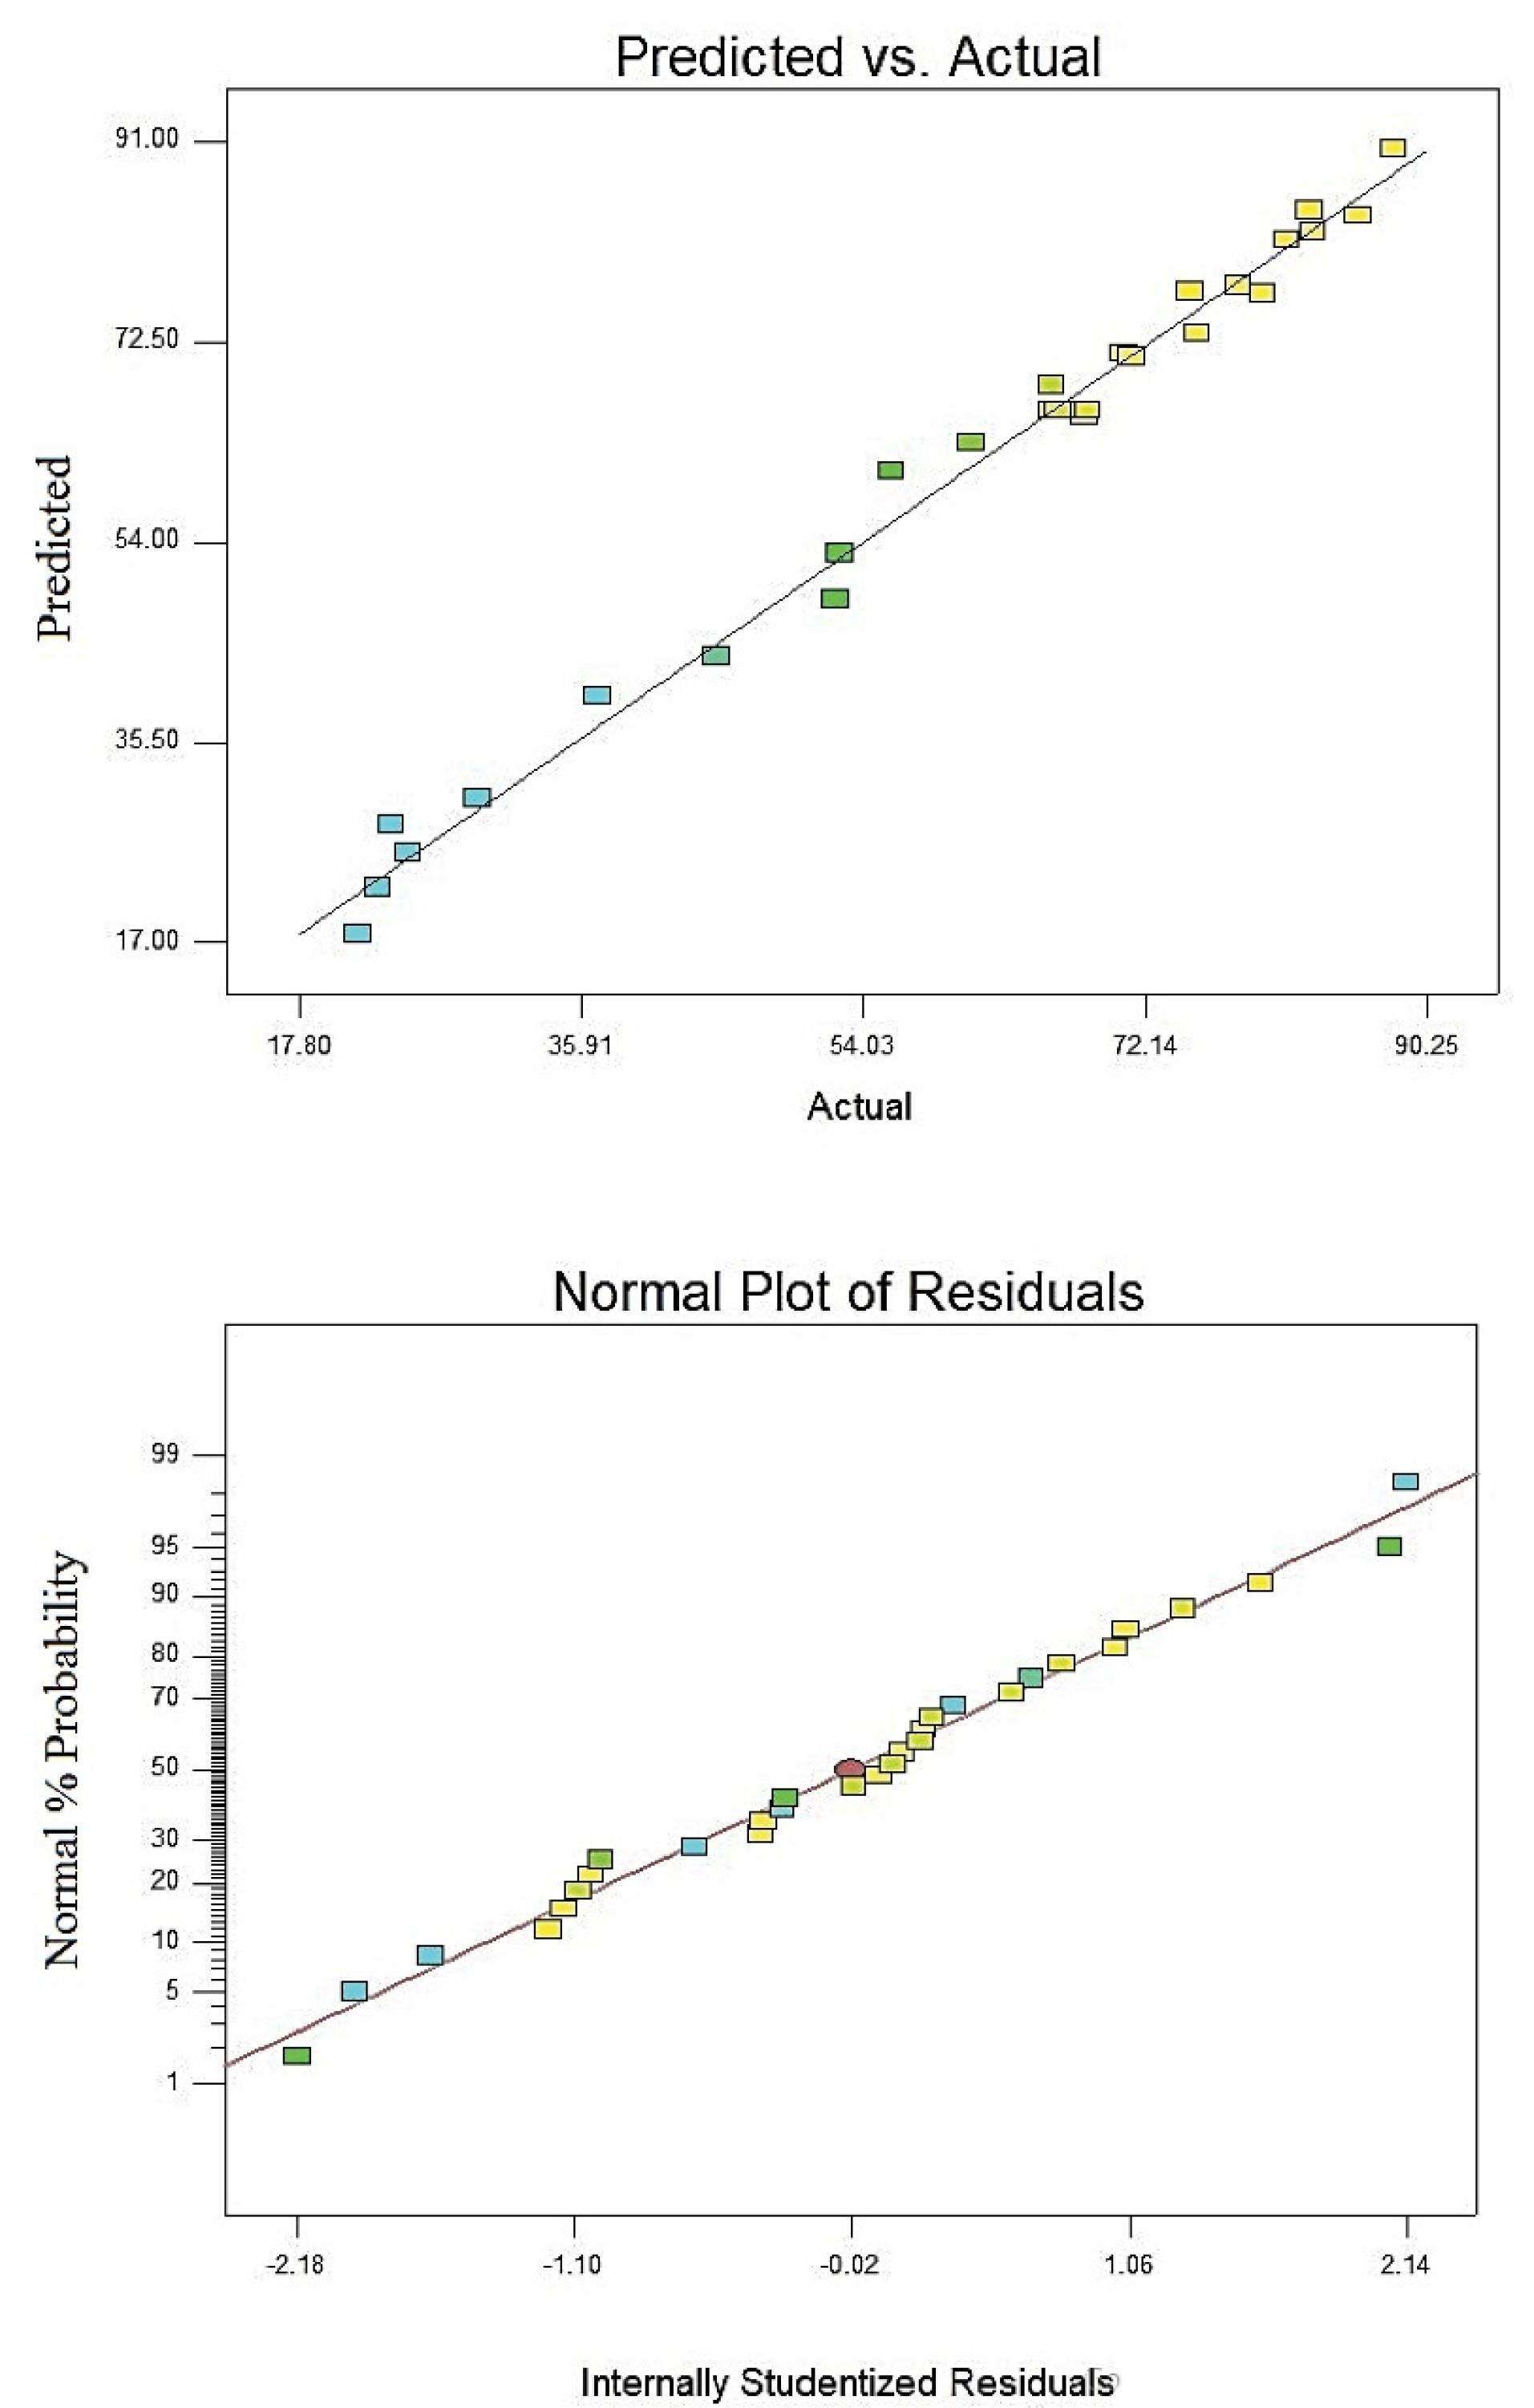
Fig. 4.
Studentized Residuals and Normal Probability Residuals for Defluorination (%)
.
Studentized Residuals and Normal Probability Residuals for Defluorination (%)
3.3. Impact of Interaction Variables
The combined impacts of fluoride removal process parameters were explored through three-dimensional diagrams, facilitating the comprehension of interactive effects. These effects were examined by manipulating two factors while maintaining other variables at constant levels. The estimation of the impacts of the investigated parameters and their interplay on the elimination percentage is delineated in Fig. 5. Crimson data points denote that design points surpassed the anticipated value.
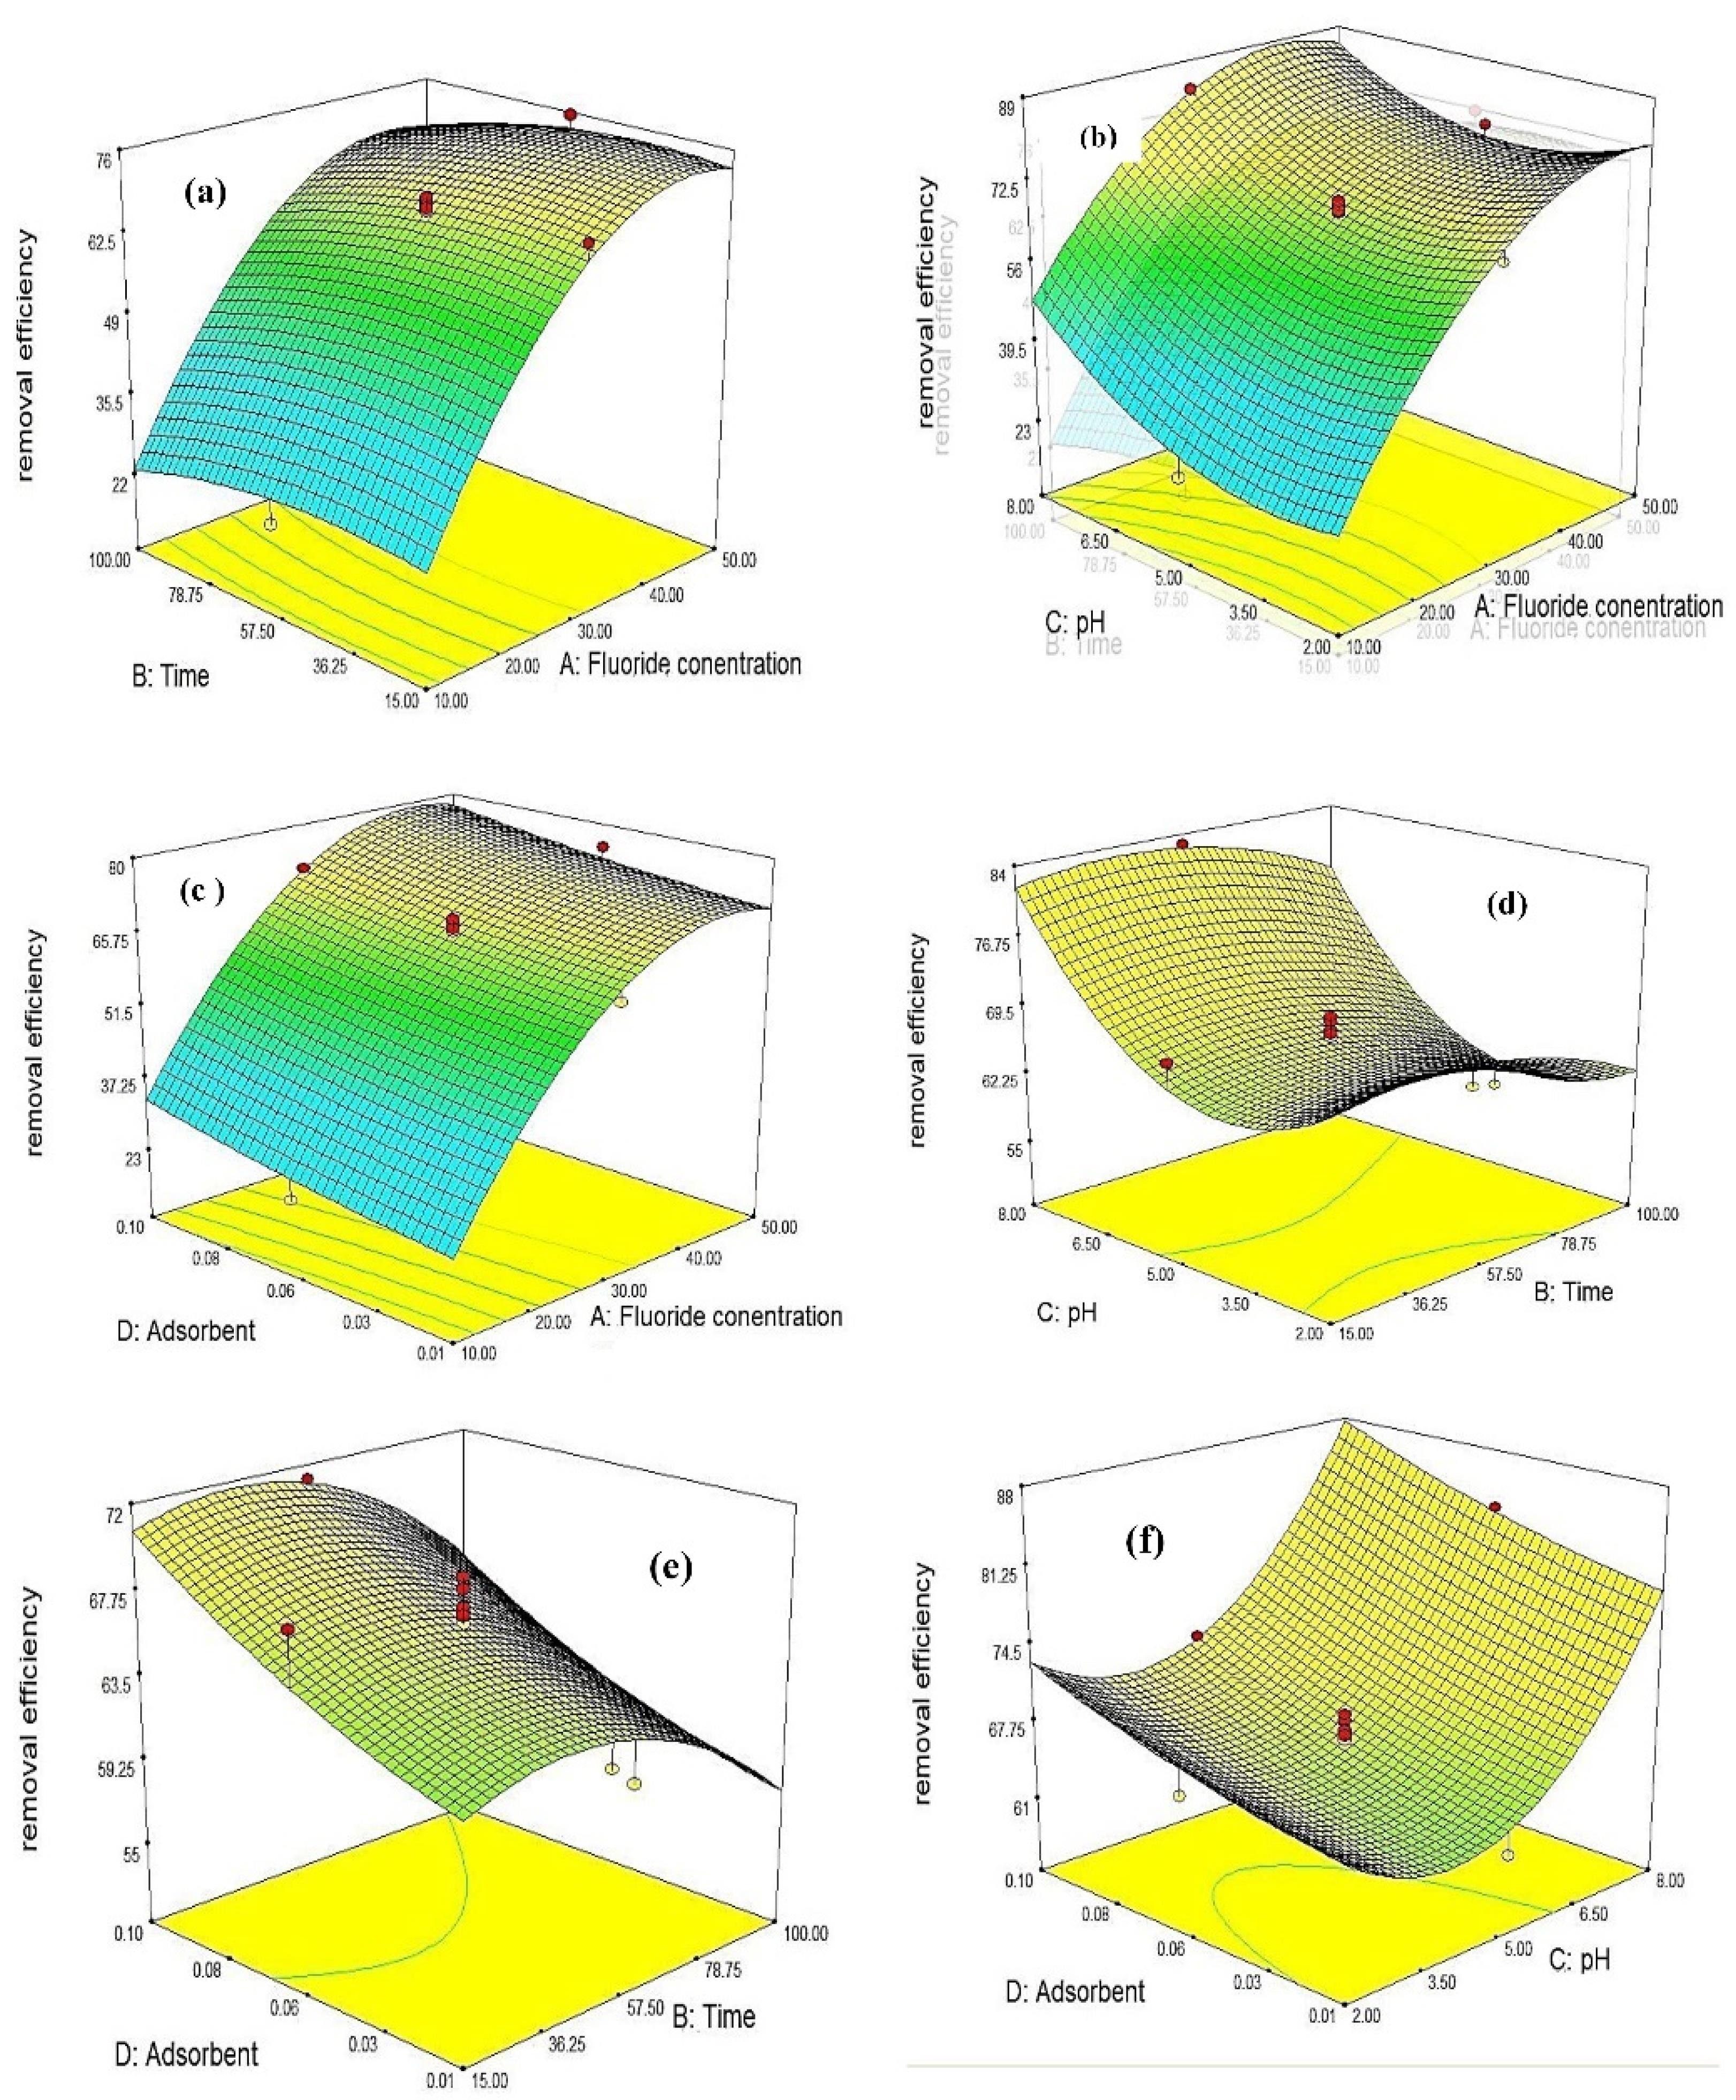
Fig. 5.
3D Surface Plots of the Interactive Effects on Fluoride Removal Efficiency by IL@mAC Nanocomposite. Note. IL@mAC: Ionic liquid-modified magnetic activated carbon. The 3D surface plots in Fig. 5 illustrate the interactive effects on fluoride removal efficiency by the IL@mAC nanocomposite as a Function of a) Time and fluoride concentration (mg/L)with adsorbent dose (mg/L), b) pH and fluoride concentration (mg/L), c) pH and time (25), d) Dose (mg/L) and concentration (mg/L), e) Dose (mg/L) and time (25), f) Adsorbent dose (mg/L) and pH
.
3D Surface Plots of the Interactive Effects on Fluoride Removal Efficiency by IL@mAC Nanocomposite. Note. IL@mAC: Ionic liquid-modified magnetic activated carbon. The 3D surface plots in Fig. 5 illustrate the interactive effects on fluoride removal efficiency by the IL@mAC nanocomposite as a Function of a) Time and fluoride concentration (mg/L)with adsorbent dose (mg/L), b) pH and fluoride concentration (mg/L), c) pH and time (25), d) Dose (mg/L) and concentration (mg/L), e) Dose (mg/L) and time (25), f) Adsorbent dose (mg/L) and pH
The pH level of the solution is a critical element in numerous adsorption and oxidation mechanisms. Research indicates that the pH of the medium influences the adsorption process, depending on factors such as the pollutant type, the adsorbent’s point of zero charges (pHZPC), the catalyst’s surface charge, ionization conditions, an acid constant value (pKa), and essentially, the electrostatic interaction between the catalyst’s surface and the pollutant (36). The effects of fluoride concentration, contact duration, adsorbent quantity, and pH on fluoride removal are depicted in Fig. 5. Increasing the pH from 2 to 5 leads to enhanced removal efficiency, but the efficiency diminishes at higher pH levels (alkaline). Prolonging the contact duration at elevated levels does not significantly impact adsorption. These outcomes mirror earlier research (19).
This correlation indicates the ionization of HF in solution at low pH. At extremely low pH levels, HF is minimally ionized in solution, with a pKa of 3.2, leading to reduced fluoride absorption capacity (37). The low percentage of fluoride elimination in highly acidic solution conditions may be attributed to the potential formation of weak fluoride acids, limiting the free fluoride ion concentration available for adsorption. In an alkaline pH environment, OH- ions compete with fluoride anions for adsorption, occupying some absorbent sites and thereby diminishing fluoride absorption (38). Additionally, in alkaline pH, hydroxide and fluorine ions compete for adsorption by the adsorbent (14).
The removal of fluoride from the aqueous phase using IL@mAC nanocomposite was scrutinized across various adsorbent dosages ranging from 0.01 to 0.1 mg/L. The outcomes revealed a substantial increase in fluoride removal efficiency with escalating IL@mAC dosage. This adsorption behavior underscores the presence of numerous binding sites upon increasing the adsorbent quantity (39). Optimal fluoride removal was observed at an adsorbent dose of 0.1 mg/L for IL@mAC nanocomposite. Beyond this dosage, the adsorption percentage remains relatively steady, indicating unsaturated adsorption sites due to overcrowding of adsorbent particles. Moreover, the adsorption capacity (Qe) decreased with rising IL@mAC dosage (40).
A prevalent analysis indicated that the adsorption potential of the adsorbent tends to rise with an upsurge in initial fluoride concentration. Initially, fluoride elimination by IL@mAC nanocomposite intensified significantly due to the abundant activation sites on the adsorbent, which eventually reached saturation, establishing equilibrium between adsorption and desorption or reaching a saturation point (41). The elimination rate or the adsorption percentage initially ascends to the point of equilibrium, followed by a gradual decrease in removal efficacy with no further adsorption taking place. By referring to Figs. 5e and 5c, one can readily comprehend this trend (42). The outcomes of the computations and the analysis of adsorption kinetics are detailed in Table 4, where the pseudo-second-order model has demonstrated the highest correlation coefficient (R2 = 0.998), establishing it as the most appropriate model.
Table 4.
Constants of Kinetic Models for Adsorption of Fluoride on the IL@mAC Nanocomposite
|
Kinetic Models
|
Equation
|
Plots
|
|
Parameter
|
| Lagergren |
|
|
Kf (1/min) |
0.3 |
|
|
|
|
qe (mg/g) |
1.7 |
|
|
|
|
R2 |
0.89 |
| HO |
|
|
K2 (g/mg min) |
6.064 |
|
|
|
|
qe (mg/g) |
30.65 |
|
|
|
|
R2 |
0.998 |
Note. IL@mAC: Ionic liquid-modified magnetic activated carbon.
Conclusion
The influence of factors such as pH, fluoride concentration, IL@mAC nanocomposite dosage, and time on fluoride adsorption by IL@mAC can be effectively explained using RSM. Optimal values for the factors affecting fluoride adsorption in the liquid phase were determined as 50 mg/L for initial fluoride concentration, pH 5 for the solution, and 0.1 mg/L for the IL@mAC dosage. The coefficient of determination, (R2 = 0.8048) and the adjusted ((R2 = 0.9527) values indicate that the procedure can be precisely elucidated using RSM. The fabricated IL@mAC has been effectively employed for the adsorption of fluoride from liquid solutions.
Acknowledgements
The authors thank Zabol University of Medical Sciences for their support in conducting this research.
Competing Interests
None.
Ethical Approval
This work was approved by the ethical committee of Zabol University of Medical Sciences (Ethics code: IR.ZBMU.REC.1399.154).
Funding
This work was supported by a research grant of Zabol University of Medical Sciences.
References
- Alhassan SI, He Y, Huang L, Wu B, Yan L, Deng H. A review on fluoride adsorption using modified bauxite: surface modification and sorption mechanisms perspectives. J Environ Chem Eng 2020; 8(6):104532. doi: 10.1016/j.jece.2020.104532 [Crossref] [ Google Scholar]
- Mathur P, Choudhary S, Bhatnagar P. Aloe vera protects against fluoride-induced teratogenic effects during pre- and postnatal development in mice. Environ Sci Pollut Res Int 2022; 29(42):63577-87. doi: 10.1007/s11356-022-20225-x [Crossref] [ Google Scholar]
- Naskar MK. Preparation of colloidal hydrated alumina modified NaA zeolite derived from rice husk ash for effective removal of fluoride ions from water medium. J Asian Ceram Soc 2020; 8(2):437-47. doi: 10.1080/21870764.2020.1749375 [Crossref] [ Google Scholar]
- Molla Mahmoudi M, Nasseri S, Mahvi AH, Dargahi A, Shokri Khubestani M, Salari M. Fluoride removal from aqueous solution by acid-treated clinoptilolite: isotherm and kinetic study. Desalin Water Treat 2019; 146:333-40. doi: 10.5004/dwt.2019.23625 [Crossref] [ Google Scholar]
- Ma W, Ya F, Wang R, Zhao Y. Fluoride removal from drinking water by adsorption using bone char as a biosorbent. International Journal of Environmental Technology and Management 2008; 9(1):59-69. doi: 10.1504/ijetm.2008.01786 [Crossref] [ Google Scholar]
- Kofa GP, Gomdje VH, Telegang C, Koungou SN. Removal of fluoride from water by adsorption onto fired clay pots: kinetics and equilibrium studies. J Appl Chem 2017; 2017(1):6254683. doi: 10.1155/2017/6254683 [Crossref] [ Google Scholar]
- Suneetha M, Sundar BS, Ravindhranath K. Removal of fluoride from polluted waters using active carbon derived from barks of Vitex negundo plant. J Anal Sci Technol 2015; 6(1):15. doi: 10.1186/s40543-014-0042-1 [Crossref] [ Google Scholar]
- Poorakbar Z, Mahvi AH, Sadeghi H, Vosoughi M, Mokhtari SA, Dargahi A. Evaluation of fluoride concentration at inlet and outlet household water treatment systems and bottled water distributive high consumption Ardabil city, Iran. J Chem Health Risks 2020; 10(4):327-35. doi: 10.22034/jchr.2020.1906134.1163 [Crossref] [ Google Scholar]
- Rajkumar S, Murugesh S, Sivasankar V, Darchen A, Msagati TA, Chaabane T. Low-cost fluoride adsorbents prepared from a renewable biowaste: syntheses, characterization and modeling studies. Arab J Chem 2019; 12(8):3004-17. doi: 10.1016/j.arabjc.2015.06.028 [Crossref] [ Google Scholar]
- Raghavan R, Bipin N, Abraham A. Prevalence of dental fluorosis and fluoride content of drinking water in rural areas of Malappuram district, Kerala. Int J Med Sci Public Health 2014; 3(1):27-30. doi: 10.5455/ijmsph.2013.200920132 [Crossref] [ Google Scholar]
- Rustagi N, Rathore AS, Meena JK, Chugh A, Pal R. Neglected health literacy undermining fluorosis control efforts: a pilot study among schoolchildren in an endemic village of rural Rajasthan, India. J Family Med Prim Care 2017; 6(3):533-7. doi: 10.4103/2249-4863.222017 [Crossref] [ Google Scholar]
- Shehu Z, Lamayi WD, Kwarson PS, Yirankinyuk FF. Isotherm and kinetic studies of flouride removal on activated carbon obtained from coconut shell. Innoriginal Int J Sci 2019; 6(2):1-4. [ Google Scholar]
- Tarlani Azar M, Leili M, Taherkhani F, Bhatnagar A. A comparative study for the removal of aniline from aqueous solutions using modified bentonite and activated carbon. Desalin Water Treat 2016; 57(51):24430-24443. doi: 10.1080/19443994.2016.1138890 [Crossref] [ Google Scholar]
- Vivek Vardhan CM, Srimurali M. Removal of fluoride from water using a novel sorbent lanthanum-impregnated bauxite. Springerplus 2016; 5(1):1426. doi: 10.1186/s40064-016-3112-6 [Crossref] [ Google Scholar]
- Biswas G, Dutta M, Dutta S, Adhikari K. A comparative study of removal of fluoride from contaminated water using shale collected from different coal mines in India. Environ Sci Pollut Res 2016; 23(10):9418-31. doi: 10.1007/s11356-015-5815-6 [Crossref] [ Google Scholar]
- Hasani K, Peyghami A, Moharrami A, Vosoughi M, Dargahi A. The efficacy of sono-electro-Fenton process for removal of cefixime antibiotic from aqueous solutions by response surface methodology (RSM) and evaluation of toxicity of effluent by microorganisms. Arab J Chem 2020; 13(7):6122-39. doi: 10.1016/j.arabjc.2020.05.012 [Crossref] [ Google Scholar]
- Zarei AA, Bazrafshan E, Mosafer J, Foroughi M, Khaksefidi R, Teimori Boghsani G. In situ chemical oxidation of tinidazole in aqueous media by heat-activated persulfate: kinetics, thermodynamic, and mineralization studies. Appl Water Sci 2024; 14(4):71. doi: 10.1007/s13201-024-02133-2 [Crossref] [ Google Scholar]
- Hosseini SS, Pasalari H, Yousefi N, Mahvi AH. Eggshell modified with alum as low-cost sorbent to removal of fluoride from aquatic environments: isotherm and kinetic studies. Desalin Water Treat 2019; 146:326-32. doi: 10.5004/dwt.2019.23595 [Crossref] [ Google Scholar]
- Mahvi AH, Rahdar A, Igwegbe CA, Rahdar S, Ahmadi S. Fluoride removal from aqueous solutions by zinc oxide nanoparticles. Fluoride 2020; 53(3 Pt 2):531-41. [ Google Scholar]
- Younas F, Mustafa A, Farooqi ZU, Wang X, Younas S, Mohy-Ud-Din W. Current and emerging adsorbent technologies for wastewater treatment: trends, limitations, and environmental implications. Water 2021; 13(2):215. doi: 10.3390/w13020215 [Crossref] [ Google Scholar]
- Ziaefar N, Khodaei S, Talat-Mehrabad J, Arjomandi Rad F. Evaluation of optimization removal of methyl orange from aqueous solutions with Ag, Co/TiO2 nano-particles by experimental design. J Environ Sci Technol 2020; 22(5):303-11. doi: 10.22034/jest.2021.26884.3584 [Crossref] [ Google Scholar]
- Zhang Z, Pang Q, Li M, Zheng H, Chen H, Chen K. Optimization of the condition for adsorption of gallic acid by Aspergillus oryzae mycelia using Box-Behnken design. Environ Sci Pollut Res Int 2015; 22(2):1085-94. doi: 10.1007/s11356-014-3409-3 [Crossref] [ Google Scholar]
- Wang X, Li N, Li J, Feng J, Ma Z, Xu Y. Fluoride removal from secondary effluent of the graphite industry using electrodialysis: optimization with response surface methodology. Front Environ Sci Eng 2019; 13(4):51. doi: 10.1007/s11783-019-1132-5 [Crossref] [ Google Scholar]
- Roy K, Kar S, Das RN. Understanding the Basics of QSAR for Applications in Pharmaceutical Sciences and Risk Assessment. Academic Press; 2015.
- Bazrafshan E, Zarei AA, Mohammadi L, Zafar MN, Foroughi M, Aman S. Efficient tetracycline removal from aqueous solutions using ionic liquid modified magnetic activated carbon (IL@mAC). J Environ Chem Eng 2021; 9(6):106570. doi: 10.1016/j.jece.2021.106570 [Crossref] [ Google Scholar]
- Dehghanifard E, Jonidi Jafari A, Rezae Kalantari R, Gholami M, Esrafili A. Photocatalytic removal of aniline from synthetic wastewater using ZnO nanoparticle under ultraviolet irradiation. Iran J Health Environ 2012; 5(2):167-78. [ Google Scholar]
- Benjelloun M, Miyah Y, Akdemir Evrendilek G, Zerrouq F, Lairini S. Recent advances in adsorption kinetic models: their application to dye types. Arab J Chem 2021; 14(4):103031. doi: 10.1016/j.arabjc.2021.103031 [Crossref] [ Google Scholar]
- Rodrigues AE, Silva CM. What’s wrong with Lagergreen pseudo first order model for adsorption kinetics?. Chem Eng J 2016; 306:1138-42. doi: 10.1016/j.cej.2016.08.055 [Crossref] [ Google Scholar]
- Afshin S, Rashtbari Y, Vosough M, Dargahi A, Fazlzadeh M, Behzad A. Application of Box–Behnken design for optimizing parameters of hexavalent chromium removal from aqueous solutions using Fe3O4 loaded on activated carbon prepared from alga: kinetics and equilibrium study. J Water Process Eng 2021; 42:102113. doi: 10.1016/j.jwpe.2021.102113 [Crossref] [ Google Scholar]
- Moussout H, Ahlafi H, Aazza M, Maghat H. Critical of linear and nonlinear equations of pseudo-first order and pseudo-second order kinetic models. Karbala Int J Mod Sci 2018; 4(2):244-54. doi: 10.1016/j.kijoms.2018.04.001 [Crossref] [ Google Scholar]
- Ezzati R, Ezzati S, Azizi M. Exact solution of the Langmuir rate equation: new insights into pseudo-first-order and pseudo-second-order kinetics models for adsorption. Vacuum 2024; 220:112790. doi: 10.1016/j.vacuum.2023.112790 [Crossref] [ Google Scholar]
- Bazrafshan E, Dahmardeh Z, Mohammadi L, Zafar MN, Dargahi A, Pirdadeh F. Synthesis of magnesium oxide nanoparticles and its application for photocatalytic removal of furfural from aqueous media: optimization using response surface methodology. Arab J Chem 2023; 16(8):104998. doi: 10.1016/j.arabjc.2023.104998 [Crossref] [ Google Scholar]
- Almasi A, Dargahi A, Mohammadi M, Azizi A, Karami A, Baniamerian F. Application of response surface methodology on cefixime removal from aqueous solution by ultrasonic/photooxidation. Int J Pharm Technol 2016; 8(3):16728-36. [ Google Scholar]
- Ghasemi Z, Younesi H, Zinatizadeh AA. Preparation, characterization and photocatalytic application of TiO2/Fe-ZSM-5 nanocomposite for the treatment of petroleum refinery wastewater: optimization of process parameters by response surface methodology. Chemosphere 2016; 159:552-64. doi: 10.1016/j.chemosphere.2016.06.058 [Crossref] [ Google Scholar]
- Amouei A, Asgharnia HA, Karimian K, Mahdavi Y, Balarak D, Ghasemi SM. Optimization of dye reactive orange 16 (RO16) adsorption by modified sunflower stem using response surface method from aqueous solutions. J Rafsanjan Univ Med Sci 2016;14(10):813-26. [Persian].
- Dehghani MH, Farhang M, Alimohammadi M, Afsharnia M, McKay G. Adsorptive removal of fluoride from water by activated carbon derived from CaCl2-modified Crocus sativus leaves: equilibrium adsorption isotherms, optimization, and influence of anions. Chem Eng Commun 2018; 205(7):955-65. doi: 10.1080/00986445.2018.1423969 [Crossref] [ Google Scholar]
- Ashrafi SD, Kamani H, Soheil Arezomand H, Yousefi N, Mahvi AH. Optimization and modeling of process variables for adsorption of basic blue 41 on NaOH-modified rice husk using response surface methodology. Desalin Water Treat 2016; 57(30):14051-9. doi: 10.1080/19443994.2015.1060903 [Crossref] [ Google Scholar]
- Rahdar A, Ahmadi S, Fu J, Rahdar S. Iron oxide nanoparticle preparation and its use for the removal of fluoride from aqueous solution: application of isotherm, kinetic, and thermodynamics. Desalin Water Treat 2019; 137:174-82. doi: 10.5004/dwt.2019.23350 [Crossref] [ Google Scholar]
- Taha AA, Shreadah MA, Ahmed AM, Heiba HF. Multi-component adsorption of Pb(II), Cd(II), and Ni(II) onto Egyptian Na-activated bentonite; equilibrium, kinetics, thermodynamics, and application for seawater desalination. J Environ Chem Eng 2016; 4(1):1166-80. doi: 10.1016/j.jece.2016.01.025 [Crossref] [ Google Scholar]
- Wong S, Tumari HH, Ngadi N, Mohamed NB, Hassan O, Mat R. Adsorption of anionic dyes on spent tea leaves modified with polyethyleneimine (PEI-STL). J Clean Prod 2019; 206:394-406. doi: 10.1016/j.jclepro.2018.09.201 [Crossref] [ Google Scholar]
- Ghiasi E, Malekzadeh A. Removal of various textile dyes using LaMn(Fe)O3 and LaFeMn05O3 nanoperovskites; RSM optimization, isotherms and kinetics studies. J Inorg Organomet Polym Mater 2020; 30(7):2789-804. doi: 10.1007/s10904-019-01438-z [Crossref] [ Google Scholar]
- Panda SK, Aggarwal I, Kumar H, Prasad L, Kumar A, Sharma A. Magnetite nanoparticles as sorbents for dye removal: a review. Environ Chem Lett 2021; 19(3):2487-525. doi: 10.1007/s10311-020-01173-9 [Crossref] [ Google Scholar]