Avicenna J Environ Health Eng. 10(1):44-56.
doi: 10.34172/ajehe.2023.5316
Original Article
Optimization and Isothermal Studies of Antibiotics Mixture Biosorption From Wastewater Using Palm Kernel, Chrysophyllum albidum, and Coconut Shells Biocomposite
Ogundipe S. Opeoluwa 1, 2, Latinwo G. Kayode 1, Ayobami O. Ajani 1, 2, Tinuade J. Afolabi 1, 2, Idris O. Okeowo 3, 4, Adetoro R. Olaitan 5, Abass O. Alade 1, 2, 6, * 
Author information:
1Department of Chemical Engineering, Ladoke Akintola University of Technology, P.M.B. 4000, Ogbomoso, Nigeria
2Bioenvironmental, Water, and Engineering Research Group (BWERG), Ladoke Akintola University of Technology, P.M.B. 4000, Ogbomoso, Nigeria
3University of Chemistry and Technology, Prague, Czech Republic
4Institute for Water Education (IHE), Delft, Netherlands
5Analytical/Environmental Chemistry Unit Department of Pure and Applied Chemistry, Osun State University, P.M.B. 4494, Osogbo, Nigeria
6Science and Engineering Research Group (SEARG), Ladoke Akintola University of Technology, P.M.B. 4000, Ogbomoso, Nigeria
Abstract
The presence of persistent pharmaceutical products in water bodies is a significant problem that obstructs wastewater reuse. This study investigated the adsorption process for removing the recalcitrant antibiotics, including tetracycline (TC), ampicillin (AMP), and amoxicillin (AMOX) from an aqueous solution using a composite biosorbent made from a mixture of palm kernel shell (PKS), Chrysophyllum albidum (CAS), and coconut shell (CS). Simplex centroid design in the Design of Expert (12.0.1.0) was applied to optimize the percentage composition (20-55%) of the composite biosorbent precursor and to remove TC-AMP-AMOX mixtures from the aqueous solution in a batch study. The equilibrium data were fitted to 12 isotherm models and analyzed statistically. The maximum adsorption capacity of 9.12 mg/g, 8.66 mg/g, and 7.11 mg/g was achieved for TC, AMP, and AMOX, respectively, using the biocomposite biosorbent with an optimal mixture of 55% PKS, 20% CAS, and 25% CS. The adsorption behavior of TC, AMP, and AMOX was well-described by the Langmuir/Elovich isotherm (R2=1.000), Hill-DeBoer (R2=0.9953), and Freundlich/ Halsey (R2=0.9898) models, respectively. The obtained results showed that the biocomposite PKS-CAS-CS leverages the individual adsorptive capacity of each constituent to enhance the adsorption process. Moreover, the composite biosorbent demonstrated excellent potential for removing recalcitrant pharmaceuticals from wastewater effectively.
Keywords: Adsorption, Biosorbent, Isotherm, Optimization, Pharmaceuticals,
Copyright and License Information
© 2023 The Author(s); Published by Hamadan University of Medical Sciences.
This is an open-access article distributed under the terms of the Creative Commons Attribution License (
https://creativecommons.org/licenses/by/4.0), which permits unrestricted use, distribution, and reproduction in any medium, provided the original work is properly cited.
Please cite this article as follows: Opeoluwa OS, Kayode LG, Ajani AO, Afolabi TJ, Okeowo IO, Olaitan AR, et al. Optimization and isothermal studies of antibiotics mixture biosorption from wastewater using palm kernel, Chrysophyllum albidum, and coconut shells biocomposite. Avicenna J Environ Health Eng. 2023; 10(1):44-56. doi:10.34172/ajehe.2023.5316
1. Introduction
Pollution of water resources by different pollutants is a global environmental issue (1). For several decades, pharmaceutical constituents have been used in veterinary and human medicine; nevertheless, these compounds have potential risks for organisms when released into the environment. An essential source of these organic compounds is the discharge of effluents from wastewater treatment plants into surface water bodies (2). These recalcitrant pollutants in urban wastewater have turned into a severe environmental concern because they threaten aquatic ecosystems and human health (3). The presence of antibiotics in aquatic systems is of concern since their toxicity may cause a long-term effect on ecological sustainability even if they are present at trace levels (4). Antibiotics are essential as they have been used to treat infection-related diseases in humans and animals (5). The significant sources of antibiotics in the aqueous environment mainly originate from hospital effluents, pharmaceutical industries, and municipal wastewater. Antibiotics are widely used in human, veterinary medicine, and aquaculture to prevent or treat microbial infections (6). Tetracycline (TC), ampicillin (AMP), and amoxicillin (AMOX) are prominent antibiotics found in the environment. AMP and AMOX are penicillin-type antibiotics used to treat bacterial bladder infections, pneumonia, gonorrhea, stomach or intestine infections, and bacterial infections in the ear, nose, throat, skin, and lower respiratory tract, respectively (7,8). TC is a bacteriostatic agent that inhibits the synthesis of bacterial protein and is widely used as an antibiotic for animals and humans (9). These antibiotics are discharged continuously in the water bodies in the concentration range between ng/L-µg/L (10). Thus, removing these non-biodegradable pollutants from the aquatic environment becomes unavoidable. Conventional wastewater treatment technologies based on biological treatment, membrane separation, coagulation, flocculation, and sedimentation are ineffective in completely removing antibiotics and can only lead to partial elimination (11-13). Advanced oxidation technologies such as ultraviolet (UV) photolysis and Fenton’s reagent produce •OH radicals to actively and non-selectively decompose contaminants to completely remove antibiotics from wastewater (14). However, the main constraints of advanced oxidation are application cost, catalyst management, and residual toxicity in treated effluents (15). Such issues have motivated active research in recent years to develop new, simple, and efficient alternative technologies for eliminating antibiotics from bodies of water, of which adsorption is no exception.
The adsorption approach, among the numerous techniques, provides various advantages compared to other treatment technologies such as low initial investment, more straightforward construction, and easy operation (16). Unlike other more expensive methods, this method of removing antibiotics is preferable in terms of cost, efficiency, and lack of hazard. The proper comprehension and interpretation of adsorption isotherms are essential to the design and improvement of the adsorption system and the improvement of adsorption mechanism pathways (17). The most common isotherm models include Langmuir, Freundlich, Temkin, and Dubinin–Kaganer–Radushkevich (DKR) (18). Other isotherm models reported in the literature are Halsey, Jovanovic, Elovich, Jossen, Flory–Huggins, Kiselev, Harkins–Jura, Fowler–Guggenheim, and Redlich–Peterson to predict and compare adsorption performances (19).
Accordingly, this study aimed to investigate the potential of the biocomposite produced from the mixture of palm kernel shell (PKS), Chrysophyllum albidum shell (CAS), and coconut shell (CS) for the removal of TC, AMP, and AMOX in simulated wastewater. The simple-centroid design feature of the Design Expert Software (version 12.0.1) was deployed to optimize the mixing ratio of PKS, CAS, and CS in the development of a composite biosorbent. To the best of our knowledge, this is the first time biosorbent from a mixture of PKS, CAS, and CS is reported for the removal of antibiotics. Furthermore, unlike most previous studies on biosorbents for removing antibiotics, this research focused on investigating 12 different isotherm models to generate detailed isotherm parameters, which could essentially help understand the adsorption process and the generation of detailed isotherm parameters for reactor design and create a significant research gap at universal interest.
2. Methods
2.1. Materials and Equipment
The CAS and PKS were obtained from Odo-Oba Market in Ogbomoso in Oyo State, while the CS was obtained from Ogere-Remo in Ogun State. The reagents used included TC (C22H24N2O8), AMP (C16H19N3O4S), and AMOX (C16H19N3O5S, 90% purity), and their physicochemical properties and chemical structure are presented in Table 1. Other reagents are sodium hydroxide (NaOH), nitric acid, hydrogen peroxide, and distilled water. All chemicals were of analytical grade. The equipment used includes a weighing balance, beaker, measuring cylinder, crucible, volumetric flask, reagent bottle, desiccator, microwave oven (SAISHO), pH meter, rotary shaker (HZ- 300), centrifuge, and UV-visible spectrophotometer (AXIOM MEDICAL 752D).
Table 1.
Physicochemical Properties of Selected Pharmaceutical Drugs
|
Trade Name
|
Chemical Formula
|
Chemical Structure
|
Molecular Mass (g/mol)
|
Log K
ow
|
pKa
|
| Tetracycline |
C22H24N2O8
|
|
444.435 |
-1.37 |
7.68 (Basic)
3.3
|
| Ampicillin |
C16H18N3NaO4S
|
|
349.406 |
1.35 |
2.5 (-COOH)
7.3 (-NH2)
|
| Amoxicillin |
C16H19N3O5S
|
|
365.4 |
0.87 |
7.22 |
2.2. Preparation of Biocomposite from Coconut Shell, Palm Kernel Shell, and Chrysophyllum albidum Cell
The CS, PKS, and CAS were thoroughly washed with water to remove mud, dust, and other dirt. Afterward, these precursors were sun-dried for three weeks before being oven-dried at 105 °C to constant weight (21). Some of the dried samples were pulverized and then sieved to different sizes of 0.016-0.0937 inches. Each sample size was weighed, packed in separate polythene bags, and labeled accordingly, and the part with a particle size of 3.31 µm Granular activated carbon (GAC) was used for this study. PKS (400 g), CS (300 g), and CAS (300 g) were immersed in 1000 mL of 0.1 M NaOH and kept in the oven for 24 hours to aid the activation process. Excess NaOH was removed, and the activated samples were decolorized with 0.5 M H2O2, by soaking 400 g of activated CAS and CS in 500 mL H2O2 and 400 grams of PKS in 600 mL H2O2. Later, the decolorized activated samples were neutralized to pH 6.9-7.1 and oven-dried at 110 °C for 2 hours.
2.3. Simple Centroid Design and Statistical Analysis for the Preparation of Palm Kernel Shell-Chrysophyllum albidum Cell-Coconut Shell Biocomposite
The composition of the activated biocomposite materials, including PKS, CAS, and CS was formed through the matrix generated by the Design Expert software (v. 12.0.1.0). The composition of the input parameters (i.e., PKS, CAS, and CS) was varied as shown in Table 2. The output variables adsorption capacities and removal efficiencies were used as the dependent variables, the optimized input parameters of which were varied. Then, the analysis of variance (ANOVA) and other statistical components such as adequate precision, coefficient of determination (R2), coefficient of variation, adjusted R2, predicted R2, and standard deviation of the model equations and their terms were evaluated. The effect of the levels of the selected components was verified with contour and three-dimensional plots.
Table 2.
Component Level for Mixture Simplex Centroid Design
|
Component
|
Unit
|
Level
|
|
Low
|
High
|
| Palm kernel shell |
% |
25 |
55 |
|
Chrysophyllum albidum Shell
|
% |
20 |
50 |
| Coconut Shell |
% |
25 |
55 |
2.4. Biosorption Studies
Batch adsorption studies of TC, AMP, and AMOX were carried out using PKS-CAS-CS composite to determine their adsorption tendencies. The TC, AMP, and AMOX stock solutions were prepared by dissolving 1 gram of TC, AMP, and AMOX in 1000 mL of distilled water to achieve 1 g/L stock solutions of the antibiotics. The composite (1 g) developed based on the experimental design was added to 100 mL of varying concentrations (20-100 mg/L) of the working solution of TC, AMP, and AMOX mixtures as mixed pollutants. The concentrations of the mixed pharmaceuticals before and after adsorption were quantified with a UV-visible spectrophotometer at a maximum wavelength of 525, 623, and 46 nm for TC, AMP, and AMOX, respectively. Subsequently, the adsorption capacity and the percentage removal were estimated using equations 1 and 2, respectively.
(1)
where, C0 and Ce (mg/L) are the liquid-phase pharmaceutical concentrations at initial and equilibrium, respectively, M (g) is the mass of the adsorbent, and V is the volume (L) of the aqueous.
2.5. Adsorption Isotherm Studies
Adsorption isotherms describe the equilibrium relationships between sorbent and adsorbate at a constant temperature. The adsorption isotherms models have one or more parameters evaluated based on the relationships between the adsorption capacity and concentration adsorbed at equilibrium. The different adsorption models adopted in this study are highlighted in Table 3.
Table 3.
Isotherm Models Investigated for the Removal of TC, AMOX, and AMP using the PKS-CAS-CS Biocomposite
|
Isotherm Model
|
Formula
|
Equation No.
|
| Langmuir-1 |
|
3 |
| Langmuir-2 |
|
4 |
| Langmuir-3 |
|
5 |
| Langmuir-4 |
|
6 |
| Freundlich |
|
7 |
| Temkin |
|
8 |
| Kiselev |
|
9 |
| Harkin-Jura |
|
10 |
| Hill-DeBoer |
|
11 |
| Fowler-Guggenheim |
|
12 |
| Dubinin-Radushkevich |
|
13 |
| Halsey |
|
14 |
| Jovanovich |
|
15 |
| Elovich |
|
16 |
| Flory-Huggins |
|
17 |
Note. TC: Tetracycline; AMOX: Amoxicillin; AMP: Ampicillin; PKS: Palm kernel shell; CAS: Chrysophyllum albidum shell; CS: Coconut shell.
3. Result and Discussion
3.1. Model Summary of the Adsorption and Removal Efficiency of Tetracycline, Ampicillin, and Amoxicillin by Biocomposite Adsorbent
The mixture and simple centroid were used as the study category for the experimental design in the adsorption and removal efficiency of TC, AMP, and AMOX. The factors considered were the percentage of each precursor (i.e., PKS, CAS, and CS) in a composite, while the responses were adsorption capacity and removal efficiency. Special quadratic as well as quadratic and special cubic models were selected for the adsorption of AMP and AMOX, respectively, based on the 13 experimental runs generated. Run 13 (55% PKS, 20% CAS, and 25% CS) recorded the maximum adsorption capacities of 8.66 mg/g, 9.12 mg/g, and 7.11 mg/g, equivalent to 86.61, 91.19, and 71.13% of removal efficiencies for TC, AMP, and AMOX, respectively (Table 4). Run 13 was made of the composite biosorbent, with the highest percentage attributed to PKS. It is of no surprise that the run with the highest PKS exhibited the highest removal efficiency, and a previous study conducted by Aremu et al (18) significantly removed phenol from wastewater (85 64%) using activated carbon from PKS (608 °C, 0.5 M KOH at 60 minutes). All the runs have a relatively good capacity for removing TC and AMP, with a removal efficiency of > 80%, while the maximum removal efficiency for AMOX was 71.1%, which was as low as 7.13%, indicating the good adsorptive capacity of the biocomposite. Boukhelkhal et al (22) reported a removal efficiency of 84% for AMOX at 25 °C with a pH of 7 for a five-minute contact time and 0.24 g/L initial AMOX concentration. The efficiency of CS-activated carbon in removing ibuprofen was reported by Bello et al (23), showing an adsorption capacity of 76.92 mg/g. The higher removal efficiencies exhibited by these materials indicated the potential of the biocomposite for the effective removal of pharmaceutical pollutants.
Table 4.
Adsorption Capacity and Removal Efficiency at Varying Percentages of PKS, CAS, and CS
|
Run
|
PKS
|
CAS
|
CS
|
TC
|
AMP
|
AMOX
|
|
Qe (mg/g)
|
RE (%)
|
Qe (mg/g)
|
RE (%)
|
Qe (mg/g)
|
RE (%)
|
| 1 |
25.00 |
50.00 |
25.00 |
9.03 |
90.34 |
8.60 |
86.04 |
5.45 |
54.47 |
| 2 |
30.00 |
40.00 |
30.00 |
9.10 |
90.97 |
8.36 |
83.57 |
1.78 |
17.80 |
| 3 |
30.00 |
25.00 |
45.00 |
9.13 |
91.29 |
8.35 |
83.50 |
1.45 |
14.47 |
| 4 |
55.00 |
20.00 |
25.00 |
9.14 |
91.42 |
8.41 |
84.10 |
0.71 |
7.13 |
| 5 |
25.00 |
50.00 |
25.00 |
9.17 |
91.73 |
8.34 |
83.35 |
6.45 |
64.47 |
| 6 |
40.00 |
35.00 |
25.00 |
9.05 |
90.47 |
9.48 |
94.77 |
3.31 |
33.13 |
| 7 |
25.00 |
35.00 |
40.00 |
9.00 |
90.03 |
8.29 |
82.90 |
6.65 |
66.47 |
| 8 |
25.00 |
20.00 |
55.00 |
8.90 |
89.01 |
8.63 |
86.26 |
5.51 |
55.13 |
| 9 |
45.00 |
25.00 |
30.00 |
8.89 |
88.95 |
8.49 |
84.92 |
5.11 |
51.13 |
| 10 |
25.00 |
20.00 |
55.00 |
9.08 |
90.85 |
8.41 |
84.10 |
6.11 |
61.13 |
| 11 |
35.00 |
30.00 |
35.00 |
8.93 |
89.27 |
8.66 |
86.56 |
5.85 |
58.47 |
| 12 |
40.00 |
20.00 |
40.00 |
7.83 |
78.32 |
8.39 |
83.95 |
2.45 |
24.47 |
| 13 |
55.00 |
20.00 |
25.00 |
8.66 |
86.61 |
9.12 |
91.19 |
7.11 |
71.13 |
Note. PKS: Palm kernel shell; CAS: Chrysophyllum albidium shell; CS: Coconut shell; RE: Removal efficiency; TC: tetracycline; AMP: ampicillin; AMOX: amoxicillin.
3.2. Analysis of Variance
The ANOVA substantiated the adequacy of the developed quadratic regression models. A very low probability value of the F-test and values of Prob > F less than 0.05 within the ranges of 0.05 and 0.10 generally indicate that the terms of the model are significant, while values greater than 0.10 denotes the insignificant level (24). The ANOVA for the adsorption capacity of TC displays that the suggested model withan F value of 24.75 and P value of 0.0119 is significant (Table 5). The interaction terms (AB and BC) are nominal model terms in the regression equation. Hence, the ANOVA revealed that the composite of PKS-CAS and CAS-CS in the PKS-CAS-CS biocomposite does not have a significant effect on the adsorption of TC. In contrast, the PKS-CS composite had a significant effect on the adsorption of TC. The Model F values of 3.89 obtained for the adsorption of AMP by biocomposite PKS-CAS-CS implies that the model is relatively significant at Prob > F ranges (0.0642) between 0.05 and 0.10 (Table 5), with 6.42% chance of occurrence due to noise. The model term AB is the only significant interaction term, and this indicates the high propensity of the PKS-CAS mixture to affect the adsorption of TC significantly, unlike PKS-CS and CAS-CS mixtures. The model F value of 21.93 and P value of 0.0443 suggested that the model is statistically significant in the adsorption of AMOX by the biocomposite PKS-CAS-CS. All the model terms except BC were significant. Similar trends were observed by the ANOVA for the removal efficiency of TC, AMP, and AMOX onto the PKS-CAS-CS biocomposite (Table 6). The significance level for the TC and AMP removal efficiencies has Prob > F greater than 0.05, implying an inclination toward insignificant, though within acceptable limits. In addition, the removal efficiency of AMOX onto the PKS-CAS-CS biocomposite displays a high level of significance statistically for its model and model terms.
Table 5.
ANOVA for Tetracycline, Ampicillin, and Amoxicillin Uptake by PKS-CAS-CS Biocomposite
|
Sources
|
Tetracycline
|
Ampicillin
|
Amoxicillin
|
|
Sum of Squares
|
Mean Square
|
F
Value
|
Prob>F
|
Sum of Squares
|
Mean Square
|
F
Value
|
Prob>F
|
Sum of Squares
|
Mean Square
|
F
Value
|
Prob>F
|
| Model |
1.31 |
0.2189 |
24.75 |
0.0119* |
0.8662 |
0.1732 |
3.89 |
0.0642** |
2.53 |
0.3158 |
21.93 |
0.0443* |
| ⁽¹⁾Linear mixture |
0.4644 |
0.2322 |
26.25 |
0.0126* |
0.0854 |
0.0427 |
0.9595 |
0.4350 |
0.3027 |
0.1513 |
10.51 |
0.0869** |
| AB |
0.0207 |
0.0207 |
2.34 |
0.2235 |
0.6578 |
0.6578 |
14.78 |
0.0085* |
0.5615 |
0.5615 |
38.99 |
0.0247* |
| AC |
0.3815 |
0.3815 |
43.12 |
0.0072* |
0.0291 |
0.0291 |
0.6539 |
0.4496 |
0.5127 |
0.5127 |
35.60 |
0.0270* |
| BC |
0.0017 |
0.0017 |
0.1914 |
0.6913 |
0.1192 |
0.1192 |
2.68 |
0.1529 |
0.0192 |
0.0192 |
1.33 |
0.3680 |
| ABC |
0.1715 |
0.1715 |
19.39 |
0.0217* |
NA |
NA |
NA |
NA |
NA |
NA |
NA |
NA |
|
A2BC
|
NA |
NA |
NA |
NA |
NA |
NA |
NA |
NA |
1.24 |
1.24 |
85.96 |
0.0114* |
|
AB2C
|
NA |
NA |
NA |
NA |
NA |
NA |
NA |
NA |
0.8836 |
0.8836 |
61.35 |
0.0159* |
|
ABC2
|
NA |
NA |
NA |
NA |
NA |
NA |
NA |
NA |
0.9176 |
0.9176 |
63.71 |
0.0153* |
| Residual |
0.0265 |
0.0088 |
NA |
NA |
0.2671 |
0.0445 |
NA |
NA |
NA |
NA |
NA |
NA |
| Lack of fit |
1.40E-06 |
1.40E-06 |
0.0001 |
0.9927 |
02076 |
0.0519 |
1.74 |
0.3960 |
NA |
NA |
NA |
NA |
| Pure error |
0.0265 |
0.0133 |
NA |
NA |
0.0595 |
0.0298 |
NA |
NA |
0.0288 |
0.0144 |
NA |
NA |
| Cor Total |
1.34 |
NA |
NA |
NA |
1.13 |
NA |
NA |
NA |
2.56 |
NA |
NA |
NA |
Note. ANOVA: Analysis of variance; PKS: Palm kernel shell; CAS: Chrysophyllum albidium shell; CS: Coconut shell; NA: Not applicable.
* Significant at P < 0.05; **Significant at P < 0.1.
Table 6.
ANOVA for Removal Efficiency of Tetracycline, Ampicillin, and Amoxicillin Onto PKS-CAS-CS Biocomposite
|
Sources
|
Tetracycline
|
Ampicillin
|
Amoxicillin
|
|
Sum of Squares
|
Mean Square
|
F
Value
|
Prob>F
|
Sum of Squares
|
Mean Square
|
F
Value
|
Prob>F
|
Sum of Squares
|
Mean Square
|
F
Value
|
Prob>F
|
| Model |
136.08 |
17.01 |
12.82 |
0.0743** |
0.2398 |
0.0480 |
3.21 |
0.1130 |
0.0035 |
0.0004 |
154.40 |
0.0065* |
| ⁽¹⁾Linear mixture |
43.42 |
21.71 |
16.36 |
0.0576** |
0.0606 |
0.0303 |
2.03 |
0.2261 |
0.0001 |
0.0001 |
24.04 |
0.0399* |
| AB |
5.87 |
5.87 |
4.42 |
0.1701 |
0.0576 |
0.0576 |
3.86 |
0.1068 |
0.0010 |
0.0010 |
359.80 |
0.0028* |
| AC |
16.08 |
16.08 |
12.12 |
0.0735** |
0.0004 |
0.0004 |
0.0281 |
0.8734 |
0.0009 |
0.0009 |
327.96 |
0.0030* |
| BC |
0.1684 |
0.1684 |
0.1269 |
0.7557 |
0.0346 |
0.0346 |
2.32 |
0.1881 |
3.351E-06 |
3.351E-06 |
1.19 |
0.3895 |
| ABC |
NA |
NA |
NA |
NA |
NA |
NA |
NA |
NA |
NA |
NA |
NA |
NA |
|
A2BC
|
3.77 |
3.77 |
2.84 |
0.2341 |
NA |
NA |
NA |
NA |
0.0019 |
0.0019 |
681.92 |
0.0015* |
|
AB2C
|
3.11 |
3.11 |
2.34 |
0.2655 |
NA |
NA |
NA |
NA |
0.0013 |
0.0013 |
478.11 |
0.0021* |
|
ABC2
|
16.30 |
16.30 |
12.29 |
0.0726** |
NA |
NA |
NA |
NA |
0.0017 |
0.0017 |
601.21 |
0.0017* |
| Residual |
NA |
NA |
NA |
NA |
0.0746 |
0.0149 |
NA |
NA |
NA |
NA |
NA |
NA |
| Lack of fit |
NA |
NA |
NA |
NA |
0.0571 |
0.0190 |
2.17 |
0.3307 |
NA |
NA |
NA |
NA |
| Pure error |
2.65 |
1.33 |
NA |
NA |
0.0175 |
0.0088 |
NA |
NA |
5.6E-06 |
2.8E-06 |
NA |
NA |
| Cor Total |
138.73 |
|
|
|
0.3144 |
|
|
|
0.0035 |
|
|
|
Note. ANOVA: Analysis of variance; PKS: Palm kernel shell; CAS: Chrysophyllum albidium shell; CS: Coconut shell; NA: Not applicable.
* Significant at P < 0.05.
3.3. Model Equation
The model equation for the adsorption capacity and removal efficiencies of TC, AMP, and AMOX are presented in Equations 18-20 and 21-23. The coded factors equation can be used to predict the response for given levels of each factor. By default, the high levels of the mixture components are coded as + 1, and the low levels are coded as 0. The coded equation helps identify the relative impact of the factors by comparing the factor coefficients. The positive signs in the model equation equally convey a beneficial effect of the factor for increased responses, while negative signs indicate opposition to increased responses (25).
(18)
(19)
(20)
(21)
(22)
(23)
3.4. Diagnostic Studies on the Analysis of TC, AMP, and AMOX
The model’s suitability for removing TC, AMP, and AMOX was checked through diagnostic plots (Fig. 1a-c). The plots should lie closely along a straight line to show that the regression model prediction is accurate and that the residual values are negligible (24). The parity plot of predicted versus actual (Fig. 2a-c) shows that the predicted responses by the model equations agree with the observed responses, as fitted points lie closely along a straight line (24). The experimental and predicted values for removing TC, AMP, and AMOX agree and are well-correlated. Moreover, the plot of residuals versus the experimental run for TC, AMP, and AMOX (Fig. 3a-c) exhibits that the residuals lie within -14.089 to 14.089, -4.983 to + 4.983, and -140.054 to + 140.054 intervals, respectively. Additionally, no data were outside the range, demonstrating that the fitted model to the response surface was consistent with all the data, which confirms no error in recording the data (26).
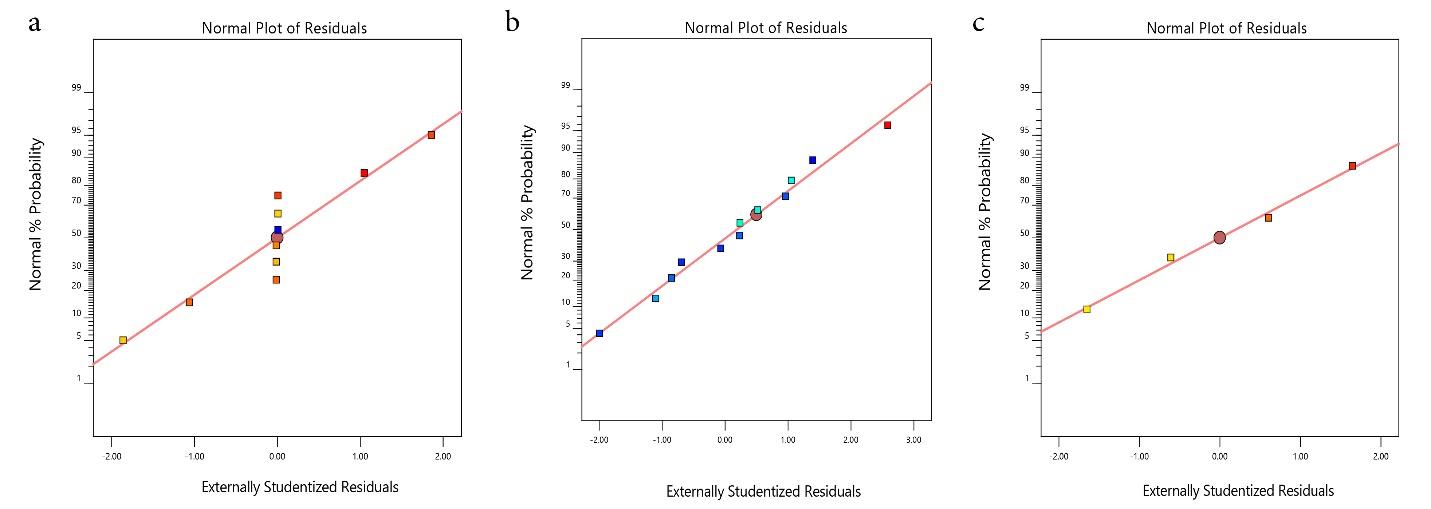
Fig. 1.
Normal Plot of Residual for the Adsorption Capacity of PKS-CAS-CS Biocomposite for the Removal of TC, AMP, and AMOX. Note. PKS: Palm kernel shell; CAS: Chrysophyllum albidium shell; CS: Coconut shell; TC: Tetracycline; AMP: Ampicillin; AMOX: Amoxicillin
.
Normal Plot of Residual for the Adsorption Capacity of PKS-CAS-CS Biocomposite for the Removal of TC, AMP, and AMOX. Note. PKS: Palm kernel shell; CAS: Chrysophyllum albidium shell; CS: Coconut shell; TC: Tetracycline; AMP: Ampicillin; AMOX: Amoxicillin
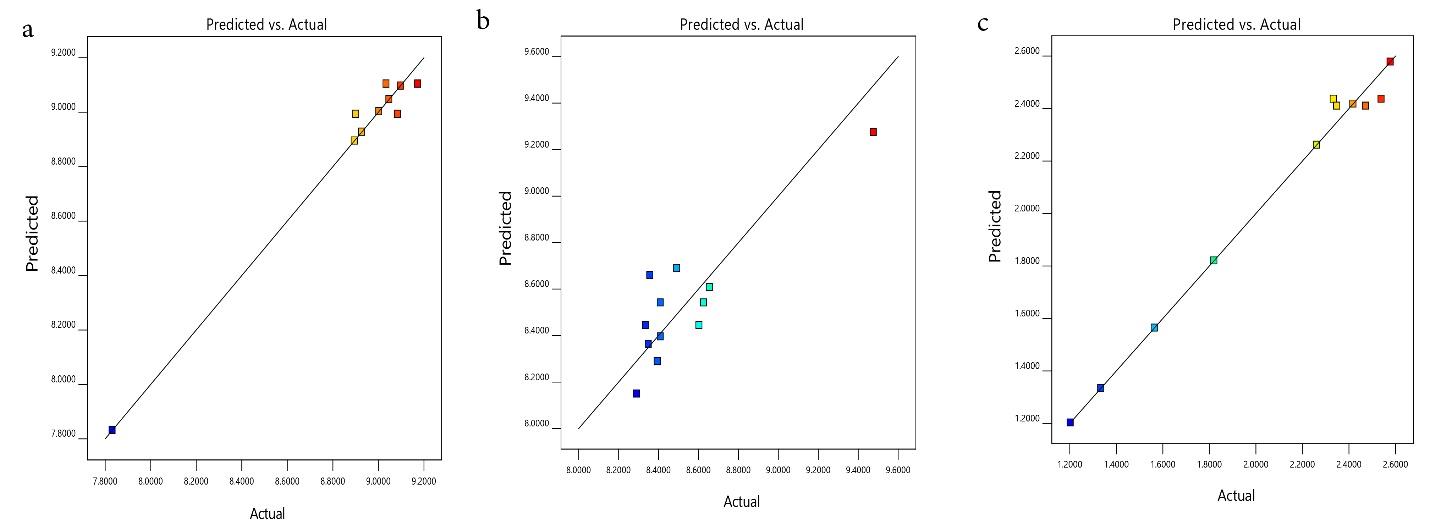
Fig. 2.
Predicted vs Actual Plot for the Adsorption Capacity of PKS-CAS-CS Biocomposite for the Removal of TC, AMP, and AMOX. Note. PKS: Palm kernel shell; CAS: Chrysophyllum albidium shell; CS: Coconut shell; TC: Tetracycline; AMP: Ampicillin; AMOX: Amoxicillin
.
Predicted vs Actual Plot for the Adsorption Capacity of PKS-CAS-CS Biocomposite for the Removal of TC, AMP, and AMOX. Note. PKS: Palm kernel shell; CAS: Chrysophyllum albidium shell; CS: Coconut shell; TC: Tetracycline; AMP: Ampicillin; AMOX: Amoxicillin
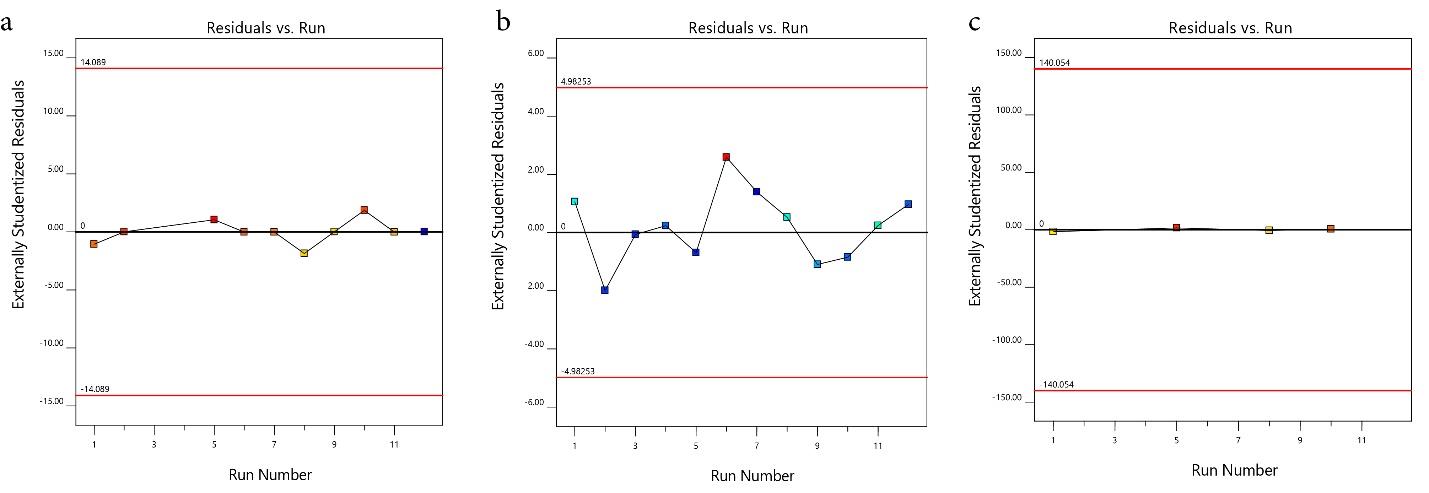
Fig. 3.
Residual vs Run Plot for the Adsorption Capacity of PKS-CAS-CS Biocomposite for the Removal of TC, AMP, and AMOX. Note. PKS: Palm kernel shell; CAS: Chrysophyllum albidium shell; CS: Coconut shell; TC: Tetracycline; AMP: Ampicillin; AMOX: Amoxicillin
.
Residual vs Run Plot for the Adsorption Capacity of PKS-CAS-CS Biocomposite for the Removal of TC, AMP, and AMOX. Note. PKS: Palm kernel shell; CAS: Chrysophyllum albidium shell; CS: Coconut shell; TC: Tetracycline; AMP: Ampicillin; AMOX: Amoxicillin
3.5. Model Graph
The contour (Fig. 4a-c) and 3-D graphs (Fig. 5a-c) illustrate the effect of the solid/solvent ratio on the adsorption capacity of TC, AMP, and AMOX using a maximum weight of 55.00%, 55.00%, and 50.00% for PKS, CS, and CAS, respectively. The red region indicates where the adsorption is maximum (hot zone), graduating through yellow and green to blue zones, where the adsorption is minimal (cold zone). The removal efficiency of the PKS-CAS-CS biocomposite is demonstrated by the contour graph (Fig. 6a-c) and 3-D graph (Fig. 7a-c). The removal efficiency of AMOX was lowest at PKS (55% wt) and 25 wt% for CAS and CS, respectively, as indicated by the blue region. Similarly, regarding the shape of the adsorption of AMP, the contour and 3-D graph exhibit the exact representation. However, the removal efficiency of TC was significantly influenced by the high percentage of PKS (55%wt), as depicted in the contour graph.
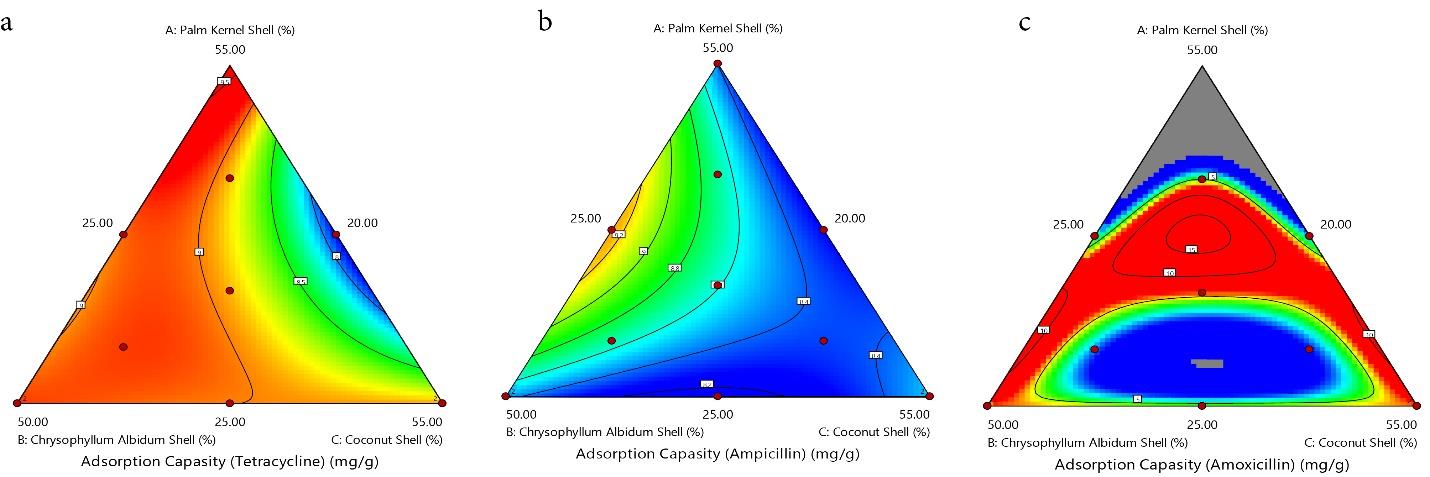
Fig. 4.
The Contour Plot for the Adsorption Capacity of TC, AMP, and AMOX. Note. TC: Tetracycline; AMP: Ampicillin; AMOX: Amoxicillin
.
The Contour Plot for the Adsorption Capacity of TC, AMP, and AMOX. Note. TC: Tetracycline; AMP: Ampicillin; AMOX: Amoxicillin
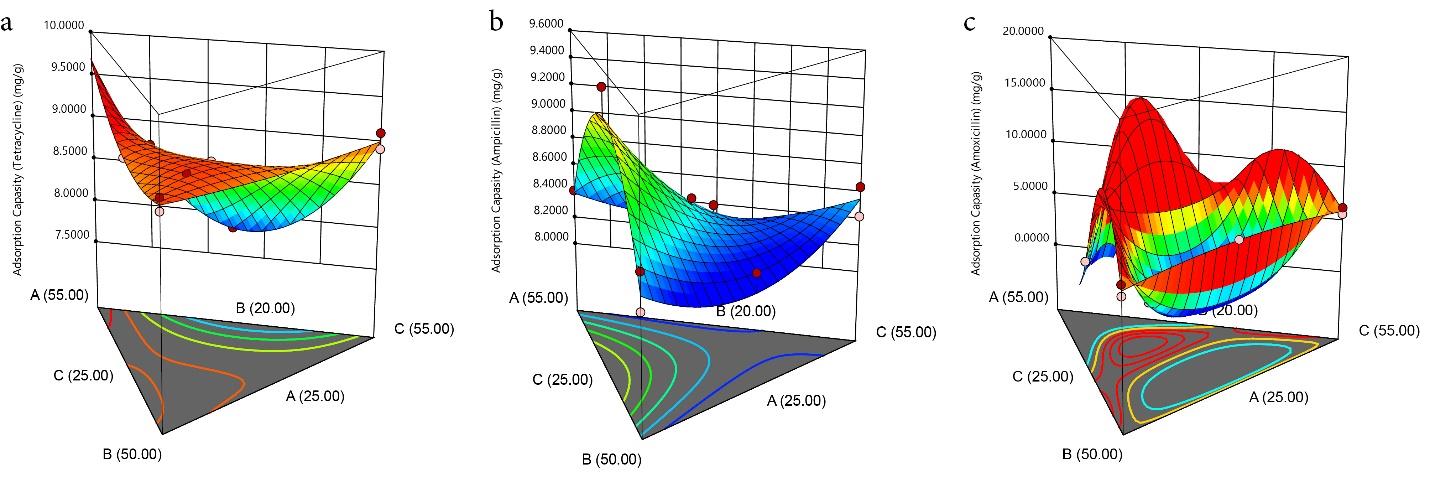
Fig. 5.
The 3D Model Plot for the Adsorption Capacity of TC, AMP, and AMOX. Note. TC: Tetracycline; AMP: Ampicillin; AMOX: Amoxicillin
.
The 3D Model Plot for the Adsorption Capacity of TC, AMP, and AMOX. Note. TC: Tetracycline; AMP: Ampicillin; AMOX: Amoxicillin
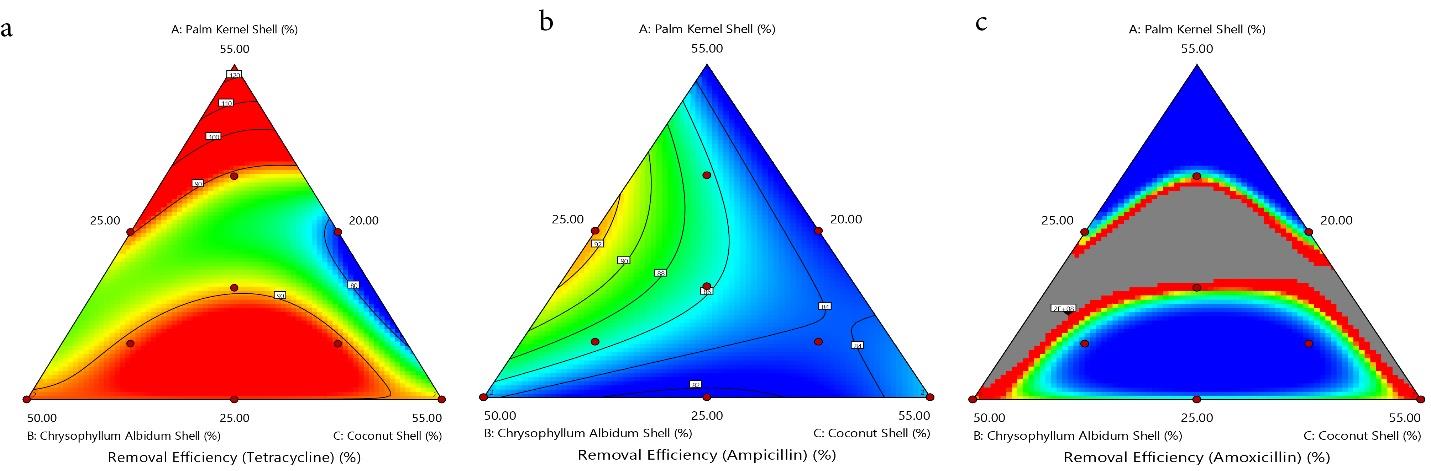
Fig. 6.
The Contour Plot for the Removal Efficiency of TC, AMP, and AMOX. Note. TC: Tetracycline; AMP: Ampicillin; AMOX: Amoxicillin
.
The Contour Plot for the Removal Efficiency of TC, AMP, and AMOX. Note. TC: Tetracycline; AMP: Ampicillin; AMOX: Amoxicillin
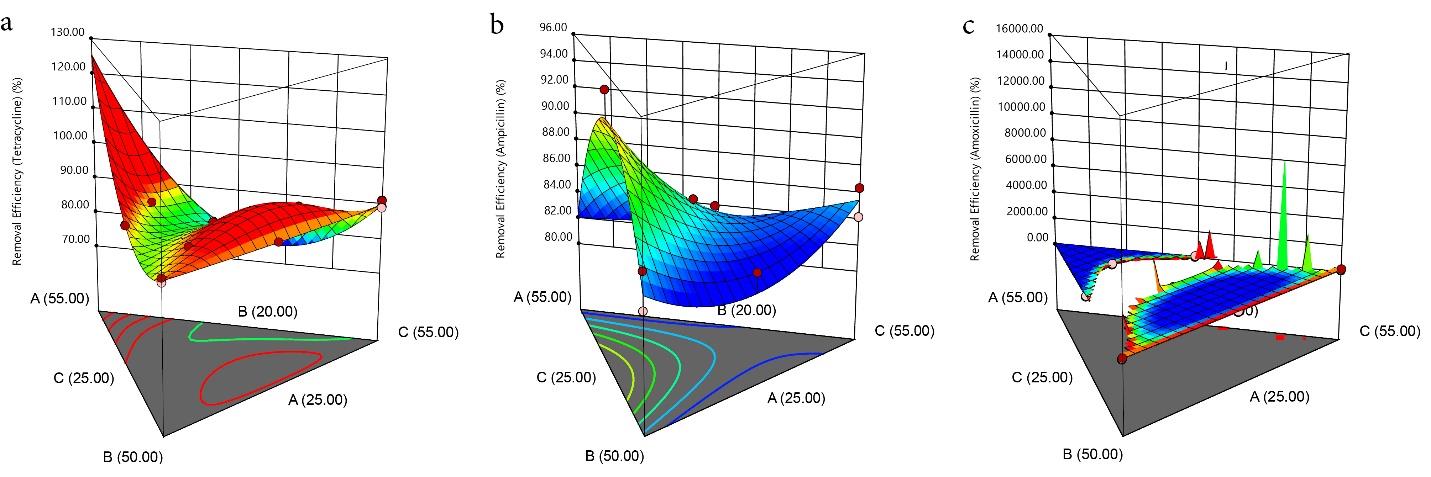
Fig. 7.
The 3D model Plot for the Removal Efficiency of TC, AMP, and AMOX. Note. TC: Tetracycline; AMP: Ampicillin; AMOX: Amoxicillin
.
The 3D model Plot for the Removal Efficiency of TC, AMP, and AMOX. Note. TC: Tetracycline; AMP: Ampicillin; AMOX: Amoxicillin
3.6. Effect of Contact Time on Adsorption Capacity
The effect of contact time on the adsorption of TC, AMP, and AMOX with bio-composites of PKS, CAS, and CS was carried out at varying time ranges (10-120 minutes) with 55 mg/L of simulated wastewater. As Fig. 8 indicates, the contact time significantly affected the adsorption process and agitation speed of 120 rpm and room temperature of 298 K. The adsorbate uptake increased with the increase in contact time (27). However, at about 30 minutes, the adsorption capacity of the biosorbent for the removal of the three pharmaceuticals remained constant, indicating that the adsorption site might have been saturated. The maximum adsorption capacity for removing AMP, TC, and AMOX was found to be 5.5 mg/g, 4.8 mg/g, and 4 mg/g, respectively.
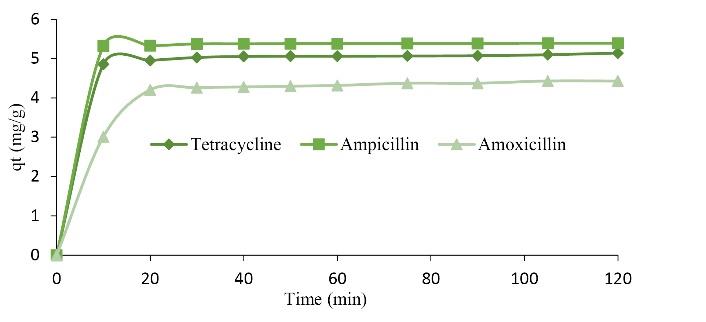
Fig. 8.
Effect of Contact Time on the Adsorption of TC, AMP, and AMOX. Note. TC: Tetracycline; AMP: Ampicillin; AMOX: Amoxicillin
.
Effect of Contact Time on the Adsorption of TC, AMP, and AMOX. Note. TC: Tetracycline; AMP: Ampicillin; AMOX: Amoxicillin
3.7. Adsorption Isotherm Effect on Concentration
3.7.1. Langmuir-2 Model
The plot evaluated the Langmuir parameters for the adsorption of TC, AMP, and AMOX unto the biocomposite (Fig. 9a). The Qm (mg/g) and KL (L/mg) are the Langmuir constants, and their values are summarized in Table 7. The R2 obtained for the removal rate of TC, AMP, and AMOX by biocomposite is 1.0000, 0.7728, and 0.9878, respectively (Table 6), indicating the suitability of the biocomposite for the removal of the pharmaceuticals. However, it fitted best for the removal of TC, indicating monolayer adsorption. The R2 of this study was compared well with that of previous studies (28-31). However, negative values of QM and KL indicate inappropriateness.
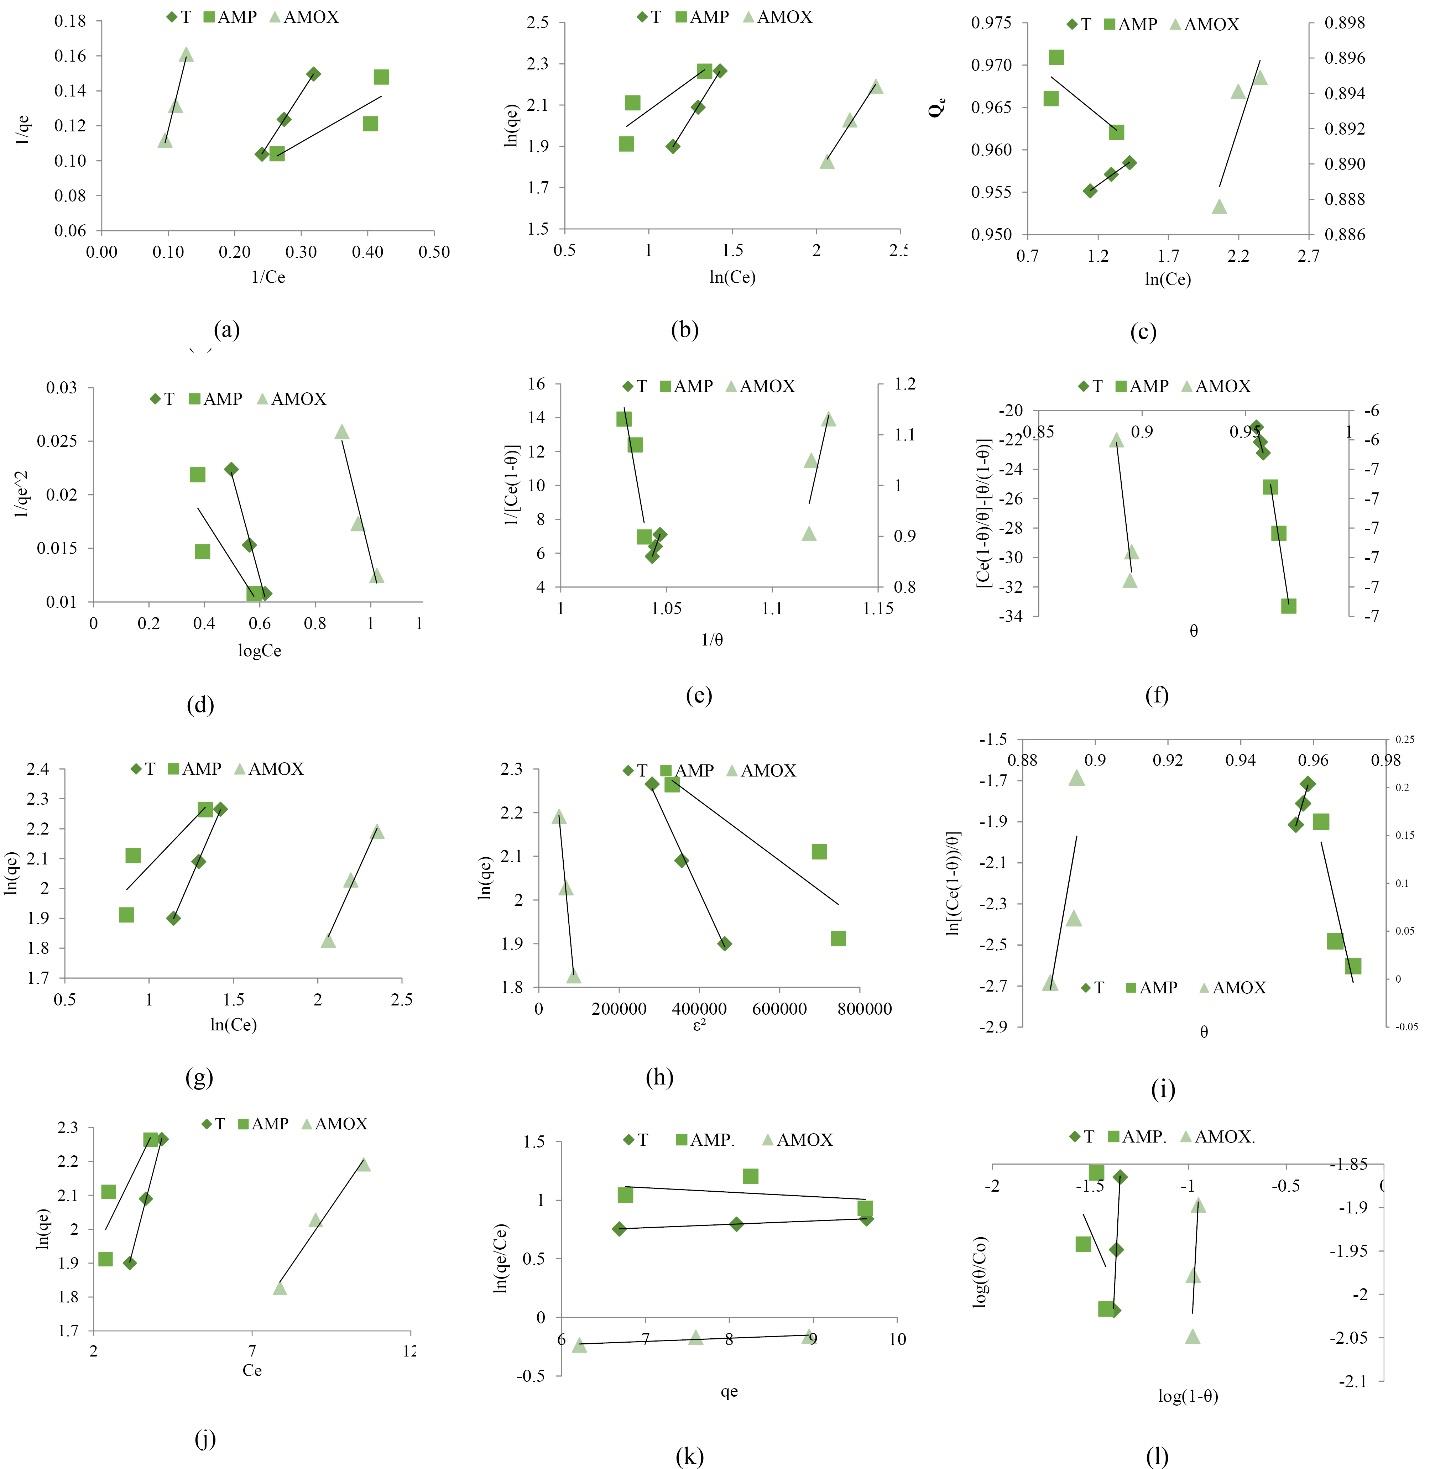
Fig. 9.
Linearized Isotherm Models for the TC, AMOX, and AMP. Note. TC: Tetracycline; AMP: Ampicillin; AMOX: Amoxicillin
.
Linearized Isotherm Models for the TC, AMOX, and AMP. Note. TC: Tetracycline; AMP: Ampicillin; AMOX: Amoxicillin
Table 7.
Langmuir and Freundlich Isotherm Parameters Estimating and Comparing Them With Other Adsorbents
|
Adsorbent
|
Pollutant
|
Langmuir Isotherm
|
Freundlich Isotherm
|
References
|
|
R
l
|
Q
m
|
K
l
|
R
2
|
1/n
|
K
f
|
R
2
|
|
Saccharomyces cerevisiae
|
AMOX |
0.121 |
6.27 |
0.724 |
0.887 |
0.39 |
0.46 |
0.939 |
(28)
|
| Vegetable-based AC |
AMP |
NA |
12.7 |
0.015 |
0.991 |
0.234 |
0.9 |
0.920 |
(29)
|
| AC |
AMP |
NA |
90.57 |
0.011 |
0.9943 |
0.435 |
5.858 |
0.9796 |
(30)
|
|
α-Fe2O3/RGO
|
TC |
|
9.69 |
0.560 |
0.991 |
0.2778 |
4.26 |
0.958 |
(31)
|
| Fe-doped zeolite |
TC |
NA |
204 |
0.053 |
0.995 |
0.259 |
48.32 |
0.9273 |
(32)
|
| PKS-CAS-CS Biocomposite |
TC |
|
-26.3 |
-0.065 |
1.000 |
0.766 |
2.5363 |
0.9997 |
This study |
| AMP |
|
22.12 |
0.207 |
0.7228 |
1.692 |
30.47 |
0.7502 |
This study |
| AMOX |
|
-27.5 |
-0.024 |
0.9878 |
-1.33 |
0.177 |
0.9898 |
This study |
Note. TC: Tetracycline; AMP: Ampicillin; AMOX: Amoxicillin; PKS: Palm kernel shell; CAS: Chrysophyllum albidium shell; CS: Coconut shell; R2: Coefficient of determination; NA: Not applicable.
3.7.2. Freundlich Model
The isotherm constants (KF and n) are calculated from the slope and intercept of the linear plot (Fig. 9b). The adsorption intensity KF of the biocomposite for removing TC, AMP, and AMOX were 2.5363, 30.47, and 0.1774 (L/mg), respectively (Table 7), suggesting that the biocomposite for the removal of AMP has the highest KF. The Freundlich isotherm showed the model’s suitability for removing TC, AMP, and AMOX with R2 of 0.9997, 0.7502, and 0.9898, respectively. The numerical value, n, is an important index to determine the favorability of the adsorption of dichlorvos. It is generally stated that the values of n in the range 2–10 represent ‘good heterogeneity’, 1–2 indicate ‘moderately good’, and less than 1 represents ‘poor’ adsorption characteristics. However, only the value of ‘n’ obtained for the removal of TC by this study can be rated as good.
3.7.3. Temkin Model
This isotherm contains a factor that explicitly considers the adsorbent–adsorbate interactions. The plot of qe against lnCe can be found in Fig. 9c. The Temkin isotherm equilibrium-binding constant (A) (L/mg) for the biocomposite on TC, AMP, and AMOX are 1.34 × 1079 L/mg, 2.43 × 10-73 L/mg, and 8.22 × 1033 L/mg, respectively. Moreover, the constant β, the heat of adsorption, was found to be highest in the adsorptive removal of AMP using biocomposite. Compared to their studies, the Temkin isotherm model fitted best with the adsorption TC (R2 = 0.9962).
3.7.4. DubininRadushkevich Model
The porosity, free energy, Ɛ, and adsorption mechanism are determined from the Dubinin-Radushkevich isotherm plot. The linear relationship between the plot of Inqe against Ɛ2 generated the ß and Inqm as the slope and intercept of the plot, respectively (Fig. 9h). The estimated qm parameters are 16.7634, 12.2008, and 14.7715 mg/g for TC, AMP, and AMOX, respectively (Table 8). The calculated values of the related adsorption energy (ß) for the adsorption TC, AMP, and AMOX were 2 × 10⁻⁶, 7 × 10⁻⁷, and 1 × 10⁻⁵ mol2 kJ-2. The ß for the adsorption of AMOX was close to that in the study by Jannat Abadi (32), where Fe-doped zeolite was used to remove TC. Furthermore, the R2 of the Dubinin Radushkevich (Dubinin R.) model for the removal of TC, AMP, and AMOX by composite were 0.9931, 0.7755, and 0.9994, respectively.
Table 8.
Estimated Parameters of Temkin and Dubinin R. Isotherms and Comparing Them with Other Adsorbents
|
Adsorbent
|
Pollutant
|
Temkin Isotherm
|
Dubinin. R Isotherms
|
References
|
|
A
|
B
|
K
l
|
R
2
|
ß
|
Qm
|
E
|
R
2
|
| Wheat grains |
AMOX |
113.57 |
7.10 |
NA |
0.9999 |
NA |
NA |
NA |
NA |
(28)
|
| Saccharomyces cerevisiae |
AMOX |
NA |
NA |
NA |
NA |
0.12 |
0.83 |
2.04 |
0.847 |
(28)
|
| Fe-doped zeolite |
TC |
NA |
NA |
35.7 |
0.9750 |
2 × 10⁻⁵
|
167 |
NA |
0.83 |
(32)
|
| Polydopamine |
AMP |
95.33 |
221 |
107 |
0.9954 |
3.00 |
74.98 |
4.08 |
0.7907 |
(33)
|
| PKS-CAS-CS Biocomposite |
TC |
1.35 × 1079
|
0.0119 |
4.37 |
0.9962 |
2 × 10-06
|
16.763 |
NA |
0.9931 |
This study |
| AMP |
2.43 × 10-73
|
-0.0135 |
8.72 |
0.6252 |
7 × 10-07
|
12.201 |
NA |
0.7755 |
This study |
| AMOX |
8.22 × 1033
|
0.0247 |
3.52 |
0.7979 |
1 × 10-05
|
14.772 |
NA |
0.9994 |
This study |
Note. Dubinin R: Dubinin Radushkevich; TC: Tetracycline; AMP: Ampicillin; AMOX: Amoxicillin; PKS: Palm kernel shell; CAS: Chrysophyllum albidium shell; CS: Coconut shell; R2: Coefficient of determination; NA: Not applicable.
3.7.5. Harkin-Jura Model
This model considers the possibility of multilayer adsorption on the surface of absorbents having heterogeneous pore distribution (34). The plot of
against log Ce (Fig. 9d) provides a linear relationship from which A and B are determined from the slope and intercept of the plot. The values of A for the removal of TC, AMP, and AMOX by biocomposite were 10.43, 25, and 9.45, respectively. Moreover, the estimated B parameters were 0.73, 0.85, and 1.13 for TC, AMP, and AMOX removal by biocomposite, respectively (Table 8). In addition, the R2 values of the Harkin-Jura model for the removal of TC, AMP, and AMOX by composite were 0.9927, 0.6630, and 0.9599, respectively.
3.7.6. Kiselev Model
This model, known as the localized monomolecular layer model, is only valid for surface coverage 𝜃 > 0.68 (35). The plot of
against
(Fig. 5e) provides a linear relationship from which Ki and KiKn are determined from the slope and intercept. The values of parameter Ki obtained from the model for removing TC, AMP, and AMOX by biocomposite were 356.33, -718.95, and 18.846 L/mg, respectively. The Kn regarded as the equilibrium constant of association (adsorbate-adsorbate) was estimated to be -1.0270, -1.0502, and -1.0663 for TC, AMP, and AMOX removal, respectively. However, the negative values of Kn were surprising because the equilibrium constants should be non-negative (36). The value of Ki (Table 9) is positive (356.33 L/mg), indicating the formation of a complex between the adsorbed species (37). The Kiselev model fitted most for using biocomposite to remove TC (R2 = 0.9972).
Table 9.
Harkin-Jura, Kiselev, Hill-DeBoer, Halsey, Fowler, Jovanovich, Elovich, and Flory Huggins Model Parameters
|
Isotherms
|
Parameters
|
Tetracycline
|
Ampicillin
|
Amoxicillin
|
| Harkin-Jura |
A |
10.4275 |
25 |
9.4518 |
| B |
0.7268 |
0.85 |
1.1333 |
|
R2
|
0.9927 |
0.663 |
0.9599 |
| Kiselev |
Ki
|
356.33 |
-718.95 |
18.846 |
|
Kn
|
-1.0270 |
-1.0502 |
-1.0663 |
|
R2
|
0.9972 |
0.8688 |
0.6952 |
| Hill-DeBoer |
K2
|
1303797 |
2277136 |
149467 |
|
K1
|
7.71 × 10⁻²¹
|
0.000 |
5.56 × 10⁻²¹
|
|
R2
|
0.9996 |
0.9953 |
0.9167 |
| Halsey |
nH
|
-0.7656 |
-1.6923 |
-0.7967 |
|
KH
|
1.4981 |
4.4101 |
0.4718 |
|
R2
|
0.9997 |
0.7502 |
0.9898 |
| Fowler Guggenheim |
W |
73479.8 |
-95846 |
27212 |
|
R2
|
0.9933 |
0.8327 |
0.6473 |
| Jovanovich |
Kf
|
0.3609 |
0.1918 |
0.1365 |
|
qmax
|
2.1589 |
5.0000 |
2.1591 |
|
R2
|
0.9995 |
0.7367 |
0.9798 |
| Elovich |
qm
|
-34.36 |
26.45 |
-36.10 |
|
Ke
|
0.9838 |
1.000 |
1.0111 |
|
R2
|
1.0000 |
0.1537 |
0.8379 |
| Flory Huggins |
N |
4.5649 |
-0.5247 |
4.3969 |
|
Kfg
|
73.0541 |
0.0000 |
9.7777 |
|
R2
|
0.9984 |
0.1505 |
0.8622 |
Note. R2: Coefficient of determination.
3.7.7. Hill-DeBoer Model
Hill-DeBoer isotherm model delineates a phenomenon with mobile adsorption and lateral interaction among adsorbed molecules (38). The plot of
against Ө provides a linear relationship from which
and -InK1 are determined from the slope and intercept of the plot, as seen in Fig. 5f. The K2 values for a contact time of TC, AMP, and AMOX were 1303797, 2277136, and 149467 kJ/mol, respectively. The high positive values of K2 indicate strong lateral interaction, affinity, and attraction between the adsorbed molecules (Table 9). Furthermore, the K1 parameters for the removal of these pharmaceuticals were about zero.
3.7.8. Halsey Model
The Halsey model plot was obtained by the plot of lnqe against lnCe (Fig. 8g). It evaluates multilayer adsorption at a relatively large distance from the surface. The nH values of TC, AMP, and AMOX removal by biocomposite were -0.7656, -1.6923, and -0.7967, respectively (Table 9). Moreover, the estimated KH parameters were 1.4981, 4.4101, and 0.4718 for TC, AMP, and AMOX removal by biocomposite. Additionally, the model fit is best for biocomposite used for removing TC (R2 = 0.9997).
3.7.9. Fowler Guggenheim Model
This isotherm model is established because the heat of adsorption varies linearly with loading. The plot of
against Ө (Fig. 5i) provides a linear relationship from which
and InKfg were determined from the slope and intercept of the plot, as illustrated in Table 9. The interaction energy (W) between adsorbed TC and AMOX molecules was positive (73479.8, and 27212.4 kJ/mol), indicating that the interaction is attractive; subsequently, the heat of adsorption could increase with loading because of increased interaction between adsorbed molecules as loading increases (35). However, the involved interaction with AMP was repulsive due to the negative value of W (-9.5846 kJ/mol), and the heat of adsorption decreased with loading. The R2 for TC, AMP, and AMOX is estimated as 0.9933, 0.8327, and 0.6473, respectively.
3.7.10. Jovanovich Model
The Langmuir isotherm model was involved allowing the mechanical interaction. The slope Kf and intercept qmax were obtained from the linear plot of the model lnqe against Ce, as depicted in Fig. 5j and Table 9. The R2 obtained from the Jovanovich plot for TC and AMOX adsorption was high (0.9995 and 0.9798) but slightly less than Langmuir isotherm. However, the R2 obtained from the Jovanovich plot AMP adsorption was low (0.7367), indicating a lateral interaction (19).
3.7.11.Elovich Isotherm Model
The Elovich model was based on multilayer adsorption, and adsorption increased exponentially with the adsorption site (39). Elovich constants qm and Ke, representing maximum adsorption capacity and adsorption constant, respectively, were evaluated from the slope and intercept of the plot of ln (qe/Ce) versus qe (Fig. 9k). The maximum adsorption capacity of biocomposite in the removal of AMOX was the highest (36.10 mg/g); hence, Elovich model was not suitable for the adsorption of AMP with an R2 of 0.1537 but was suitable for the adsorption of TC and AMOX whose R2 are 1.0000 and 0.8379, respectively.
3.7.12. Flory-Huggins Model
The Flory-Huggins isotherm model was used to examine the degree of surface coverage characteristics of the TC, AMP, and AMOX on the surface of the biocomposite. The plot of
against ln(1-θ) provides a linear relationship from which n and lnKfg are determined from the slope and intercept of the plot (Fig. 9l). The n values for a contact time of TC, AMP, and AMOX were 4.5649, -0.5247, and 4.3969, respectively. The estimated Kfg parameters were 73.0541, 0.0000, and 9.7777 for TC, AMP, and AMOX, respectively. In addition, the equilibrium constant Kfg from the Flory-Huggins model was used to find Gibb’s free energy.
Table 10 presents the summary of the arrangements of the selected isotherm models based on the R2. It can be deduced that the order of isotherm models for TC adsorption (in descending order) is as follows: Langmuir and Elovich > Freundlich and Halsey > Hill-DeBoer > Jovanovich > Flory Huggins > Kiselev > Temkin > Fowler Guggenheim > Dubinin R. > Harkin-Jura. For AMP adsorption, the isotherm models include (in descending order) Hill-DeBoer > Kiselev > Fowler Guggenheim > Dubinin R. > Freundlich and Halsey > Jovanovich > Langmuir > Harkin-Jura > Temkin > Elovich > Flory Huggins. Finally, for AMOX adsorption, the suitability of the isotherm models are as follows (in descending order): Dubinin R. > Freundlich and Halsey > Langmuir > Jovanovich > Harkin-Jura > Hill-DeBoer > Flory Huggins > Elovich > Temkin > Kiselev > Fowler Guggenheim.
Table 10.
Suitable Isotherm Models and Parameter Comparison
|
Model
|
R
2
|
|
Tetracycline
|
Ampicillin
|
Amoxicillin
|
| Langmuir |
1.0000 |
0.7228 |
0.9828 |
| Freundlich |
0.9997 |
0.7502 |
0.9898 |
| Temkin |
0.9962 |
0.6252 |
0.7979 |
| Harkin-Jura |
0.9927 |
0.663 |
0.9599 |
| Kiselev |
0.9972 |
0.8688 |
0.6952 |
| Hill-DeBoer |
0.9996 |
0.9953 |
0.9167 |
| Halsey |
0.9997 |
0.7502 |
0.9898 |
| Dubinin R. |
0.9931 |
0.7755 |
0.9994 |
| Fowler Guggenheim |
0.9933 |
0.8327 |
0.6473 |
| Jovanovich |
0.9995 |
0.7367 |
0.9798 |
| Elovich |
1.0000 |
0.1537 |
0.8379 |
| Flory Huggins |
0.9984 |
0.1505 |
0.8622 |
Note. R2: Coefficient of determination.
4. Conclusion
This study revealed the effectiveness of a biocomposite made from PKS, CAS, and CS for removing TC, AMP, and AMOX from aqueous solutions. The study successfully used the mixture and simple centroid methods to produce the composite biosorbent, achieving maximum removal efficiencies of TC (86.61%), AMP (91.19%), and AMOX (71.13%) under optimal conditions of 55% PKS, 20% CAS, and 25% CS, respectively. Special quadratic and cubic models were generated for the adsorption of AMP and AMOX, respectively, while a special cubic model was generated for TC. The ANOVA results showed that the interaction between mixture CAS-CS in the bio-composite PKS-CAS-CS do not significantly affect the adsorption of TC, AMP, and AMOX, as their P values were higher than 0.05. The biocomposite PKS-CAS-CS demonstrated high adsorption capacities for TC, AMP, and AMOX, with values of 4.8 mg/g, 5.5 mg/g, and 4 mg/g, respectively, after a contact time of 120 minutes. Moreover, the adsorption capacity of the biosorbent on AMP was highest and became constant after approximately 30 minutes of contact time. Furthermore, the adsorption behavior of TC was well described by the Langmuir and Elovich isotherm models (with R2 = 1.000), while the Dubinin R. and Hill-DeBoer models best described the equilibrium data for the adsorption of AMOX and AMP, respectively. Finally, this study found that biocomposite PKS-CAS-CS exhibits an excellent potential for removing TC, AMP, and AMOX from aqueous solutions.
Authors’ Contribution
Conceptualization: Abass O. Alade; Tinuade J. Afolabi.
Data curation: Ogundipe, S.Opawale; Ayobami O. Ajani.
Formal Analysis: Abass O. Alade; Idris O. Okeowo.
Funding acquisition: Tinuade J. Afolabi; Ogundipe S. Opawale.
Investigation: Ogondipe S. Opawale.
Methodology: Abass O. Alade; Adetoro R. Olaitan.
Project administration: Abass O. Alade; Latinwo G. Kayode.
Resources: BWERG, Laboratory, LAUTECH, Ogbomoso, Nigeria.
Software: Abass O. Alade; Ayobami O. Ajani.
Supervision: Abass O. Alade; Latinwo G. Kayode.
Validation: Abass o Alade; Idris O. Okeowo.
Visualization: Tinuade J. Afolabi; Latinwo G. Kayode.
Writing – original draft: Ogundipe S. Opeoluwa.
Writing – review & editing: Abass O. Alade; Idris O. Okewow
Competing Interests
The authors declare that they have no conflict of interests.
References
- Eriksson E, Baun A, Mikkelsen PS, Ledin A. Risk assessment of xenobiotics in stormwater discharged to Harrestrup Å, Denmark. Desalination 2007; 215(1-3):187-97. doi: 10.1016/j.desal.2006.12.008 [Crossref] [ Google Scholar]
- Balarak D, Kord Mostafapour F. Batch equilibrium, kinetics and thermodynamics study of sulfamethoxazole antibiotics onto Azolla filiculoides as a novel biosorbent. Br J Pharm Res 2016; 13(2):1-14. doi: 10.9734/bjpr/2016/28521 [Crossref] [ Google Scholar]
- Petrie B, Barden R, Kasprzyk-Hordern B. A review on emerging contaminants in wastewaters and the environment: current knowledge, understudied areas and recommendations for future monitoring. Water Res 2015; 72:3-27. doi: 10.1016/j.watres.2014.08.053 [Crossref] [ Google Scholar]
- Chaba JM, Nomngongo PN. Effective adsorptive removal of amoxicillin from aqueous solutions and wastewater samples using zinc oxide coated carbon nanofiber composite. Emerg Contam 2019; 5:143-9. doi: 10.1016/j.emcon.2019.04.001 [Crossref] [ Google Scholar]
- Serna-Galvis EA, Silva-Agredo J, Giraldo-Aguirre AL, Flórez-Acosta OA, Torres-Palma RA. High frequency ultrasound as a selective advanced oxidation process to remove penicillinic antibiotics and eliminate its antimicrobial activity from water. Ultrason Sonochem 2016; 31:276-83. doi: 10.1016/j.ultsonch.2016.01.007 [Crossref] [ Google Scholar]
- Alexy R, Schöll A, Kümpel T, Kümmerer K. What do we know about antibiotics in the environment? In: Kümmerer K, ed. Pharmaceuticals in the Environment. Berlin, Heidelberg: Springer; 2004. p. 209-21. 10.1007/978-3-662-09259-0_17.
- Unutkan T, Bakirdere S, Keyf S. Development of an analytical method for the determination of amoxicillin in commercial drugs and wastewater samples, and assessing its stability in simulated gastric digestion. J Chromatogr Sci 2018; 56(1):36-40. doi: 10.1093/chromsci/bmx078 [Crossref] [ Google Scholar]
- Rahardjo AK, Susanto MJ, Kurniawan A, Indraswati N, Ismadji S. Modified Ponorogo bentonite for the removal of ampicillin from wastewater. J Hazard Mater 2011; 190(1-3):1001-8. doi: 10.1016/j.jhazmat.2011.04.052 [Crossref] [ Google Scholar]
- Tanvir EM, Hasan MA, Nayan SI, Islam T, Ahmed T, Hossen MS. Ameliorative effects of ethanolic constituents of Bangladeshi propolis against tetracycline-induced hepatic and renal toxicity in rats. J Food Biochem 2019; 43(8):e12958. doi: 10.1111/jfbc.12958 [Crossref] [ Google Scholar]
- Anh HQ, Le TPQ, Da Le N, Lu XX, Duong TT, Garnier J. Antibiotics in surface water of East and Southeast Asian countries: a focused review on contamination status, pollution sources, potential risks, and future perspectives. Sci Total Environ 2021; 764:142865. doi: 10.1016/j.scitotenv.2020.142865 [Crossref] [ Google Scholar]
- Zhu TT, Su ZX, Lai WX, Zhang YB, Liu YW. Insights into the fate and removal of antibiotics and antibiotic resistance genes using biological wastewater treatment technology. Sci Total Environ 2021; 776:145906. doi: 10.1016/j.scitotenv.2021.145906 [Crossref] [ Google Scholar]
- Saitoh T, Shibata K, Fujimori K, Ohtani Y. Rapid removal of tetracycline antibiotics from water by coagulation-flotation of sodium dodecyl sulfate and poly(allylamine hydrochloride) in the presence of Al(III) ions. Sep Purif Technol 2017; 187:76-83. doi: 10.1016/j.seppur.2017.06.036 [Crossref] [ Google Scholar]
- Wang S, Ma X, Liu Y, Yi X, Du G, Li J. Fate of antibiotics, antibiotic-resistant bacteria, and cell-free antibiotic-resistant genes in full-scale membrane bioreactor wastewater treatment plants. Bioresour Technol 2020; 302:122825. doi: 10.1016/j.biortech.2020.122825 [Crossref] [ Google Scholar]
- Wang J, Zhuan R. Degradation of antibiotics by advanced oxidation processes: an overview. Sci Total Environ 2020; 701:135023. doi: 10.1016/j.scitotenv.2019.135023 [Crossref] [ Google Scholar]
- Ganiyu SO, van Hullebusch ED, Cretin M, Esposito G, Oturan MA. Coupling of membrane filtration and advanced oxidation processes for removal of pharmaceutical residues: a critical review. Sep Purif Technol 2015; 156(Pt 3):891-914. doi: 10.1016/j.seppur.2015.09.059 [Crossref] [ Google Scholar]
- Ahmed MJ, Hameed BH. Removal of emerging pharmaceutical contaminants by adsorption in a fixed-bed column: a review. Ecotoxicol Environ Saf 2018; 149:257-66. doi: 10.1016/j.ecoenv.2017.12.012 [Crossref] [ Google Scholar]
- El-Khaiary MI. Least-squares regression of adsorption equilibrium data: comparing the options. J Hazard Mater 2008; 158(1):73-87. doi: 10.1016/j.jhazmat.2008.01.052 [Crossref] [ Google Scholar]
- Aremu MO, Arinkoola AO, Olowonyo IA, Salam KK. Improved phenol sequestration from aqueous solution using silver nanoparticle modified Palm Kernel Shell Activated Carbon. Heliyon 2020; 6(7):e04492. doi: 10.1016/j.heliyon.2020.e04492 [Crossref] [ Google Scholar]
- Dada AO, Adekola FA, Odebunmi EO, Ogunlaja AS, Bello OS. Two-three parameters isotherm modeling, kinetics with statistical validity, desorption and thermodynamic studies of adsorption of Cu(II) ions onto zerovalent iron nanoparticles. Sci Rep 2021; 11(1):16454. doi: 10.1038/s41598-021-95090-8 [Crossref] [ Google Scholar]
- DrugBank. DrugBank Database. DrugBank; 2023. Available from: https://go.drugbank.com/.
- Arinkoola A, Alagbe S, Akinwole I, Ogundiran A, Ajayi L, Agbede O. Adsorptive removal of ibuprofen, ketoprofen and naproxen from aqueous solution using coconut shell biomass. Environ Res Eng Manag 2022; 78(2):28-37. doi: 10.5755/j01.erem.78.2.29695 [Crossref] [ Google Scholar]
- Boukhelkhal A, Benkortbi O, Hamadache M, Ghalem N, Hanini S, Amrane A. Adsorptive removal of amoxicillin from wastewater using wheat grains: equilibrium, kinetic, thermodynamic studies and mass transfer. Desalin Water Treat 2016; 57(56):27035-47. doi: 10.1080/19443994.2016.1166991 [Crossref] [ Google Scholar]
- Bello OS, Moshood MA, Ewetumo BA, Afolabi IC. Ibuprofen removal using coconut husk activated biomass. Chem Data Collect 2020; 29:100533. doi: 10.1016/j.cdc.2020.100533 [Crossref] [ Google Scholar]
- Latinwo GK, Alade AO, Agarry SE, Dada EO. Process optimization and modeling the adsorption of polycyclic aromatic-Congo red dye onto Delonix regia pod-derived activated carbon. Polycyclic Aromatic Compounds 2021; 41(2):400-18. doi: 10.1080/10406638.2019.1591467 [Crossref] [ Google Scholar]
- Alade AO, Amuda OS, Ogunleye OO, Okoya AA. Evaluation of interaction of carbonization temperatures and concentrations on the adsorption capacities and removal efficiencies of activated carbons using response surface methodology (RSM). J Bioremediat Biodegrad 2012; 3(1):134. doi: 10.4172/2155-6199.1000134 [Crossref] [ Google Scholar]
- Noshadi I, Amin NAS, Parnas RS. Continuous production of biodiesel from waste cooking oil in a reactive distillation column catalyzed by solid heteropolyacid: optimization using response surface methodology (RSM). Fuel 2012; 94:156-64. doi: 10.1016/j.fuel.2011.10.018 [Crossref] [ Google Scholar]
- Srivastava VC, Swamy MM, Mall ID, Prasad B, Mishra IM. Adsorptive removal of phenol by bagasse fly ash and activated carbon: equilibrium, kinetics and thermodynamics. Colloids Surf A Physicochem Eng Asp 2006; 272(1):89-104. doi: 10.1016/j.colsurfa.2005.07.016 [Crossref] [ Google Scholar]
- Samarghandi MR, Asgari G, Shokoohi R, Dargahi A, Arabkouhsar A. Removing amoxicillin antibiotic from aqueous solutions by Saccharomyces cerevisiae bioadsorbent: kinetic, thermodynamic and isotherm studies. Desalin Water Treat 2019; 152:306-15. doi: 10.5004/dwt.2019.23941 [Crossref] [ Google Scholar]
- Del Vecchio P, Haro NK, Souza FS, Marcílio NR, Féris LA. Ampicillin removal by adsorption onto activated carbon: kinetics, equilibrium and thermodynamics. Water Sci Technol 2019; 79(10):2013-21. doi: 10.2166/wst.2019.205 [Crossref] [ Google Scholar]
- Li X, Zhang N, Yang L. Adsorption of ampicillin sodium on activated carbons with different surface chemistries. IOP Conf Ser Earth Environ Sci 2020; 467(1):012184. doi: 10.1088/1755-1315/467/1/012184 [Crossref] [ Google Scholar]
- Huízar-Félix AM, Aguilar-Flores C, Martínez-de-la Cruz A, Barandiarán JM, Sepúlveda-Guzmán S, Cruz-Silva R. Removal of tetracycline pollutants by adsorption and magnetic separation using reduced graphene oxide decorated with α-Fe₂O₃ nanoparticles. Nanomaterials (Basel) 2019; 9(3):313. doi: 10.3390/nano9030313 [Crossref] [ Google Scholar]
- Jannat Abadi MH, Nouri SMM, Zhiani R, Heydarzadeh HD, Motavalizadehkakhky A. Removal of tetracycline from aqueous solution using Fe-doped zeolite. Int J Ind Chem 2019; 10(4):291-300. doi: 10.1007/s40090-019-0191-6 [Crossref] [ Google Scholar]
- Rahman N, Varshney P. Assessment of ampicillin removal efficiency from aqueous solution by polydopamine/zirconium(iv) iodate: optimization by response surface methodology. RSC Adv 2020; 10(34):20322-37. doi: 10.1039/d0ra02061c [Crossref] [ Google Scholar]
- Foo KY, Hameed BH. Insights into the modeling of adsorption isotherm systems. Chem Eng J 2010; 156(1):2-10. doi: 10.1016/j.cej.2009.09.013 [Crossref] [ Google Scholar]
- Ayawei N, Ebelegi AN, Wankasi D. Modelling and interpretation of adsorption isotherms. J Chem 2017; 2017:3039817. doi: 10.1155/2017/3039817 [Crossref] [ Google Scholar]
- Chu KH. The Kiselev isotherm for adsorption at the liquid-solid interface: solving the mystery of negative equilibrium constants. J Mol Liq 2021; 343:117674. doi: 10.1016/j.molliq.2021.117674 [Crossref] [ Google Scholar]
- Hamdaoui O, Naffrechoux E. Modeling of adsorption isotherms of phenol and chlorophenols onto granular activated carbon Part I Two-parameter models and equations allowing determination of thermodynamic parameters. J Hazard Mater 2007; 147(1-2):381-94. doi: 10.1016/j.jhazmat.2007.01.021 [Crossref] [ Google Scholar]
- de Boer JH. The Dynamical Character of Adsorption. LWW; 1953. 10.1002/ange.19530651619.
- Gubernak M, Zapala W, Kaczmarski K. Analysis of amylbenzene adsorption equilibria on an RP-18e chromatographic column. Acta Chromatogr. 2003(13):38-59.