Avicenna J Environ Health Eng. 8(2):61-73.
doi: 10.34172/ajehe.2021.09
Original Article
Lignocellulose Nanofiber Media for the Enhanced Removal of Copper From Aqueous Solutions
Saeedeh Rastegar 1, *  , Mansoor Ghaffari 2, Homa Hoseini 3
Author information:
1Department of Environmental Sciences, Faculty of Fisheries and Environmental Sciences, Gorgan University of Agricultural Sciences and Natural Recourses, Environmental Sciences, Gorgan, Iran
2Department of Wood, Imam Khomeini Technical and Vocational School, Aliabad Katoul, Golestan Technical and Vocational University, Iran
3Department of Environmental Pollution, Baharan Higher Education Institute, Gorgan, Iran
Abstract
Nowadays, the entry of heavy metals entry into aqueous environments has jeopardized the health of human societies. The experiment was conducted in discontinuous conditions, and the study focused on examining the effect of five parameters including initial concentration, temperature, contact time, pH, and adsorbent dose on the adsorption of Cu heavy metals. In addition, the two-parameter models of Langmuir, Freundlich, Temkin, and Dubinin-Radushkevich were studied and compared to evaluate isothermal absorption. The highest correlation coefficients were obtained for Freundlich (0.969) and Dubinin-Radushkevich (0.9603) models. Finally, thermodynamic parameters such as enthalpy and entropy changes and Gibbs-free energy were calculated as well. The pH parameters, adsorption dose, contact time, temperature, and initial Cu concentrations in the discontinuous system had a statistically significant effect on the adsorption process. The results showed that the maximum efficiency of Cu adsorption by Lignocellulose nanofiber (LCNF) occurred at the pH of 6, contact time of 60 minutes, the ambient temperature of 25°C, and adsorption dose of 0.2 g. In the case of adsorption kinetics, the pseudo-second order model and intra-particle diffusion had more fitness with the experimental data indicating a chemical equilibrium between the adsorbate and the absorbent. Thermodynamic studies demonstrated that the process (negative ∆G) is spontaneous (negative ∆G), endothermic (negative ∆H), and non-random (positive ∆S). Thus, LCNF can be used as an effective adsorbent in the removal of metals by having an extremely high surface area.
Keywords: Copper, Adsorption, LCNF, Isotherm, Kinetics, Thermodynamics
Copyright and License Information
© 2021 The Author(s); Published by Hamadan University of Medical Sciences.
This is an open-access article distributed under the terms of the Creative Commons Attribution License (
http://creativecommons.org/licenses/by/4.0), which permits unrestricted use, distribution, and reproduction in any medium provided the original work is properly cited.
1. Introduction
Nowadays, one of the environmental concerns is the release of the existing heavy metals in groundwater and industrial wastewater, which is mainly due to industrial development and population growth. Sewage containing heavy metals is highly restricted in many countries given its high toxicity for discharge in the environment (1). Upon the entry of the pollutants into the environment, the ones that are structurally similar to natural compounds are decomposed by organisms in the environment or by physicochemical agents (2). Many pollutants are slowly decomposed and remain in the environment (3). Heavy metals affect the physicochemical properties of the soil and its biological activity and harm human health by entering the food chain (4). Indeed, heavy metals are about 40 elements, have a density higher than 5 g/cm3, and are considered as the natural materials of the earth’s crust, which are the metals with environmental effects in chemical science. These metals are highly stable and non-biodegradable (5). In addition, they are of the first-class pollutants of toxicity B according to the Environmental Protection Agency classification, meaning that they are environmentally hazardous and harmful to human health. The presence of most of these metals in aquatic environments leads to problems in the biological processes of living cells and disrupts metabolic processes as well (4). Moreover, they can accumulate in aquatic organisms and enter various food levels, and are toxic to living organisms and humans (6). Contact with heavy metals causes problems for humans, including neurological disorders, cellular aging, liver and kidney failure, and cancer. Heavy metals are mainly lead (Pb), nickel, cobalt, copper (Cu), chromium (Cr), cadmium (Cd), zinc, mercury, and arsenic (7).
Cu is one of these metals and is widely used in electricity, fertilizer, wood production, pigmentation, cardboard and pulp factories, textile, and battery industries (8). Unlike organic pollutants, this metal is non-biodegradable and can lead to serious environmental and public health problems such as anemia, bone changes, and stomach and intestinal, respiratory, liver, and kidney problems. It can further cause vomiting, muscle cramps, seizures, and even death thus its removal from aqueous sources is critical (9).
Different approaches have been suggested for the recycling of heavy metals from wastewater, including chemical filtration, membrane processes, electrochemical treatment, ion exchange, evaporation, reverse osmosis, and coagulation (10). Of the most important disadvantages of the above-mentioned methods are their high cost and the production of secondary effluents. Nowadays, using the adsorption method with all kinds of adsorbents is on the agenda as the best available method for wastewater treatment because of its cost-effectiveness, selective adsorption capability, metal regeneration and recovery capability, relatively high process speed, and non-production of sludge (11). Among various adsorbents, biopolymers have been considered as a means of absorbing heavy elements given their availability, environmental friendliness, and non-toxicity. Cellulose is the most abundant biomaterial and natural regenerating polymer (12). Lignocellulose nanofiber (LCNF) is composed of cellulose, hemicellulose, and lignin, and its raw materials include wood and other lignocellulose residues (e.g., wheat straw, rice straw, and sugarcane bagasse). This study used LCNF to remove Cu ions from aqueous solutions. The advantages of this adsorbent over other adsorbents are specific surface area and ease of separation from the soluble phase (13).
Unfortunately, the main problem in using nanoparticles and powder adsorbents is their difficulty to be separated from the solution given the small size of the particles. Thus, the fibrillation of nanoparticles can be a good solution to many of these problems (14). It is necessary to be familiar with the concepts of isothermal equilibrium and kinetic and thermodynamic adsorption to comprehensively study the adsorption reaction of heavy metals in water. Various researchers in the field of heavy metal adsorption have studied isothermal, kinetic, and thermodynamic adsorption using biopolymers. For example, (15) applied lignocellulose to remove arsenic. The results of isothermal, kinetic, and thermodynamic adsorption studies showed that the data were more in line with Langmuir, second-order kinetics isotherm, and were exothermic reactions (16). Likewise, Deshmukh et al used the prepared lignocellulose from banana peel to remove Cd and examined kinetics, thermodynamics, and isothermal absorption in this regard. The data were more in conformity with Langmuir’s isothermal pseudo-second order isotherm. The results of thermodynamic studies revealed that their experiments were endothermic and spontaneous (17). Similarly, Asadollahfardi et al studied the adsorption and behavior of nanofiber in the removal of Cu from the aqueous solution and found that the absorption of Cu by nanofiber depends on pH, adsorbent content, Cu ions, contact time, and temperature, and this adsorbent had a high ability to remove this contaminant (18). In another study, Abiaziem et al used cellulose nanocrystals to remove Pb and examined kinetics and thermodynamic and adsorption isotherm. The data further corroborated with Elovich kinetic, Langmuir, and Freundlich isotherms, and the reaction was endothermic (19). Wen et al also removed Cd using lignocellulose and reported the high ability of the adsorbent to remove this metal due to the high absorption capacity of this adsorbent (10). Moreover, Sun et al removed Cu using lignin. The results of the evaluation of isothermal, kinetic models represented that the data were more in line with Freundlich’s isothermal kinetics (20).
The purpose of the current study was to examine the effectiveness of heavy metal removal using LCNF adsorbent and to study the three important topics of isotherm, kinetics, and thermodynamics to perfectly understand the process of Cu adsorption using LCNF adsorbent and to study the effect of various exploitation parameters such as pH on the adsorption process.
2. Materials and Methods
2.1. Materials and the Applied Device
Cu nitrate 6H2O.Cu(NO3)2 was used to prepare the synthetic sample, and hydrochloric acid and sodium hydroxide were employed to regulate pH, all of which had Laboratory grade and were obtained from Merck Company, Germany. The atomic absorption spectrophotometer device (Unicam-919) and pH meter (AZ 86552) were applied to obtain the concentration of Cu in solution and to measure the pH level, respectively. Furthermore, the incubator shaker (model IKA KS 4000 ic, Germany), according to the examined parameters, was utilized for mixing the adsorbent and adsorbate, and centrifuge (HERMLE Z300) for mixing. Fourier-transform infrared spectroscopy (FTIR) device (WQF-520) was used for spectroscopy and detection of molecules and functional groups. A Japanese FEI NOVA Nano SEM 450 FESI Electronic Field Microscope and transmission electron microscopy (TEM) analysis were applied to determine the LCNF structure and the LCNF size distribution and its characteristics, respectively.
2.2. Preparing Nano-Adsorbent
Production was performed in a start-up company, called Nano Novin Polymer Company. First, lignocellulose paste, prepared from beech trees, was provided from unpainted cellulose fibers (including lignin and hemicellulose) from Mazandaran Wood and Paper Company. The paste was washed several times with water, and then the suspension was prepared with a concentration of 1% lignocellulose fiber and passed twice through the MCCA6-3 (Masuko Sangyo Company, Ltd., Japan) to prepare LCNF. The disc milling machine had two grinding discs (one fixed and one rotating disc). The fibers were produced by the shear and compressive forces of LCNF (Fig. 1) while passing through the two discs (21,22).
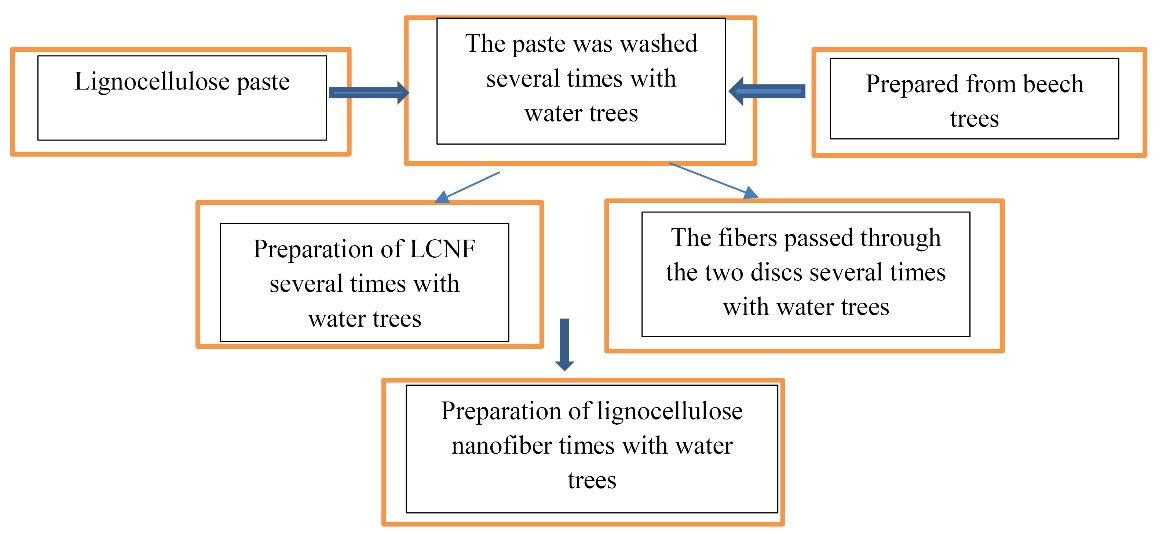
Figure 1.
Schematic Picture of the Steps of Preparing LCNF. Note. LCNF: Lignocellulose nanofiber.
.
Schematic Picture of the Steps of Preparing LCNF. Note. LCNF: Lignocellulose nanofiber.
2.3. General Cu Adsorption Test
Cu adsorption test was performed using LCNF adsorbent discontinuously and on a laboratory scale. Initially, 0.1 m/L sodium hydroxide and 0.1 m/L hydrochloric acid were used to regulate the pH level. Then, the stoke solution (1000 m/L) was prepared twice from ionized Cu salt in distilled water, and the other required metal solutions for subsequent experiments were prepared from this solution. To examine the effects of pH, time, temperature, the adsorbent dose, and the initial concentration of Cu using the laboratory method one factor at a time, 100 mL of metal solution was prepared in an Erlenmeyer flask 250 and then a certain amount of adsorbent was added to each Erlenmeyer flask and placed on the shaker. At the end of the reaction time, the adsorbent was separated from the solution by a centrifuge at 4000 rpm for 5 minutes. The upper liquid phase of the vessel was then removed and an atomic absorption device was applied to determine the amount of the absorbed metal. All absorption tests were conducted in the discontinuous system. The effect of each parameter in all stages of the experiment was examined by changing the desired parameter and considering other parameters. Different conditions and factors affecting the adsorption process were evaluated, including the initial concentration (5-50 m/L), pH (4-8), adsorbent dose (0.1-0.5 g), temperature (15-40°C), and time (15-120 minutes). Other factors were kept constant under optimal conditions (pH: 6, temperature: 25°C, time: 60 minutes, Cu concentration: 10 m/L and 0.2 adsorbent) for a better comparison of the effect of the examined factors. At the end of each experiment, the percentages of Cu removal and its absorption dose (mg/g) were calculated using the (equations 1) and (2). In addition, the percentage of the removal and the capacity of Cu absorption in equilibrium by LCNF were computed by (Eqs.1) and (2, respectively (7,8).
(1)
where qe shows the absorbed metal ions per unit of adsorbent mass in milligrams per gram and Co indicates the initial concentration of the metal before adsorption in milligrams per liter. Further, Ce and V denote the concentration of the residual metal in the solution at equilibrium after adsorption in milligrams per gram and the volume of the solution per liter, respectively. Finally, M is the mass of the adsorbent per gram. It should be noted that all experiments were repeated three times and the mean data and results were used for analysis (9).
2.4. Method of Examining Isotherm Absorption
A Cu solution with an initial concentration of 10 m/L was made to examine the adsorption isothermal. At this phase, the pH of the solutions was set to 6. LCNF was added to each of the adsorbent solutions (0.1, 0.2, 0.3, 0.4, and 0.5 g) and then was stirred at 25 °C inside the shaker for 60 minutes. Finally, the Erlenmeyer flasks were removed from the incubator shaker (4000 rpm and 5 minutes) using a two-phase centrifuge. The residual heavy metal solution was measured by an atomic absorption device. Laboratory data were matched with the two-parameter models Langmuir, Freundlich, and Temkin, and Dubinin-Radushkevich. Table 1 presents the formula for all the studied models with their constant coefficients. In Langmuir’s isothermal model, it is assumed that adsorbate only interacts with a limited number of uniformly adsorbed sites, and that adsorption is limited to only one surface on the surface (7). The basic feature of the Langmuir isotherm is shown by a unitless constant called the equilibrium parameter (RL) and is represented by (Eq.3) as follows:
Table 1.
Constant Coefficients of Isothermal Copper Absorption Models
|
Isotherm Type
|
Main Equation
|
Linear Form
|
Introduction of Constant Coefficients
|
References
|
| Freundlich |
|
|
kf: Freundlich constant, indicating adsorption capacity ((mg/g)(L.g)1/n)8 |
(16) |
| n: Freundlich constant, indicating the intensity of absorption |
| Langmuir |
|
|
Ce: The final concentration of adsorbate in the solution after equilibrium (m/L) |
(17) |
| qe: adsorbate value at equiibrium (mg/g) |
| qm: absorption capacity (mg/g) |
| b: Langmuir constant (L/mg) |
| Temkin |
|
|
BT: Temkin isotherm constant (kJ/moL) |
(18) |
| AT: bind constant, indicating the maximum bond energy (L/g) |
Dubinin-
Radushkevich |
|
|
e :Potential Poulain adsorption (KJ2/moL) |
(18) |
| B: Average free energy absorption (moL2/kj2) |
| R: Gas constant (J/moL1.k1) |
| T: Temperature (k) |
where 1 <RL, RL = 1, 0 <RL <1, and RL = 0 indicate undesirable, linear, 1optimal, and irreversible isotherms, respectively (11). Freundlich is based on multi-layered adsorption on heterogeneous surfaces and heterogeneous distribution of energy on active adsorbent sites (12). Dubinin-Radushkevich model is usually used to determine the nature and characteristics of the process of absorption and to measure free energy. If the obtained free energy (E) from this model according to Kj/mol is less than 8, the absorption is of the physical type and is due to the weak forces of wonderwalls, and if it is in the range of 8-16, metal ions are absorbed by the adsorbent with ion exchange mechanism. Adsorption is chemical when E is between 20 and 40 (13). In Temkin isothermal absorption model, the positive or negative values of BT show that the adsorption process is exothermic or endothermic (14).
2.5. Method of Kinetic Study of Cu Absorption
For studying adsorption kinetics, time was considered varying while other parameters were constant. The Pb solution was made with an initial concentration of 10 m/L and the pH of the solutions was set to 6. Then, 0.2 g of LCNF was added to each of the solutions and stirred at a temperature of 25°C inside the shaker-incubator (4000 rpm and 5 minutes) for a period of time (15, 30, 60, 90, and 120 minutes). At the end of the desired time, the applied flasks were removed from the shaker-incubator and made double-phase using a centrifuge. The residual heavy metal solution was measured by an atomic absorption device. The pseudo-first and pseudo-second order models were obtained from the data of this section. Table 2 provides the models with their constant coefficients. The adsorbent kinetic models can be divided into reaction- and permeability-based models. Reactive models (e.g., pseudo-first and pseudo-second order models) were used in the current study, and permeability-based models were intra-particle diffraction and Elovich models. According to Putro et al (20), the pseudo-first order equation is based on adsorbent capacity and is used when adsorption occurs through the penetration process from within a boundary layer (physical adsorption). However, the pseudo-second order kinetic equation shows that chemical adsorption has been the dominant and controlling process (21). Elovich’s kinetic model relies on the adsorption capacity of the adsorbent and is more applicable to kinetic chemical adsorbents and systems with heterogeneous levels (22). Intra-particle diffusion is one of the permeability-based synthetic models that is used to describe the penetration of soluble molecules into the interior of solid particles and competitive absorption (23,24).
Table 2.
Synthetic Copper Absorption Models
|
Isotherm Type
|
Main Equation
|
Linear Form
|
Introduction of Constant Coefficients
|
References
|
| Pseudo-first order |
|
|
K0: Constant of absorption rate of pseudo-first order modeL (g/mg min) |
(24) |
| qe: The pollutant absorbed during equiLibrium (mg/g) |
| K1: Constant rate of pseudo-first order absorption model (min-1) |
| Pseudo-second order |
|
|
K2: constant absorption rate of pseudo-second order modeL (g mg/Min) |
(25) |
| Elovich |
|
|
α: Initial absorption rate (mg g/min) |
(26) |
| B: Constant of desorption and activation energy in chemical reactions (g/mg) |
| Intra particle diffusion |
- |
|
C: The adsorbent boundary layer thickness (mg/g) |
(27) |
2.6. Thermodynamic Method of Absorption
A Cu solution with an initial concentration of 10 g/L was prepared to examine the elimination thermodynamics. At this step, the pH of the solutions was adjusted to the optimal level. Then, 0.2 g of LCNF was added to each of the Cu solutions and stirred at room temperature (15, 20, 25, 30, and 40ºC) inside the shaker-incubator for 60 minutes. Finally, the Erlenmeyer flasks were removed from the shaker-incubator and centrifuged at 4000 rpm for 5 minutes and the solutions were prepared for measurement. Thermodynamic data were obtained from the data of this section. To determine the thermodynamic parameters, the values of T/1 were plotted against Ln kC. The resulting slope shows the value of ∆HO in terms of kilojoules per mole and the width of the source, indicating parameter ∆S° in terms of kilojoules per mole. After drawing the curve and calculating ∆HO and ∆S°, the adsorption process was spontaneous and exothermic or endothermic (25,26). The three thermodynamic parameters for determining the adsorption process are standard free energy (∆G), standard enthalpy (∆H◦), and standard entropy (∆S◦). The thermodynamics of the adsorption of Cu by LCNF and related parameters are as follows (27,28), and thermodynamic values were obtained using Eqs.4-6 as follows:
∆G0 shows the standard free energy changes in J/mol.K. ∆H◦ and ∆S◦ represent enthalpy and entropy, respectively, in J/mol.K; R shows gas constant in terms of 314 J/mol.K; T denotes the absolute temperature in terms of Kelvin; and finally, Kc indicates equilibrium and scaleless stability (29).
2.7. Data Analysis
The values of R and qe were removed in the percentage formulas, and equilibrium absorption capacity and other unknown values were calculated in Excel software. Sigma Plot were used to plot the graphs, to determine the adaptation degree of the adsorption process data with the equations of the adsorption temperature, and to examine the significant effect of pH, temperature, initial Cu concentration, contact time, and adsorption dose on Cu absorption in the aqueous solution of kinetic and thermodynamic equations.
3. Results and Discussion
3.1. The Adsorbent Analysis With FTIR
FTIR was used to study the chemical structure and functional groups. Fig. 2 displays the FTIR spectra before and after the absorption of Cu heavy metals. Fig. 2a shows the FTIR spectra related to LCNF prior to adsorption and Fig. 2b depicts adsorption. As shown, the wide cm-1 courier 3444.24 belongs to the O-H factor group (29). The weak peak at 2925.48 cm-1 can be related to the C-H bending vibration due to the presence of alkynes and alkanes in the fibers (28). The next strong bond (1635.34 cm-1) can be attributed to the C = O tensile vibration in ketones, aldehydes, or carboxyls (21). The peak at 1060.66 cm-1 is associated with the flexural C-O factor group (9). The weak bands of 2372.01 cm-1 changed after the absorption of Cu ions into the cm-1 band. According to these peaks, carboxylic acid and nitrile are the functional groups involved in the absorption of Pb.
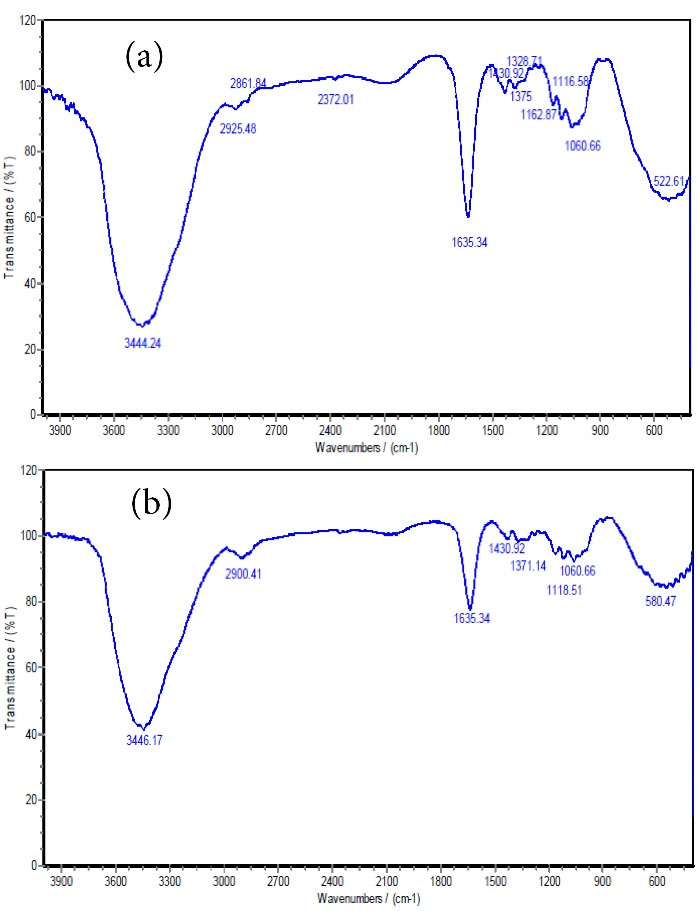
Figure 2.
FTIR Spectra of the LCNF Adsorbent Before (a) and After (b) Copper Adsorption.
Note. FTIR: Fourier-transform infrared spectroscopy; LCNF: Lignocellulose nanofiber.
.
FTIR Spectra of the LCNF Adsorbent Before (a) and After (b) Copper Adsorption.
Note. FTIR: Fourier-transform infrared spectroscopy; LCNF: Lignocellulose nanofiber.
3.2. FE-SEM Image of the Adsorbent
FESEM was used to evaluate the appearance and to determine the particle shape, porosity, and particle size distribution. Fig. 3 illustrates field emission scanning electron microscope (FE-SEM) before and after LCNF. The porous structure shows the high adsorption property of this adsorbent.
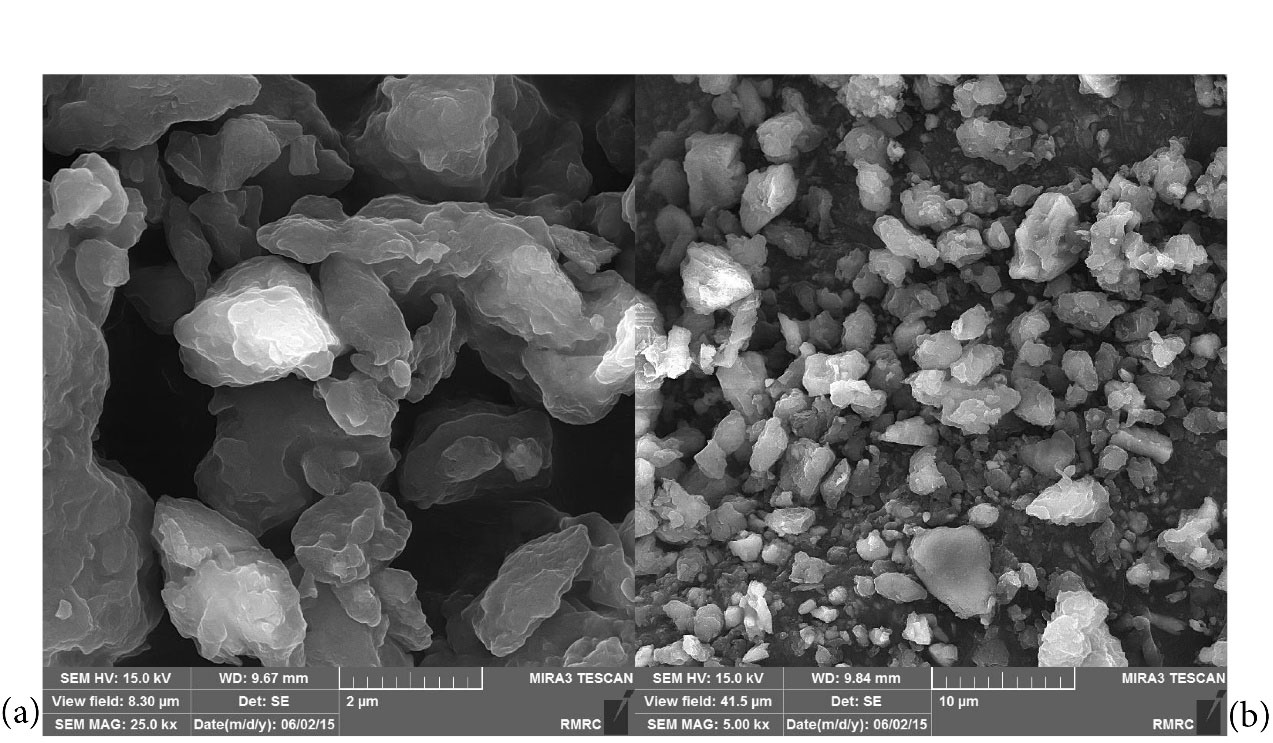
Figure 3.
Images of LCNF at Different Magnifications After the Absorption of the Heavy Metal of Copper
Note. LCNF: Lignocellulose nanofiber.
.
Images of LCNF at Different Magnifications After the Absorption of the Heavy Metal of Copper
Note. LCNF: Lignocellulose nanofiber.
3.3. TEM images
Fig. 4 displays the TEM image obtained from LCNF. As shown, the applied material has a diameter of less than 100 nanometers (nanometer range) and a fibrous and lattice structure. The average diameter of LCNF was 65 ± 10 nm.
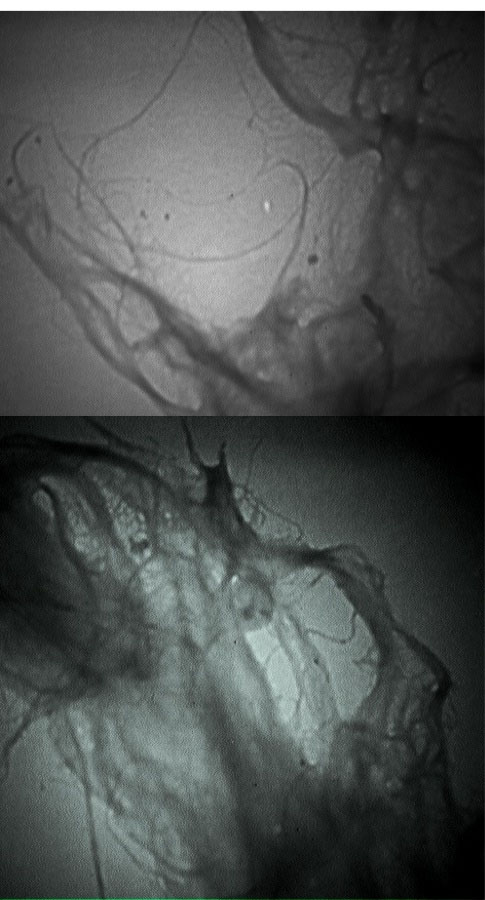
Figure 4.
TEM Image of LCNF. Note. FEM: Finite element method; LCNF: Lignocellulose nanofiber.
.
TEM Image of LCNF. Note. FEM: Finite element method; LCNF: Lignocellulose nanofiber.
3.4. The Effect of pH Changes on Absorption
Fig. 5 depicts the change chart rate of return efficiency and absorption capacity with changes in the pH range. In this experiment, the interval between pH changes for Cu was considered to be 4-8. The minimum capacity and efficiency of removal were 6.67 mg/g and 67.2%, respectively, and were obtained at the pH of 4, which was the competition between positive H ions and metal ions to bind to the adsorbent surface (29). As the pH increased from 4 to 6, a negative charge was observed in the basic functional groups (carboxylate and phosphate) of the cell wall, which increased the absorption of Cu cation. Carboxylate and phosphate groups are the resulting negative carrier groups (30). Increased absorption with an increase in pH, due to the availability of negatively charged groups, was at the adsorbent level in the metal absorption process (10) so that at a pH of 6, the yields were eliminated and the adsorption capacity reached 99.3% and 9.93 mg/g, respectively. Then, efficiency and adsorption capacity decreased at pH values of 7 and 8 because of the alkalinity of the environment by increasing the pH of the solution and the OH-solution, leading to metal deposition and reduced adsorption (15). Indeed, studying Cu removal showed an increasing trend in the range of 4-6 while a decrease in the range of 6-8. Ultimately, absorption capacity and removal percentage were directly related to the increase and decrease of pH. Changes in the pH value are highly effective on the chemical activity of the metal ions in the solution, as well as the activity of the base groups and the competition of the metal ions (6). Zhang et al used Cr nanofibers to remove Cr and observed that the optimal Cr adsorption rate in the pH range was 5 to 8 and Cr removal decreased by increasing pH to 8. The adsorption decreased due to the presence of repulsive force between Cr and adsorbent, which has a negative charge. In addition, adsorption was better in alkaline pH, and the adsorption rate decreased in acidic pH (5), which is consistent with the results of this study. In another study, Ji et al evaluated the effect of pH on the Cu removal of nanofibersol Cu and found that the appropriate pH value for Cu removal was in the alkaline range (12). In pH above 7, it precipitated as hydroxide and the percentage of Cu removal decreased in acidic pH (12), which is in line with the results of the current study. Likewise, Akhtar et al examined the removal of organic pollutants by lignocellulose from aqueous solutions and reported that the highest adsorption was at neutral pH (4), which corroborates with the removal results of the present study.
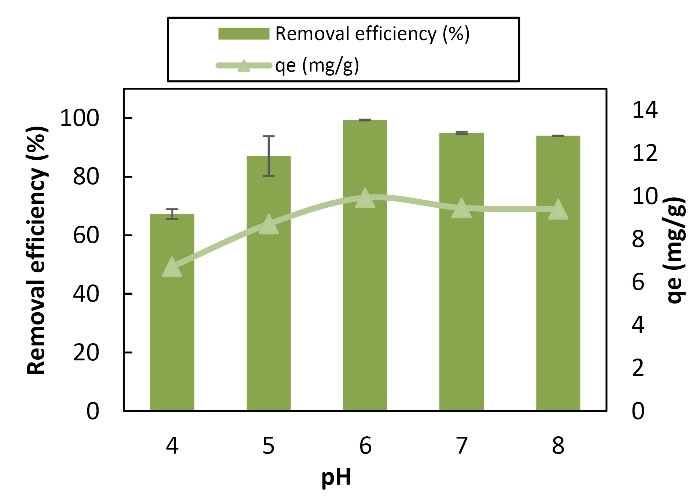
Figure 5.
Graph of the Effect of pH Changes on Copper Adsorption by Lignocellulose Nanofibers (100 mL of 10 mg/L Solution of Copper in Contact With 0.2 mg Adsorbent at 25°C, 60 Minutes).
.
Graph of the Effect of pH Changes on Copper Adsorption by Lignocellulose Nanofibers (100 mL of 10 mg/L Solution of Copper in Contact With 0.2 mg Adsorbent at 25°C, 60 Minutes).
3.5. The Effect of Contact Time on Absorption
Contact time is an effective parameter in the absorption of heavy metals. Fig. 6 displays the variable yield chart and the Cu absorption capacity with time range changes (5-90 minutes). As shown, the absorption rate was high in the early times so that 82.9% and 98.55% of Cu were separated from the solution in the first 5 and 15 minutes, respectively. Moreover, in the first 30 minutes, the absorption reaction rate increased significantly over time, and then the increase in the absorption rate further increased an hour later. With an increase in time from 5 to 60 minutes, the elimination efficiency and absorption capacity increased from 82.9 to 99.95 and 41.45 to 49.975, respectively. As the elimination efficiency was 3.99 in the first 30 minutes, the absorption rate in this experiment was high. This could be due to the completion of the adsorption capacity of the adsorbent; as with the saturation of the adsorbent, metal adsorption from the solution decreased, and the two solid and liquid phases almost reached equilibrium (4). Efficiency and absorption capacity increased over time while absorption intensity represented a reduction. The entry rate of the metal ion into the adsorbent surface and the return rate of the ion from the solid fiber surface to the solution were equalized in this case. In other words, the adsorption on the adsorbent surface was quickly performed in the first stage since most of the adsorbent sites were empty (14). However, with the passage of time and the gradual filling of these sites, the penetration of the metal ion through the absorbed ions and the connection to empty surfaces slowed down the absorption process (17). Ultimately, the increase in time was directly related to the efficiency of Cu removal and absorption capacity. Zhang et al also examined the effect of contact time on Pb and Cd removal by adsorption with nanofibers and concluded that the maximum adsorption rate was 60 minutes and the adsorption rate increased by increasing contact time (23), which conforms to the results of this study. In their study, Feng et al investigated the effect of contact time on the percentage of Cr removal by nanofibers and that the highest absorption occurs in 60 minutes, the absorption rate increased by an increase in duration (15), which is consistent with the results of the present study.
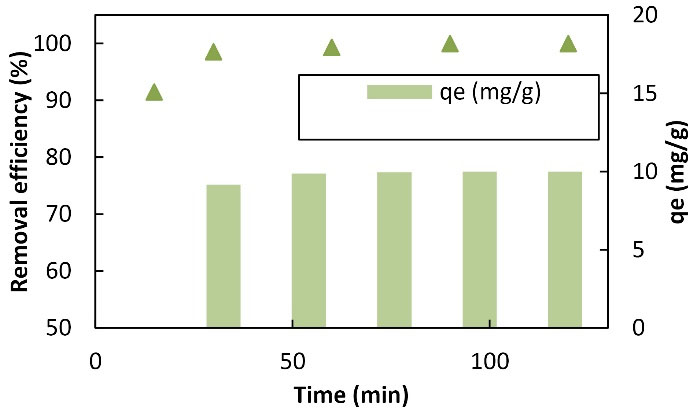
Figure 6.
Graph of the Effect of Time Changes on Copper Adsorption by LCNF: (100 mL of 10 mg/L the Solution of Copper Metal in Contact With 0.2 g of Adsorbent at a Temperature of 25 °C and a pH of 6). Note. LCNF: Lignocellulose nanofiber.
.
Graph of the Effect of Time Changes on Copper Adsorption by LCNF: (100 mL of 10 mg/L the Solution of Copper Metal in Contact With 0.2 g of Adsorbent at a Temperature of 25 °C and a pH of 6). Note. LCNF: Lignocellulose nanofiber.
3.6. The Effect of Adsorbent-Dose Changes
Experiments were performed to evaluate the effect of adsorbent on the adsorption process of Cu metal ions by the nanofibers of LCNF considering the adsorbent value, which can have the highest adsorption dose to determine the effective dose of adsorbent. Fig. 7 illustrates the efficiency and absorption capacity of Cu by changing the adsorbent dose. The effect of adsorption on adsorption was studied in the range of 0.1-0.5 g. Based on the data, the increase in adsorbent dose had a direct ratio with the efficiency of removal but with the adsorption capacity of the inverse ratio. By increasing the adsorbent from 0.1 to 0.5 g, the adsorption efficiency increased from 99.3% to 99.65% while the adsorption capacity decreased from 9.93 to 1.999 mg. An increase in adsorbent increased the available adsorption sites, causing an increase in the adsorbed metal. Decreased adsorption capacity increased by an increase in adsorption, mainly due to the unsaturation of adsorption sites during the adsorption process and the accumulation of particles in high amounts. The least amount of adsorbent that can meet the needs should be selected in actual applications (4,27). Moradi et al used nanofibers to remove dye from aqueous environments and examined the effect of various values of adsorbent. They found that by an increase in adsorbent, the percentage of removal increased and reached its maximum value at 0.04 g, and since then it represented a decrease. Finally, the rate of elimination percentage decreased (8), which is in line with the findings of the current study. The amount of adsorption and the level of adsorption were high and the amount of Cd adsorption increased. However, the percentage of removal reduced by an increase in adsorbent, and the amount of the removed Cd from the effluent demonstrated slight changes. Conversely, their collisions and density increased, which eventually decreased the level of adsorbent contact with the solution. Further, the removal percentage decreased by a reduction in the level (19). In another study, Fiol et al evaluated the removal of Cu by nanofibers and found that adsorption capacity decreased by increasing adsorbent dose but the percentage of removal increased by an increase in adsorption (14), which is consistent with the results of the present study.
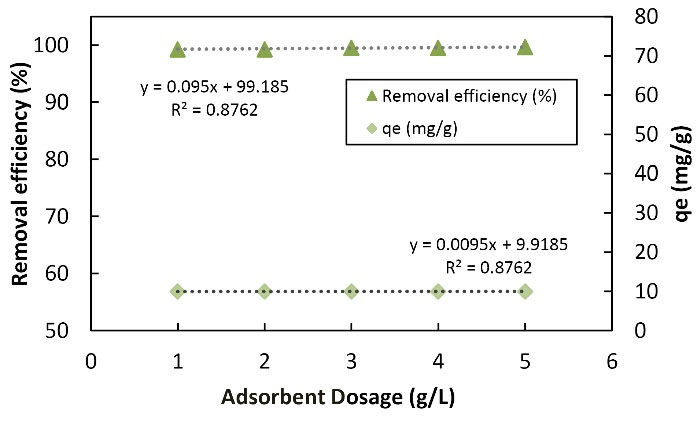
Figure 7.
The Effect of Changes in the Adsorbent Concentration of the Nanofibers of LCNF on Adsorption of Copper (100 mL of 100 mg/L Metal Solution in Contact With Different Adsorbent Concentrations at 25 °C and a pH of 6). Note. LCNF: Lignocellulose nanofiber.
.
The Effect of Changes in the Adsorbent Concentration of the Nanofibers of LCNF on Adsorption of Copper (100 mL of 100 mg/L Metal Solution in Contact With Different Adsorbent Concentrations at 25 °C and a pH of 6). Note. LCNF: Lignocellulose nanofiber.
3.7. The Effect of Changes in the Initial Concentration of the Metal in the Adsorption
Fig. 8 displays the effect of changes in the initial Cu concentration on the adsorption efficiency and Cu adsorption capacity by LCNF. The changes in Cu concentration from 5 to 50 mg/L were investigated in this section. With an increase in the initial concentration of adsorption efficiency, it decreased from 99.4% to 97.31% and the adsorption capacity increased from 4.97 to 48.655 mg/g. Indeed, the maximum removal rate of Cu at a concentration of 5 mg/L was the highest efficiency of removal (99.4%) while the lowest rate of absorption capacity was 4.97 mg/g. At the concentration of 50 mg/L, the lowest removal efficiency was 97.31 and the highest absorption capacity was 45.655 mg/g. Concentration changes from 5 to 50 mg/L were examined as well. As the initial concentration of the metal increased, the adsorption rate increased to such an extent that extremely slight changes were observed and the solution showed saturation. In fact, the increase in the initial concentration of Cu had a negative effect on removal efficiency implying that the absorption efficiency decreases by an increase in the initial concentration of the pollutant, which is quite natural. In the heavy metal solution, the existence of other salts, anions, and cations affects the absorption rate. The existence of cations is more effective in the absorption of heavy metals compared to that of anions (19,20). However, some anions are effective in absorption as well. As the concentration of the metal increased, the absorption percentage demonstrated a decrease, but the Cu absorbed per unit of adsorbent mass indicated an increase. Based on the results, the groups of present agents on the adsorbent surface became saturated, and the ability of the adsorbent to absorb the metal decreased by an increase in the concentration of the metal. Ultimately, the efficiency of Cu removal decreased by an increase in the initial concentration of Cu while adsorption capacity represented an increase (8). More precisely, changes in the initial concentration of Cu were directly proportional to adsorption capacity but inversely proportional to the efficiency of Cu removal. Feng et al evaluated Cr removal by nanofibers, as well as the effect of concentration on removal percentage. They found that the removal percentage decreased by an increase in concentration, which activated active surfaces to absorb and limit the size of pores and electrostatic repulsion between positively absorbed charges, which was considered as the reason for this decrease (15), which is in line with the findings of the present study. Likewise, Dong et al studied the effect of contact time on the removal percentage of the heavy metal by nanofibers. They claimed that when the initial concentration of metals increased, the percentage of adsorption decreased while the adsorption capacity increased due to the saturation of the adsorbent surface (16), which is in conformity with the results of the current research. Similarly, Maaloul et al used cellulose to remove Cu. The percentage of removal decreased with an increase in the initial Cu concentration whereas the adsorption capacity increased by an increase in the initial concentration of Cu solution (17), which conforms to the results of the present study.
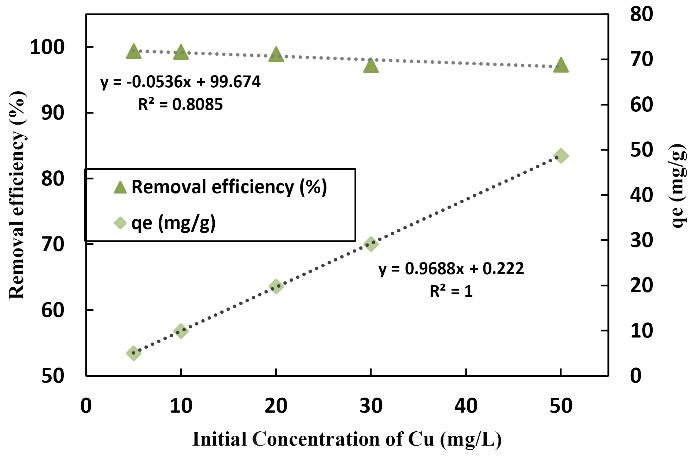
Figure 8.
The Graph of the Effect of Changes in the Initial Concentration of the Metal in Copper Adsorption by LCNF 100 mL of Metal Solution (10-50) mg/L in Contact With 0.2 g of Adsorbent at 25 °C and a pH of 6. Note. Cu: Copper; LCNF: Lignocellulose nanofiber.
.
The Graph of the Effect of Changes in the Initial Concentration of the Metal in Copper Adsorption by LCNF 100 mL of Metal Solution (10-50) mg/L in Contact With 0.2 g of Adsorbent at 25 °C and a pH of 6. Note. Cu: Copper; LCNF: Lignocellulose nanofiber.
3.8. Effect of Temperature Changes
Temperature is one of the important and effective parameters in the process of adsorption absorption because of its effect on the number of active sites on the adsorbent surface or due to its effect on the analysis molecules on the adsorbent surface. Moreover, temperature shows whether the process is endothermic or exothermic (10). Fig. 9 depicts the efficiency and absorption capacity of Cu with temperature changes. The increase in temperature from 15 to 25°C increased the absorption rate from 89.15% to 99.3%, and the absorption capacity increased from 8.915 to 9.93 mg/g. Additionally, the absorption rate and capacity increased from 99.3% to 95.65% and 9.93 to 9.565 mg/g by an increase in temperature from 25 to 40°C, respectively. The highest removal rate and absorption capacity occurred at 25°C (ambient temperature). With an increase in temperature, the removal percentage and absorption capacity increased, and the highest removal percentage and the maximum absorption capacity were 97.8% and 196 mg/g at 50°C, respectively. Based on the results, the absorption rate of heavy metal at low temperatures was extremely low and the highest metal removal occurred at 25-30°C. In addition, the rate of removal decreased at higher temperatures. Ultimately, the increase in temperature was directly related to the efficiency of removal and absorption capacity. Wakkel et al studied the effect of temperature on dye absorption by lignocellulose and concluded that dye absorption increased with an increase in temperature, showing good dye absorption at high temperatures because soluble interacting forces and adsorbent are stronger than the interacting forces between the solvent and the solvate. Moreover, the process of dye removal by lignocellulose was endothermic (18), which is in line with the research results of this study. In their study, Sayen et al investigated the removal of the antibiotic using lignocellulose. By examining the temperature in the range of 18-30°C, they found that the optimal temperature for the antibiotic removal by the adsorbent is the ambient temperature (19), which is consistent with the results of the current study.
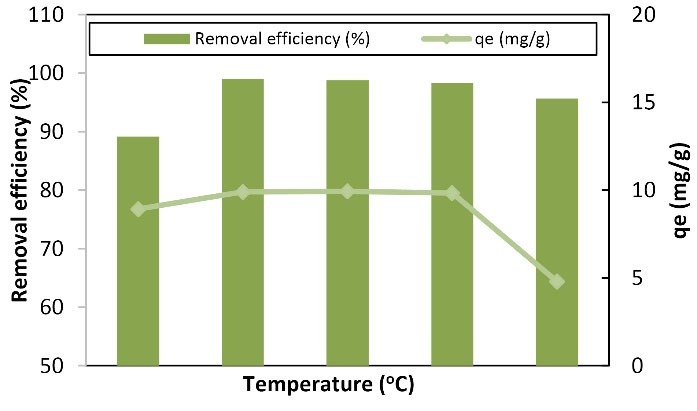
Figure 9.
Graph of the Effect of Temperature Changes on Copper Adsorption by LCNF: (100 mL of 10 mg/L Solution of Copper Metal in Contact With 0.2 g of Adsorbent at 60 Minutes and a pH of 6. Note. LCNF: Lignocellulose nanofiber.
.
Graph of the Effect of Temperature Changes on Copper Adsorption by LCNF: (100 mL of 10 mg/L Solution of Copper Metal in Contact With 0.2 g of Adsorbent at 60 Minutes and a pH of 6. Note. LCNF: Lignocellulose nanofiber.
3.9. Absorption Isotherm
By fitting the four models (i.e., Langmuir, Freundlich, Temkin, and Dubinin-Radushkevich isotherms) on the equilibrium data of adsorption, the results of the experimental studies of each model are provided in Table 3 and Fig. 10. Based on the plotted graphs, the correlation coefficients (R2) of the two-parameter models were obtained as 0.579, 0.969, 0.9603, and 0.9338 for Langmuir, Freundlich, Dubinin-Radushkevich, and Temkin, respectively. According to the correlation coefficients, Freundlich and Dubinin-Radushkevich isotherms had higher R2. Data following the Freundlich model revealed that Cu adsorption on the LCNF surface was heterogeneously and multi-layered (18). Moreover, all reactive sites on the LCNF surface have various absorption energies (29). In this study, the separation factor of Langmuir’s isotherm (RL = 0.1266) was between zero and one, which was the utility of the adsorption process. Data compliance with the Dubinin-Radushkevich model in this experiment is because of the greater closure of the cells of the adsorbent structure with the surface adsorption process and the reduction of the side effects on Cu uptake (26). The obtained E-value from the Dubinin-Radushkevich model was equal to 9.63 kJ/mol, and the absorption of Cu ions by LCNF adsorbent was performed by combining the ion exchange mechanism and physical absorption (12). The positive values (BT = +72.64) from the Temkin model showed the exothermic nature of the adsorption process (31). Similar studies have focused on evaluating the isotherm of adsorption on Cu removal. For instance, Putro et al used Nano cellulose to remove heavy metals from the effluent. Freundlich, Langmuir, and Temkin’s equilibrium isothermal models were used to examine adsorption. The data were more in line with the Freundlich (multi-layered) equilibrium model (20), which is in line with the results of this part of the study (20). Likewise, Sun et al examined the possibility of using lignin to remove Cu from aqueous solutions. The equilibrium isotherm models Freundlich, Langmuir, and Temkin were investigated for Cu absorption. Langmuir equilibrium model (single layer) had the best answer in this regard (22), which contradicts the results of this part of the study.
Table 3.
Data From Studying Two-Parameter Copper Adsorption Isothermal Models
|
Isotherm Model
|
Constant Coefficients
|
| Langmuir |
qm (mg/g) |
b (L/mg) |
RL |
R2 |
| 58.823 |
17.241 |
0.1266 |
0.579 |
|
P value |
r |
Slope |
MSE |
| 0.017563 |
0.9398 |
0.018152 |
0.002713 |
| Freundlich |
kf (mg/g) |
n |
R2 |
| 3.111 |
1.453 |
0.969 |
|
P value |
r |
Slope |
MSE |
| 0.001866 |
0.98656 |
0.55204 |
0.02867 |
| Dubinin-Radushkevich |
qm (mg/g) |
ED-R (kJ/mol) |
KD –R (mol2/kj2) |
R2 |
| 3.269 |
9.63 |
1 |
0.9603 |
|
P value |
r |
Slope |
MSE |
| 0.003394 |
0.97997 |
3.6691 |
0.0426 |
| Temkin |
AT (L/g) |
BT (J/mol) |
R2 |
| 1.292 |
0.7264 |
0.9338 |
|
P-value |
r |
Slope |
MSE |
| 0.01389 |
0.94858 |
18.317 |
40.13 |
Note. MSE: mean square error.
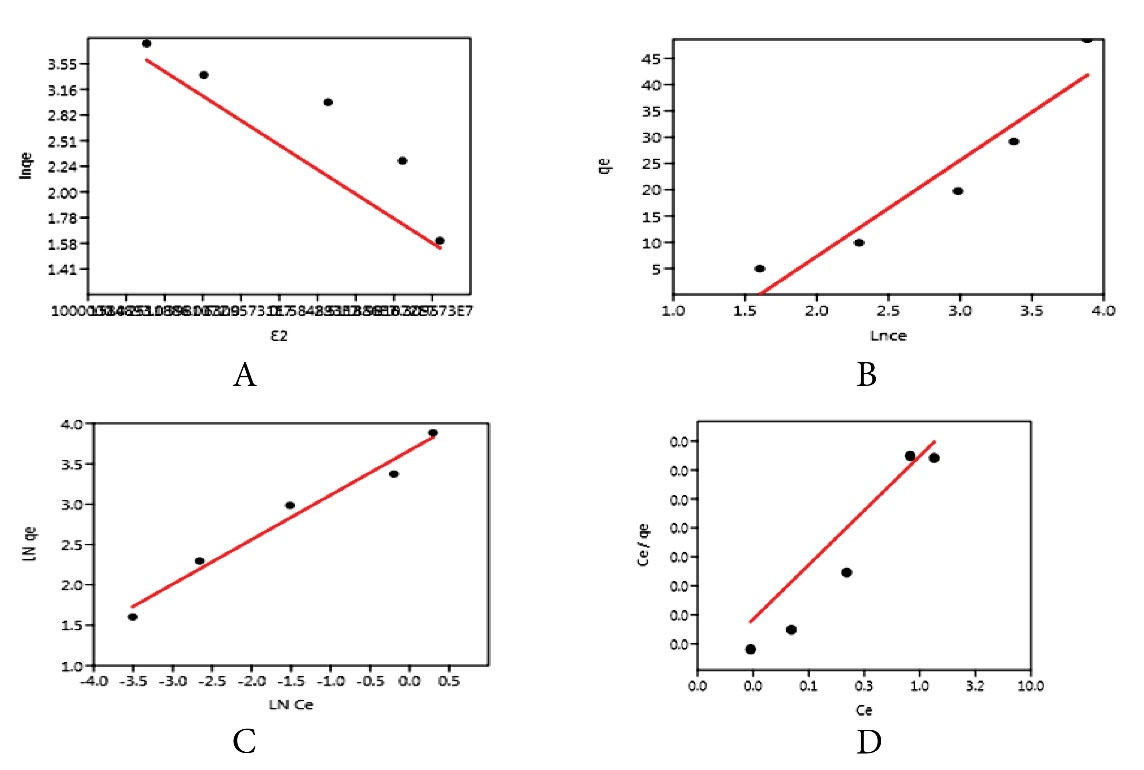
Figure 10.
Dubinin-Radushkevich (A), Temkin (B), Langmuir (C), and Freundlich (D) Isothermal Models.
.
Dubinin-Radushkevich (A), Temkin (B), Langmuir (C), and Freundlich (D) Isothermal Models.
3.10. The Results of Absorption Synthetic
The results of examining the kinetic models of Cu adsorption are presented in Table 4 and Fig. 11. The values of the constant coefficients of the kinetic models for the adsorption process were evaluated, and the correlation coefficients (R2) were obtained as 0.3893, 0.9999, 1, and 0.7188 for the reactive kinetic models of pseudo-first order, pseudo-second order, intra-particle diffusion, and Elovich, respectively. Therefore, given that the pseudo-second order correlation coefficients were high and intra-particle diffusion, the obtained experimental data from Cu absorption experiments with the pseudo-second order kinetic equation and the penetration between the particles were highly proportionate, but the data were better described by the penetration model between better particles. Accordingly, chemical adsorption was the dominant and controlling process in the Cu adsorption process, and adsorption was the predominant mechanism controlling the adsorption rate (26). According to the R2 value of this model and the obtained values of qe and qt from the pseudo-second order kinetic equation, there was less difference compared to the obtained values of qt and qe from the other applied kinetic models in this study, which is a proof of the accuracy of the equilibrium experiment confirming the adherence of Cu removal using the existing adsorbent from the pseudo-second order equation (27). Similar studies have examined the kinetics effect on Cu removal. For instance, Xu et al used lignocellulose adsorbent to absorb phosphate from aqueous solutions. The kinetics of adsorption was studied showing that the data followed the second-order kinetics (24), which is in conformity with the results of this study. Furthermore, Asadollahfardi et al employed nanofiber cellulose adsorbent to remove mercury, and pseudo-first and pseudo-second order adsorption kinetics and concluded that the data followed kinetic pseudo-second order (25), which corroborates with the findings of our study.
Table 4.
Data From the Examination of the Kinetic Models of Copper Adsorption
|
Kinetics Model
|
Constant Coefficient
|
| Pseudo-first order |
K1 (1/min) |
qe (mg/g) |
MSE |
R2 |
| 73.857 |
2.501 |
0.003816 |
0.3893 |
|
P value |
r |
Slope |
P (reg) |
| 0.26062 |
-0.62398 |
-0.00123 |
0.2606 |
| Pseudo-second order |
K2 (g/mg.min) |
qe (mg/g) |
MSE |
R2 |
| 0.0085 |
1.52 |
0.0023 |
0.9999 |
|
P value |
r |
Slope |
P (reg) |
| 2.43 |
0.99997 |
0.019822 |
0.000209 |
| Intraparticle diffusion |
C (mg/g) |
kdif (mg.g-1.min-1) -1/2 |
MSE |
R2 |
| 33666 |
0.0232 |
0.002 |
1 |
|
P value |
r |
Slope |
P (reg) |
| 1.633 |
0.9876 |
13.494 |
1.543 |
| Elovich |
α (mg/g.min) |
β(g/mg) |
MSE |
R2 |
| 1.299 |
0.106 |
5.168 |
0.7188 |
|
P value |
r |
Slope |
P (reg) |
| 0.069632 |
0.84779 |
2.7388 |
0.06963 |
Note. MSE: Mean square error.
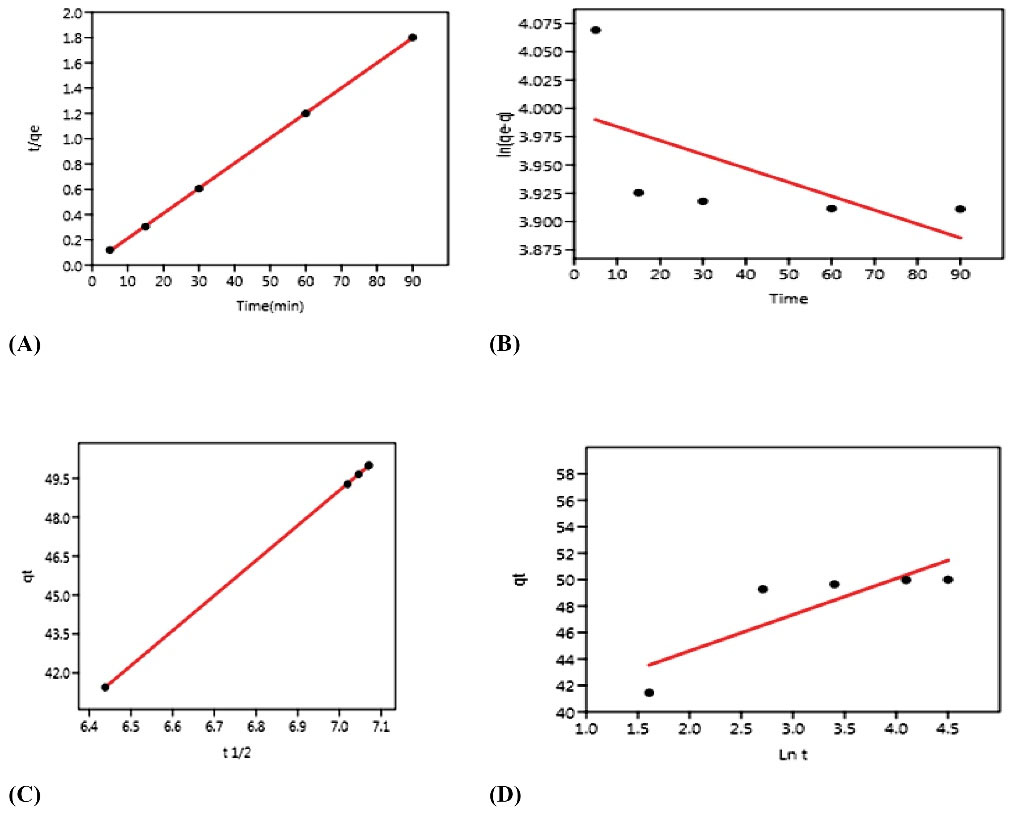
Figure 11.
Pseudo-first Order (A), Pseudo-second Order (B), Intra-particle Diffusion (C), and Elovich (D) Isothermal Kinetics Models.
.
Pseudo-first Order (A), Pseudo-second Order (B), Intra-particle Diffusion (C), and Elovich (D) Isothermal Kinetics Models.
3.11. Thermodynamic Results
In this study, the process of Cu removal by LCNF (Table 5) was stoichiometrically possible showing the spontaneous nature of the Cu adsorption process. As the temperature increased, (GFE) ∆G◦ decreased, leading to an increase in the spontaneity of the reaction process (25). Moreover, the negative values of ∆Hº (enthalpy) demonstrated that the overall process of the desired reaction was exothermic, meaning that the rate of elimination increased with a decrease in ambient temperature. The high enthalpy changes show that the temperature adsorption process is sensitive (7). The positive value of ∆Sº (entropy) indicated that the rate of irregularity at the solid-liquid joint level increased during the adsorption process. Indeed, the positive value of ∆S◦ represents the adsorption tendency of the adsorbent in the solution and some structural changes in the adsorbent and the adsorbent (14). Similar studies investigated the effect of thermodynamics on Cu removal. Ouédraogo et al used lignocellulose to remove arsenic. Given the positive values of enthalpy and an increase in adsorption efficiency with an increase in temperature, the results of thermodynamics indicated that the reaction is endothermic (26), which is not in line with the results of this study. Liu et al also used cellulosic nanocrystals as adsorbents to remove Cr from aqueous solutions. Considering the positive values of enthalpy and increasing the absorption efficiency by an increase in temperature, the results of Cr metal thermodynamics showed that the reaction is endothermic (27), which does not match the results of the current study.
Table 5.
Thermodynamic Parameters in Copper Removal
|
T (˚C)
|
T (K)
|
ΔG (kJ/mol)
|
Δ
H
◦ (kJ/mol)
|
Δ
S
◦ (J/mol K)
|
| 15 |
283 |
-1781.67 |
-5154.32 |
+4.7082 |
| 20 |
293 |
-2186.33 |
|
|
| 25 |
298 |
-5020.87 |
|
|
| 30 |
303 |
-8081.70 |
|
|
| 40 |
308 |
-1294.37 |
|
|
4. Conclusion
The use of the polymeric adsorbent is a suitable solution for removing contaminants from the aqueous solution based on the mentioned points and the results. The concentration of the pollutant to the level of the global standard can be decreased by this approach. This study evaluated the effect of pH, temperature, time, initial Cu concentration, and adsorbent-dose parameters on the percentage of removal and absorption capacity. Isotherm, kinetic, and thermodynamics of Cu ion adsorption were examined using the LCNF adsorbent. The results of the study of two-parameter isotherms (Langmuir, Freundlich, Dubinin-Radushkevich, and Temkin) revealed that in general, the studied isotherms well predicted the equilibrium of the system. Based on the examination of the obtained correlation values (R2) from the four absorption isotherms, the data were well in conformity with both Freundlich and Dubinin-Radushkevich models, showing that the adsorption of Cu on the adsorbent was multi-layered and heterogeneous. According to the results of reactive and permeable kinetic models, the data had the most consistency with pseudo-second order kinetics (R2=0.9999) and the intra-particle diffusion kinetics (R2 = 1). Thus, the chemical adsorption of Cu and the adsorption of cations occurred both at the adsorbent level and diffusion into the pores. The effect of temperature changes on the Cu removal process by the adsorbent was evaluated and thermodynamic constants in the adsorption process were calculated in this study. Thermodynamic studies indicated that because of the negativity of ∆Hº = -5154.32 (kJ/mol), Cu reaction with LCNF is exothermic since the rate of elimination increased with a decrease in ambient temperature. The negative values of the free energy changes of ∆Gº for the Cu adsorption process by the adsorbent represented that the adsorption process caused a decrease in Gibbs-free energy and thus the spontaneous absorption of Cu was possible. Moreover, from the positivity of ∆Sº = +4.7082, the irregularity increased during the adsorption process. Ultimately, LCNF could highly absorb Cu from the aqueous solution despite the changes in temperature, time, and the adsorbent dose given its high flexibility, and its high mechanical strength, the high contact surface, and good physical shape can be used to remove Cu from aqueous sources.
Conflict of Interest Disclosures
The authors declare that they have no conflict of interests.
References
- Zhang J, Xue CH, Ma HR, Ding YR, Jia ST. Fabrication of PAN electrospun nanofibers modified by tannin for effective removal of trace Cr(III) in organic complex from wastewater. Polymers (Basel) 2020;12(1). 10.3390/polym12010210.
- Ji Y, Wen Y, Wang Z, Zhang S, Guo M. Eco-friendly fabrication of a cost-effective cellulose nanofiber-based aerogel for multifunctional applications in Cu(II) and organic pollutants removal. J Clean Prod 2020; 255:120276. doi: 10.1016/j.jclepro.2020.120276 [Crossref] [ Google Scholar]
- Liu X, Jiang B, Yin X, Ma H, Hsiao BS. Highly permeable nanofibrous composite microfiltration membranes for removal of nanoparticles and heavy metal ions. Sep Purif Technol 2020; 233:115976. doi: 10.1016/j.seppur.2019.115976 [Crossref] [ Google Scholar]
- Akhtar K, Ali F, Sohni S, Kamal T, Asiri AM, Bakhsh EM. Lignocellulosic biomass supported metal nanoparticles for the catalytic reduction of organic pollutants. Environ Sci Pollut Res Int 2020; 27(1):823-36. doi: 10.1007/s11356-019-06908-y [Crossref] [ Google Scholar]
- Zhang S, Shi Q, Christodoulatos C, Meng X. Lead and cadmium adsorption by electrospun PVA/PAA nanofibers: batch, spectroscopic, and modeling study. Chemosphere 2019; 233:405-13. doi: 10.1016/j.chemosphere.2019.05.190 [Crossref] [ Google Scholar]
- Feng ZQ, Yuan X, Wang T. Porous polyacrylonitrile/graphene oxide nanofibers designed for high efficient adsorption of chromium ions (VI) in aqueous solution. Chem Eng J 2020; 392:123730. doi: 10.1016/j.cej.2019.123730 [Crossref] [ Google Scholar]
- da Silva CG, Kano FS, Rosa DS. Lignocellulosic nanofiber from eucalyptus waste by a green process and their influence in bionanocomposites. Waste Biomass Valorization 2020; 11(7):3761-74. doi: 10.1007/s12649-019-00610-3 [Crossref] [ Google Scholar]
- Moradi E, Ebrahimzadeh H, Mehrani Z, Asgharinezhad AA. The efficient removal of methylene blue from water samples using three-dimensional poly (vinyl alcohol)/starch nanofiber membrane as a green nanosorbent. Environ Sci Pollut Res Int 2019; 26(34):35071-81. doi: 10.1007/s11356-019-06400-7 [Crossref] [ Google Scholar]
- Shen X, Xie Y, Wang Q, Yi X, Shamshina JL, Rogers RD. Enhanced heavy metal adsorption ability of lignocellulosic hydrogel adsorbents by the structural support effect of lignin. Cellulose 2019; 26(6):4005-19. doi: 10.1007/s10570-019-02328-w [Crossref] [ Google Scholar]
- Wen Y, Ji Y, Zhang S, Zhang J, Cai G. A simple low-cost method to prepare lignocellulose-based composites for efficient removal of Cd(II) from wastewater. Polymers 2019; 11(4):711. doi: 10.3390/polym11040711 [Crossref] [ Google Scholar]
- Huerta RR, Saldaña MDA. Sequential treatment with pressurized fluid processing and ultrasonication for biorefinery of canola straw towards lignocellulosic nanofiber production. Ind Crops Prod 2019; 139:111521. doi: 10.1016/j.indcrop.2019.111521 [Crossref] [ Google Scholar]
- Ji Y, Wen Y, Wang Z, Zhang S, Guo M. Eco-friendly fabrication of a cost-effective cellulose nanofiber-based aerogel for multifunctional applications in Cu(II) and organic pollutants removal. J Clean Prod 2020; 255:120276. doi: 10.1016/j.jclepro.2020.120276 [Crossref] [ Google Scholar]
- Zhang J, Xue CH, Ma HR, Ding YR, Jia ST. Fabrication of PAN electrospun nanofibers modified by tannin for effective removal of trace Cr(III) in organic complex from wastewater. Polymers (Basel) 2020; 12(1):210. doi: 10.3390/polym12010210 [Crossref] [ Google Scholar]
- Fiol N, Vásquez MG, Pereira M, Tarrés Q, Mutjé P, Delgado-Aguilar M. TEMPO-oxidized cellulose nanofibers as potential Cu(II) adsorbent for wastewater treatment. Cellulose 2019; 26(2):903-16. doi: 10.1007/s10570-018-2106-7 [Crossref] [ Google Scholar]
- Feng ZQ, Yuan X, Wang T. Porous polyacrylonitrile/graphene oxide nanofibers designed for high efficient adsorption of chromium ions (VI) in aqueous solution. Chem Eng J 2020; 392:123730. doi: 10.1016/j.cej.2019.123730 [Crossref] [ Google Scholar]
- Dong X, Wang Y, Jia M, Niu Z, Cai J, Yu X. Sustainable and scalable in-situ synthesis of hydrochar-wrapped Ti3AlC2-derived nanofibers as adsorbents to remove heavy metals. Bioresour Technol 2019; 282:222-7. doi: 10.1016/j.biortech.2019.03.010 [Crossref] [ Google Scholar]
- Deshmukh PD, Khadse GK, Shinde VM, Labhasetwar P. Cadmium removal from aqueous solutions using dried banana peels as an adsorbent: kinetics and equilibrium modeling. J Bioremediat Biodegrad 2017; 8(3):395. doi: 10.4172/2155-6199.1000395 [Crossref] [ Google Scholar]
- Asadollahfardi G, Naseraei MM, Asadi M, Alizadeh R. The study of mercury removal using synthesized copper ferrite nanofiber in laboratory scale. Environ Nanotechnol Monit Manag 2018; 10:79-86. doi: 10.1016/j.enmm.2018.05.007 [Crossref] [ Google Scholar]
- Abiaziem CV, Williams AB, Inegbenebor AI, Onwordi CT, Ehi-Eromosele CO, Petrik LF. Adsorption of lead ion from aqueous solution unto cellulose nanocrystal from cassava peel. J Phys Conf Ser 2019; 1299(1):012122. doi: 10.1088/1742-6596/1299/1/012122 [Crossref] [ Google Scholar]
- Sun XF, Hao Y, Cao Y, Zeng Q. Superadsorbent hydrogel based on lignin and montmorillonite for Cu(II) ions removal from aqueous solution. Int J Biol Macromol 2019; 127:511-9. doi: 10.1016/j.ijbiomac.2019.01.058 [Crossref] [ Google Scholar]
- Zhang L, Lu H, Yu J, Fan Y, Ma J, Wang Z. Contribution of lignin to the microstructure and physical performance of three-dimensional lignocellulose hydrogels. Cellulose 2019; 26(4):2375-88. doi: 10.1007/s10570-019-02251-0 [Crossref] [ Google Scholar]
- Putro JN, Kurniawan A, Ismadji S, Ju YH. Nanocellulose based biosorbents for wastewater treatment: Study of isotherm, kinetic, thermodynamic and reusability. Environ, Avicenna J Environ Health Eng, Volume 8, Issue 1, 2021 14, Nanotechnol Monit Manag 2017; 8:134-49. doi: 10.1016/j.enmm.2017.07.002 [Crossref] [ Google Scholar]
- Dragan ES, Humelnicu D, Dinu MV, Olariu RI. Kinetics, equilibrium modeling, and thermodynamics on removal of Cr(VI) ions from aqueous solution using novel composites with strong base anion exchanger microspheres embedded into chitosan/poly(vinyl amine) cryogels. Chem Eng J 2017; 330:675-91. doi: 10.1016/j.cej.2017.08.004 [Crossref] [ Google Scholar]
- Xu Q, Chen Z, Wu Z, Xu F, Yang D, He Q. Novel lanthanum doped biochars derived from lignocellulosic wastes for efficient phosphate removal and regeneration. Bioresour Technol 2019; 289:121600. doi: 10.1016/j.biortech.2019.121600 [Crossref] [ Google Scholar]
- Wakkel M, Khiari B, Zagrouba F. Textile wastewater treatment by agro-industrial waste: equilibrium modelling, thermodynamics and mass transfer mechanisms of cationic dyes adsorption onto low-cost lignocellulosic adsorbent. J Taiwan Inst Chem Eng 2019; 96:439-52. doi: 10.1016/j.jtice.2018.12.014 [Crossref] [ Google Scholar]
- Ouédraogo IWK, Pehlivan E, Tran HT, Paré S, Bonzi-Coulibaly YL, Zachmann D. Removal of arsenic (V) from aqueous medium using manganese oxide coated lignocellulose/silica adsorbents. Toxicol Environ Chem 2016; 98(7):736-47. doi: 10.1080/02772248.2015.1133815 [Crossref] [ Google Scholar]
- Liu C, Jin RN, Ouyang XK, Wang YG. Adsorption behavior of carboxylated cellulose nanocrystal—polyethyleneimine composite for removal of Cr(VI) ions. Appl Surf Sci 2017; 408:77-87. doi: 10.1016/j.apsusc.2017.02.265 [Crossref] [ Google Scholar]
- Jiang J, Wang X. Adsorption of Hg(II) ions from aqueous solution by thiosemicarbazide-modified cellulose adsorbent. BioResources 2019; 14(2):4670-95. [ Google Scholar]
- Maaloul N, Oulego P, Rendueles M, Ghorbal A, Díaz M. Synthesis and characterization of eco-friendly cellulose beads for copper (II) removal from aqueous solutions. Environ Sci Pollut Res Int 2020; 27(19):23447-63. doi: 10.1007/s11356-018-3812-2 [Crossref] [ Google Scholar]
- Sayen S, Ortenbach-López M, Guillon E. Sorptive removal of enrofloxacin antibiotic from aqueous solution using a ligno-cellulosic substrate from wheat bran. J Environ Chem Eng 2018; 6(5):5820-9. doi: 10.1016/j.jece.2018.08.012 [Crossref] [ Google Scholar]
- Lyu W, Yu M, Feng J, Yan W. Highly crystalline polyaniline nanofibers coating with low-cost biomass for easy separation and high efficient removal of anionic dye ARG from aqueous solution. Appl Surf Sci 2018; 458:413-24. doi: 10.1016/j.apsusc.2018.07.074 [Crossref] [ Google Scholar]