Avicenna J Environ Health Eng. 11(1):1-11.
doi: 10.34172/ajehe.5428
Original Article
The Performance of Iron Nanocomposites as Persulfate Activators in Permeable Reactive Barrier Technology for Treatment of Landfill Leachate
Alaa Mohamad Soubh 1, * 
Author information:
1Department of Food Technology, Faculty of Technical Engineering, Tartous University, Tartous, Syria
Abstract
Landfill leachate contains a large organic load and a wide spectrum of pollutants, and it needs appropriate treatment to reduce the severity of these contaminants. Therefore, the present study aimed to remove chemical oxygen demand (COD) and ammonia (NH3) as target contaminants from the landfill leachate. To this end, the zero-valent iron nanofibers/reduced ultra-large graphene oxide (ZVINFs/rULGO) and converter sludge (CS) were used as persulfate (PS) activators in permeable reactive barrier (PRB) technology for removing COD and NH3. The Box–Behnken design (BBD) was employed to determine the possibility of using each activator and optimize three parameters: activator, pore volume (PV), and flow (mL/min) using target contaminants. In the Batch process, the effects of pH, activator concentration, and PS/COD mass ratio on COD removal were examined. The BBD experiments provided a satisfactory predictive model, indicating that ZVINFs/rULGO is superior to CS when used as activators of PS in PRB technology. The biochemical oxygen demand (BOD5)/COD ratio increased from 0.24 in raw leachate to 0.67 in treated leachate, and leachate toxicity was reduced by more than 85%. Additionally, the ZVINFs/rULGO and CS contributed to the activation of PS.
Keywords: Landfill leachate, COD, NH3, Persulfate, Activators,
Copyright and License Information
© 2024 The Author(s); Published by Hamadan University of Medical Sciences.
This is an open-access article distributed under the terms of the Creative Commons Attribution License (
https://creativecommons.org/licenses/by/4.0), which permits unrestricted use, distribution, and reproduction in any medium, provided the original work is properly cited.
Please cite this article as follows: Soubh AM. The performance of Iron nanocomposites as persulfate activators in permeable reactive barrier technology for treatment of landfill leachate. Avicenna J Environ Health Eng. 2024; 11(1):1-11. doi:10.34172/ajehe.5428
1. Introduction
Landfill leachate contains a high organic load and a wide spectrum of pollutants (1-4). Therefore, using traditional treatment methods for dealing with it does not lead to the desired outcomes (5-8). The leakage of leachate from the landfill to the groundwater aquifers will cause pollution and create financial risks. Therefore, it is necessary to take remedial measures, especially for landfills lacking integrated management of waste and its products (9,10).Persulfate (PS, S2O82-) is the strongest member of the peroxygen family, with a standard oxidation potential (Eo) of 2.01 V (11–14). It also has an important advantage, namely, it can generate sulfate radicals (SR) with oxidation potentials (Eo) ranging from 2.5 to3.1 V. Therefore, it has been used to oxidize a wide range of contaminants, and it can also be combined with different treatment methods (15-19).
A permeable reactive barrier (PRB) is a barrier containing reactive materials, typically placed to treat the target pollutants by eliminating them, making them suitable for the environment (20,21). This technique has been widely used to treat water plumes contaminated with leachate (22). Leachate needs advanced treatment systems because it contains a wide range of refractory pollutant compounds (23). PRB technology is an effective method for treating contaminants in municipal solid waste landfill leachate. The performance of PRB technology can be improved by adding materials that increase its effectiveness or by combining it with other methods such as PS technology (17,24,25). However, the high costs for soil drilling, transportation, and pumping pose the main obstacles to this technology (26-28), but conducting on-site treatment can reduce these costs by half (29).
Converter sludge (CS) is the solid waste produced by the iron industry which can be considered a suitable material for activating PS because it is rich in iron oxides (13). It has been used in effective PRB systems for treating leachate (17). Likewise, zero-valent iron (ZVI) is a promising activator for PS (30), and it can be used in PRB. When supported on suitable surfaces such as reduced expanded graphene oxide (rEGO), ZVI can form zero-valent iron nanofibers/reduced ultra-large graphene oxide (ZVINFs/rULGO), which is considered a suitable compound for this purpose (14,31-34).
This study presented a scenario for the treatment of leachate from waste landfills using on site PRB technique, where the leachate is directed to pass through the prepared layers for treatment, then it is pumped into the sewerage network or returned to landfills when needed.
2. Materials and Methods
The CS was brought from Esfahan Steel Company, Iran. Natural flake graphite (NFG) was obtained from Yantai Lushun Huitong Biotechnology, Yantai, China. Then, it was sieved through a 100-mesh sieve, and the particles retained on the sieve ( + 100 mesh) were used in this study. Sodium PS (Na₂S₂O₈, 99%), chromium trioxide (CrO₃, 98%), potassium permanganate (KMnO₄, 99%), and sodium borohydride (NaBH₄, 97%) were obtained from Loba-Chemie, Mumbai, India. Iron (II) sulfate heptahydrate (FeSO₄.7H₂O, 99.5%), sodium hydroxide (NaOH ≥ 97.0%), hydrochloric acid (HCl, 37%), sulfuric acid (H2SO4, 98%), and hydrogen peroxide (H2O2, 30%) were purchased from Merck Company, Darmstadt, Germany. All chemicals employed for preparing synthetic leachate were also obtained from Merck Company. The test kits for COD, ammonia (NH3), and Fe (II) determinations were purchased from Zist Tajzieh Gostar Company, Tehran, Iran. Deionized water was used to prepare aqueous solutions. All chemicals and test kits used in experiments had analytical grades and were purchased from reputable companies. Deionized water was used in this study when needed to prepare solutions.
The raw leachate was obtained from the Aradkouh Landfill in Tehran, Iran. It was transported in plastic containers and preserved in a refrigerator until use (5,6). Table 1presents raw leachate characteristics.
Table 1.
Raw Leachate Characteristics
|
Parameter
|
Average*
|
Unit
|
| pH |
6.3 |
— |
| COD |
20000 |
mg/L |
| NH3 |
1250 |
mg/L |
| BOD5 |
4950 |
mg/L |
| TDS |
3250 |
mg/L |
| EC |
18.2 |
mS/cm |
Note. pH: Potential of hydrogen; COD: Chemical oxygen demand; NH3: Ammonia; BOD: Biochemical oxygen demand; TDS: Total dissolved solids; EC: Electrical conductivity; * Number of replicates.
Nano-CS and ZVINFs/rULGO were employed to activate the PS in the PRB technique for leachate treatment. This research presents a promising approach for treating leachate on-site, disposing of which in an environmentally friendly manner is an important part of integrated waste management. The mechanism diagram of the use of activated PS in the PRB technique for landfill leachate management is depicted in Fig. 1.
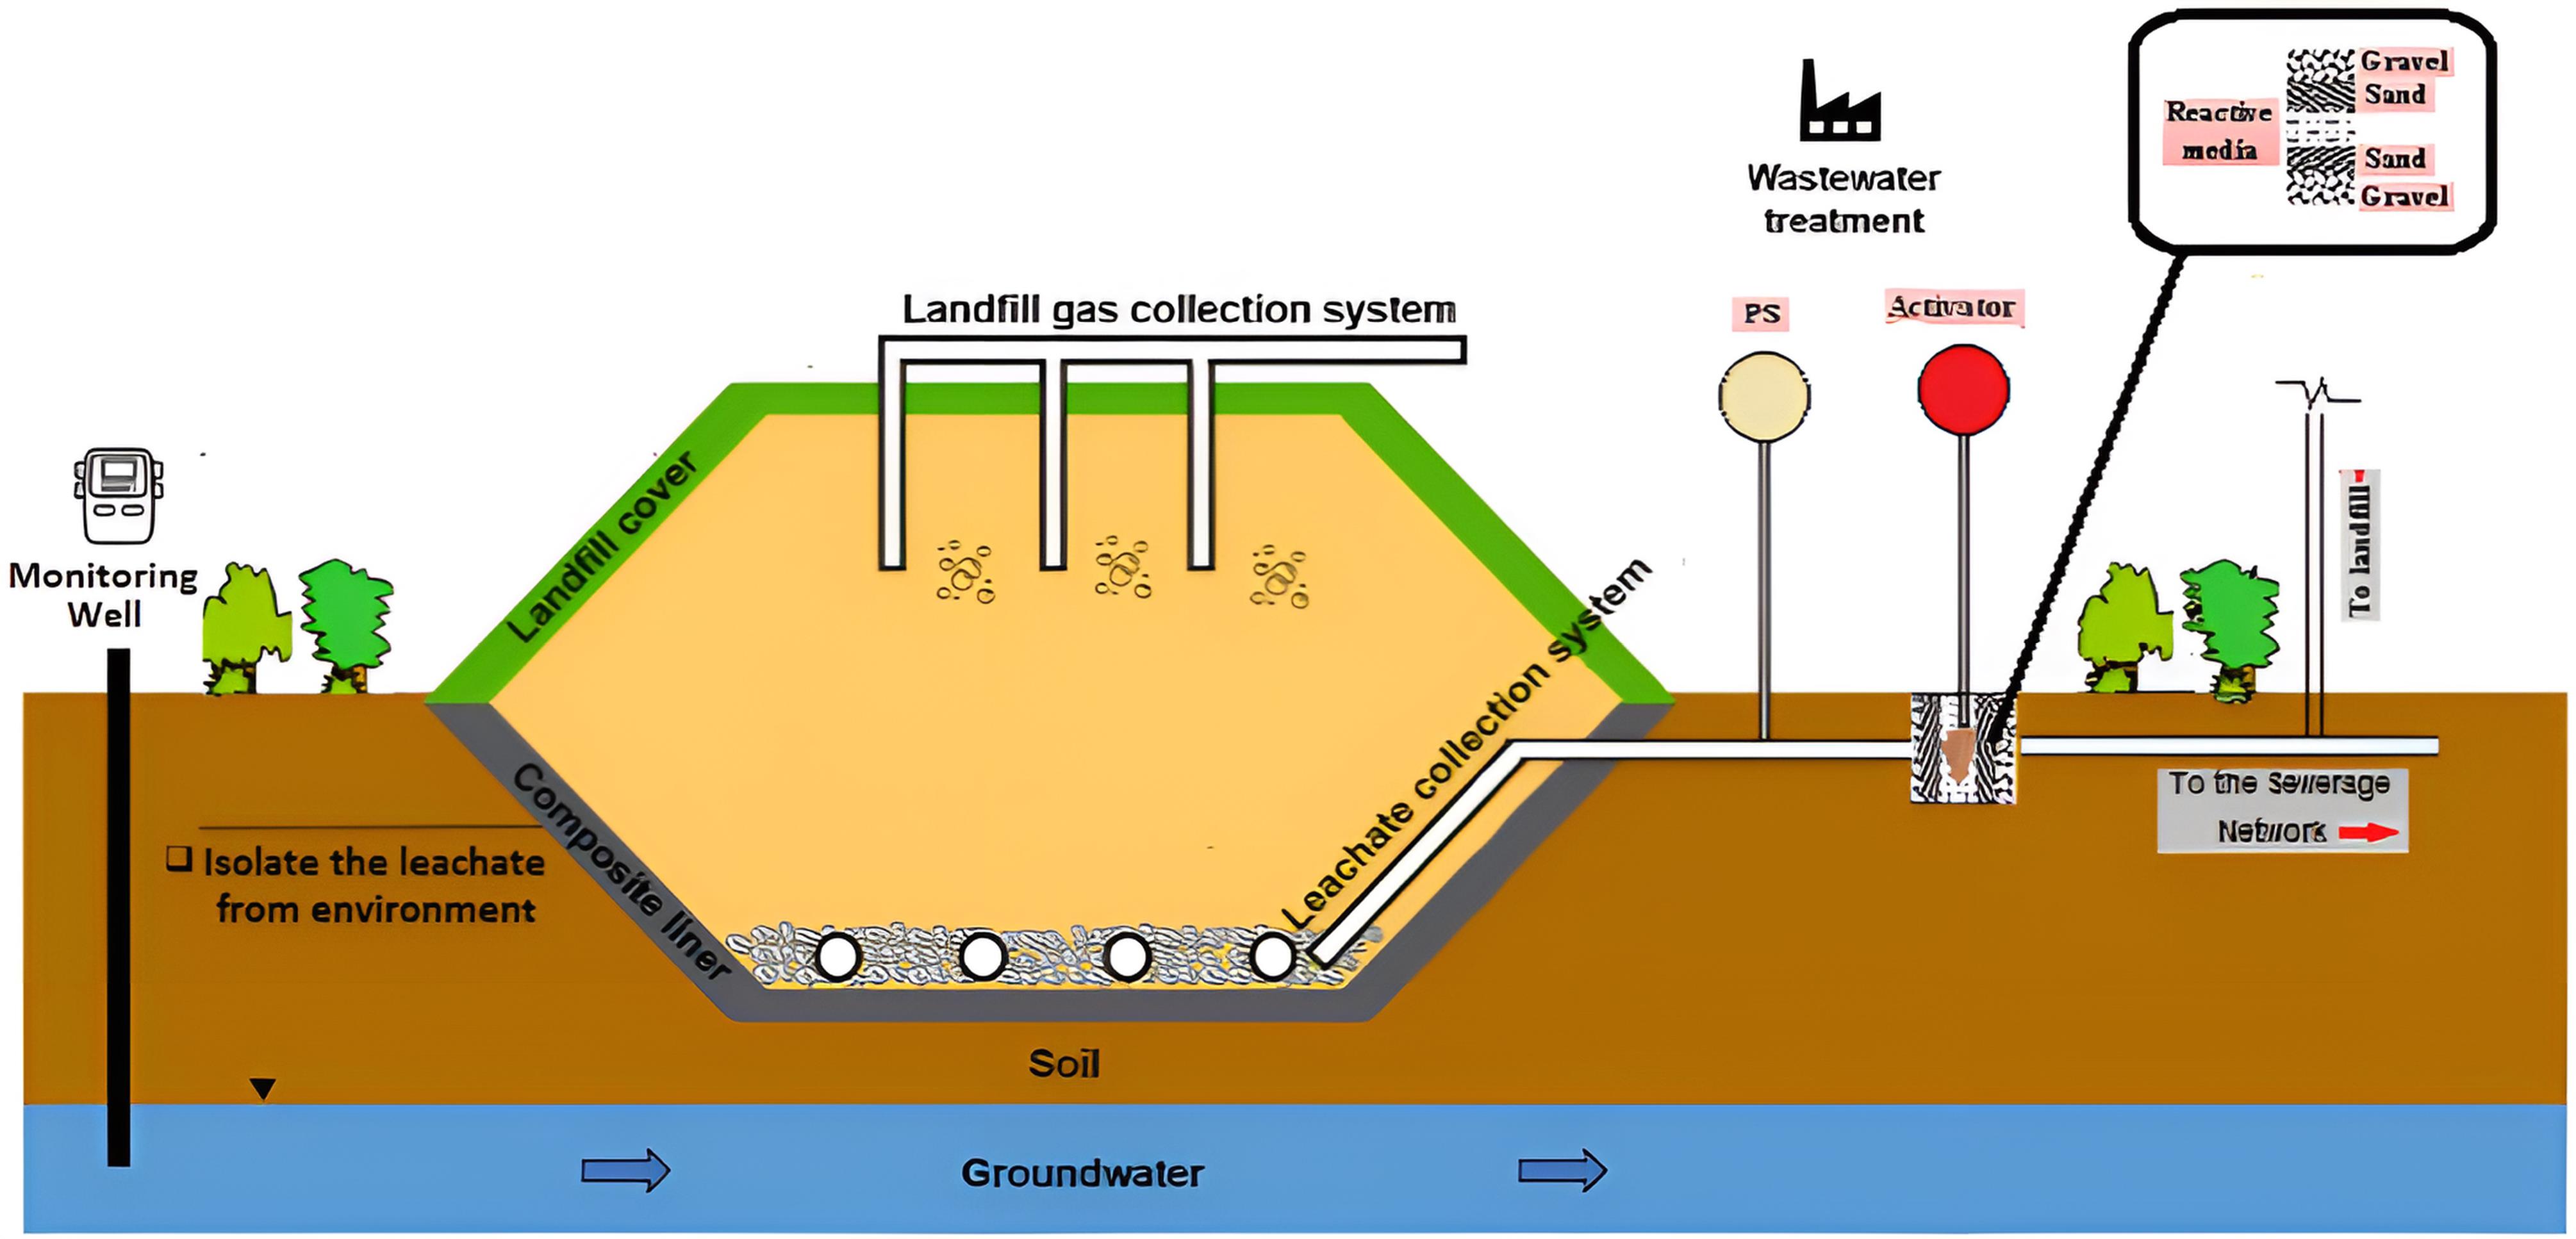
Fig. 1.
Schematic Diagram of the Use of Activated PS in PRB Technique for Landfill Leachate Management. Note. PS: Persulfate; PRB: Permeable reactive barrier
.
Schematic Diagram of the Use of Activated PS in PRB Technique for Landfill Leachate Management. Note. PS: Persulfate; PRB: Permeable reactive barrier
The continuous treatment studies of leachate using the PRB technique were conducted in a bench-scaled laboratory setup, as shown in Fig. 2. The experiment column was designed according to the method by Soubh et al. Uncontaminated sand and gravel were prepared using Daoud and colleagues’ modified method. The PS-laden leachate was passed through the activation zone by a peristaltic pump at a flow rate of 4 mL/min (bottom-up) for all experiments, except when examining the effect of the flow factor on the removal rate. Pre-PRB gravel and sand acted as a filtration layer to remove suspended materials. Then, the mixed PS and leachate were activated as they passed through the PRB layer, and post-PRB gravel and sand increased the efficiency of pollutant removal.
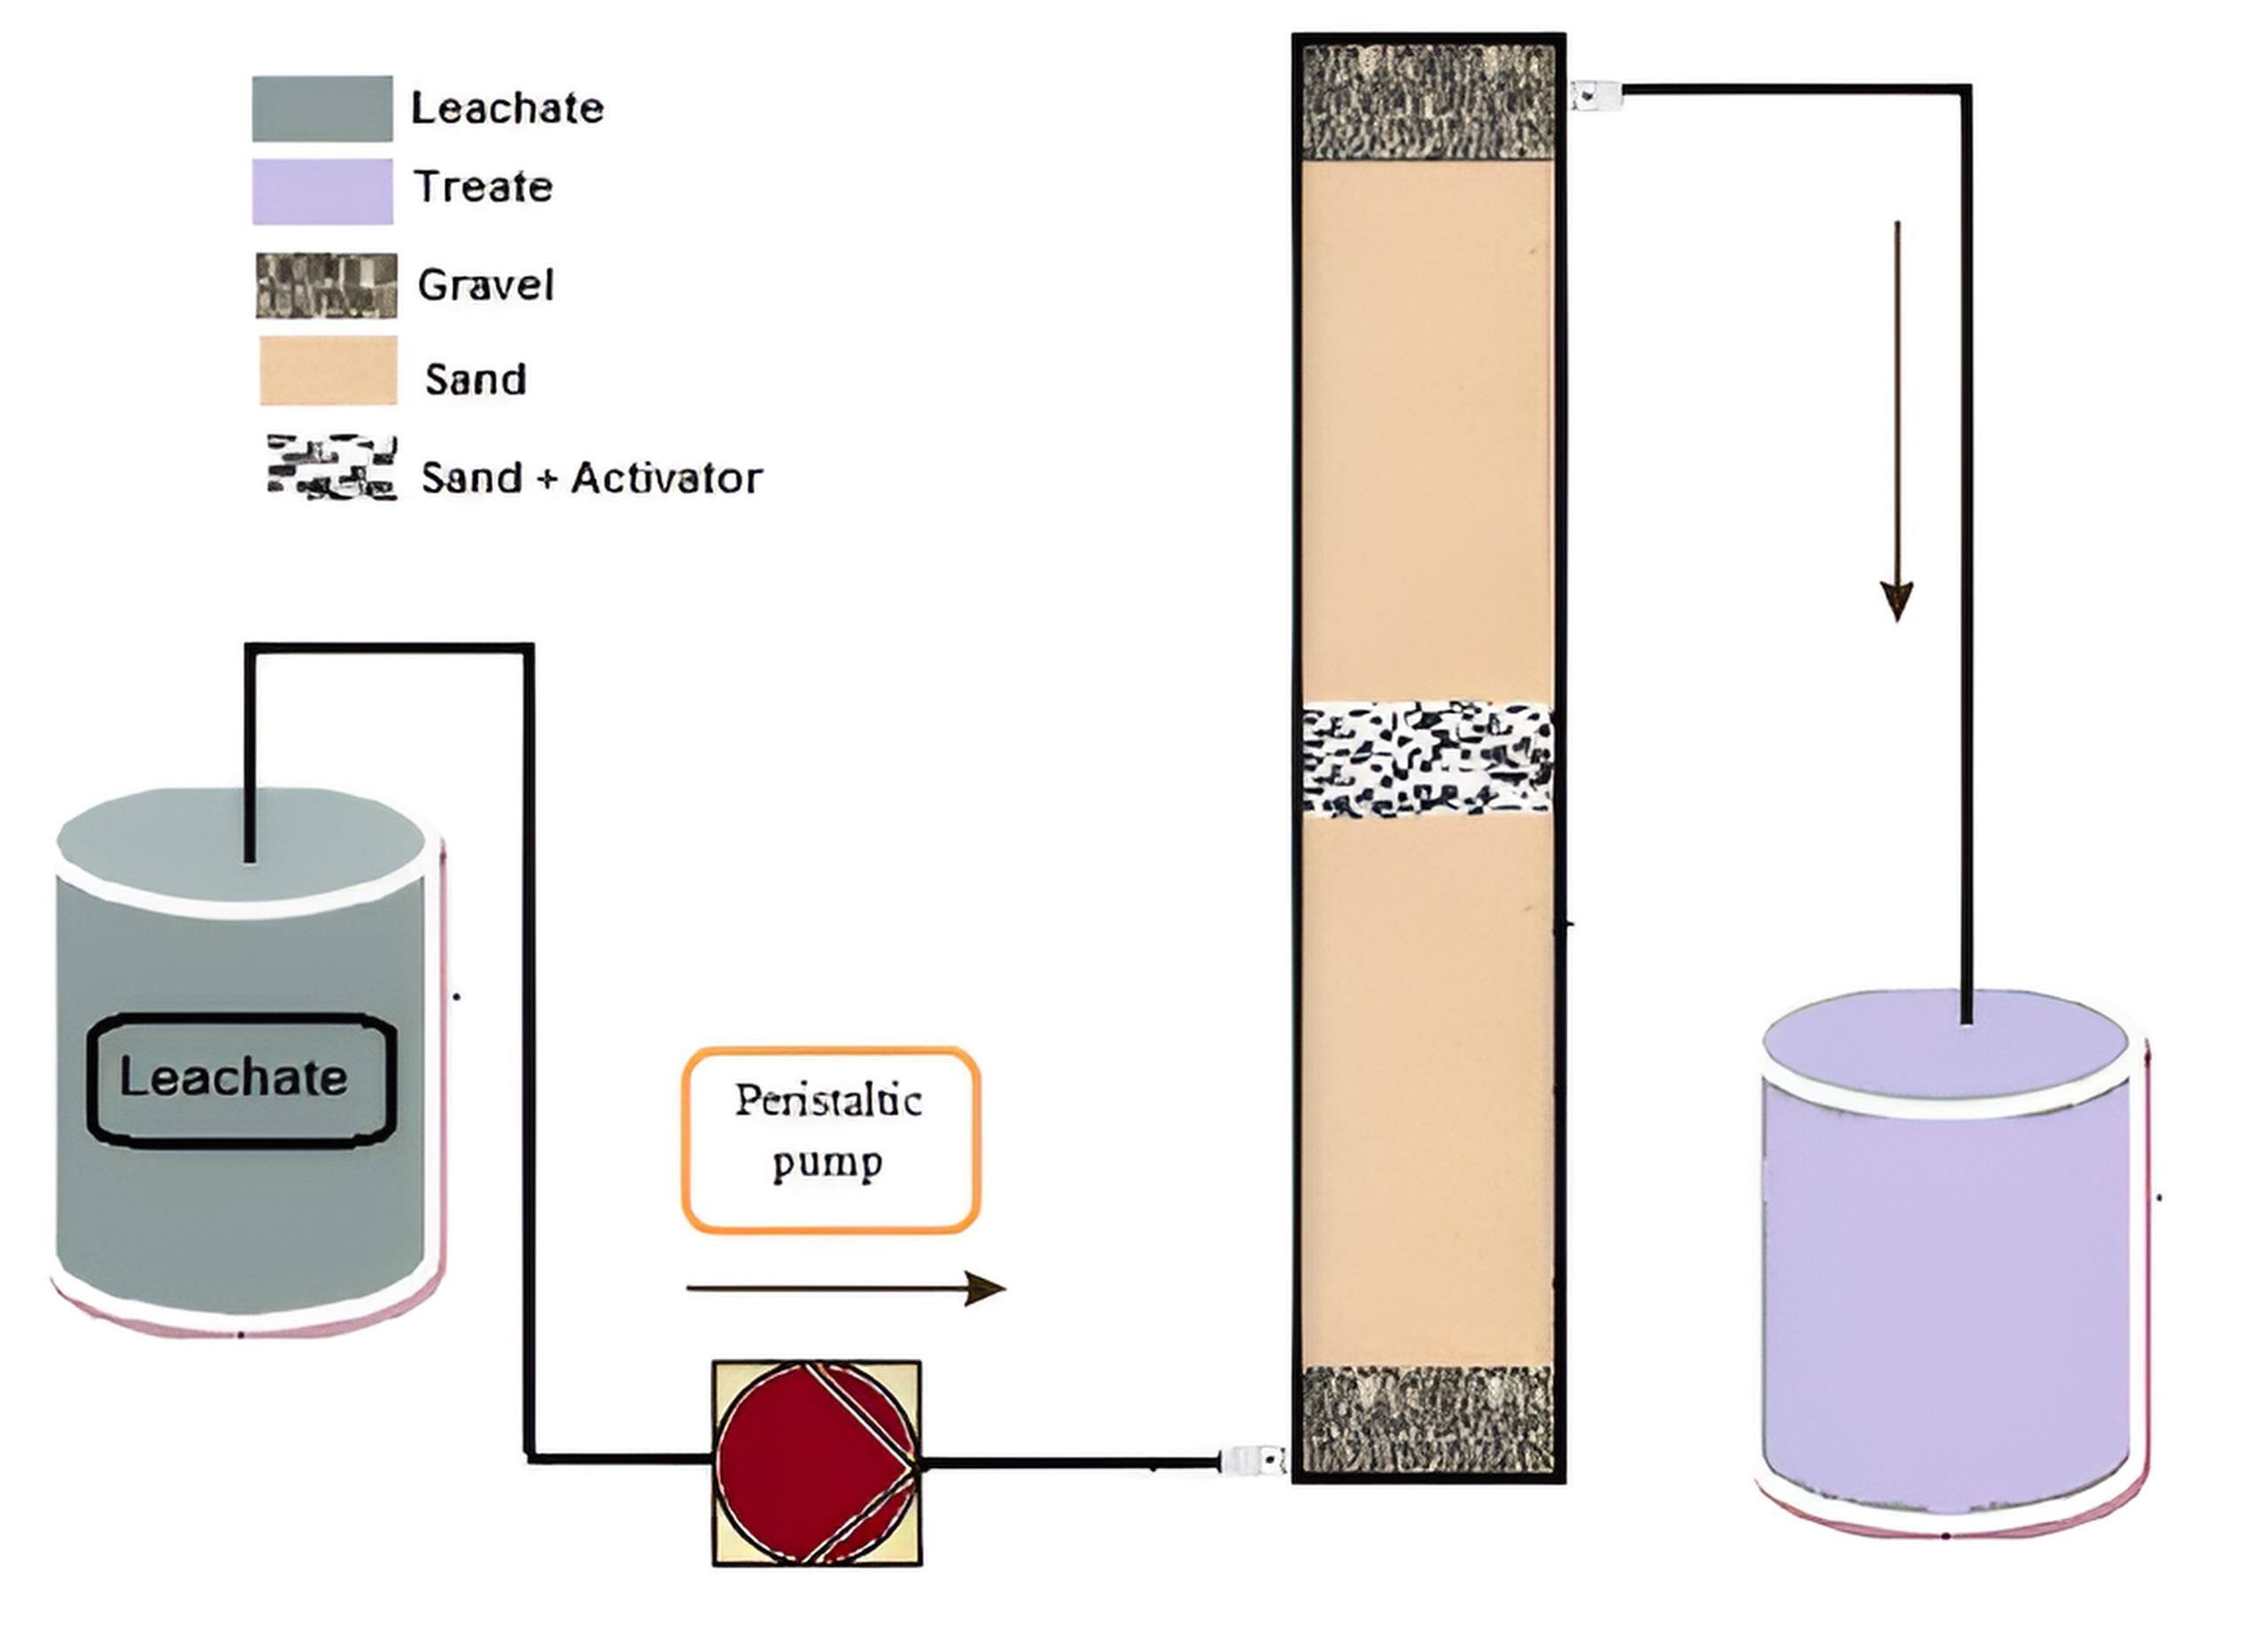
Fig. 2.
Schematic Diagram of the Laboratory Setup
.
Schematic Diagram of the Laboratory Setup
The nano-CS was prepared by grinding in a ball mill for 60 minutes, followed by passing through a 60 mesh sieve. The rEGO was prepared by Dong and colleagues’ method in which expanded graphite (EG) was initially prepared via chemical intercalations. Subsequently, the rEGO was prepared by oxidizing and reducing EG using concentrated H2SO4 and KMnO₄ in an ice bath, followed by stirring the resulting product in a diluted hydrogen peroxide solution (36). The ZVINFs/rULGO were prepared based on Fan and colleagues’ method (37). Fig. 3 presents the preparation process of EG, rEGO, and ZVINFs/rULGO.
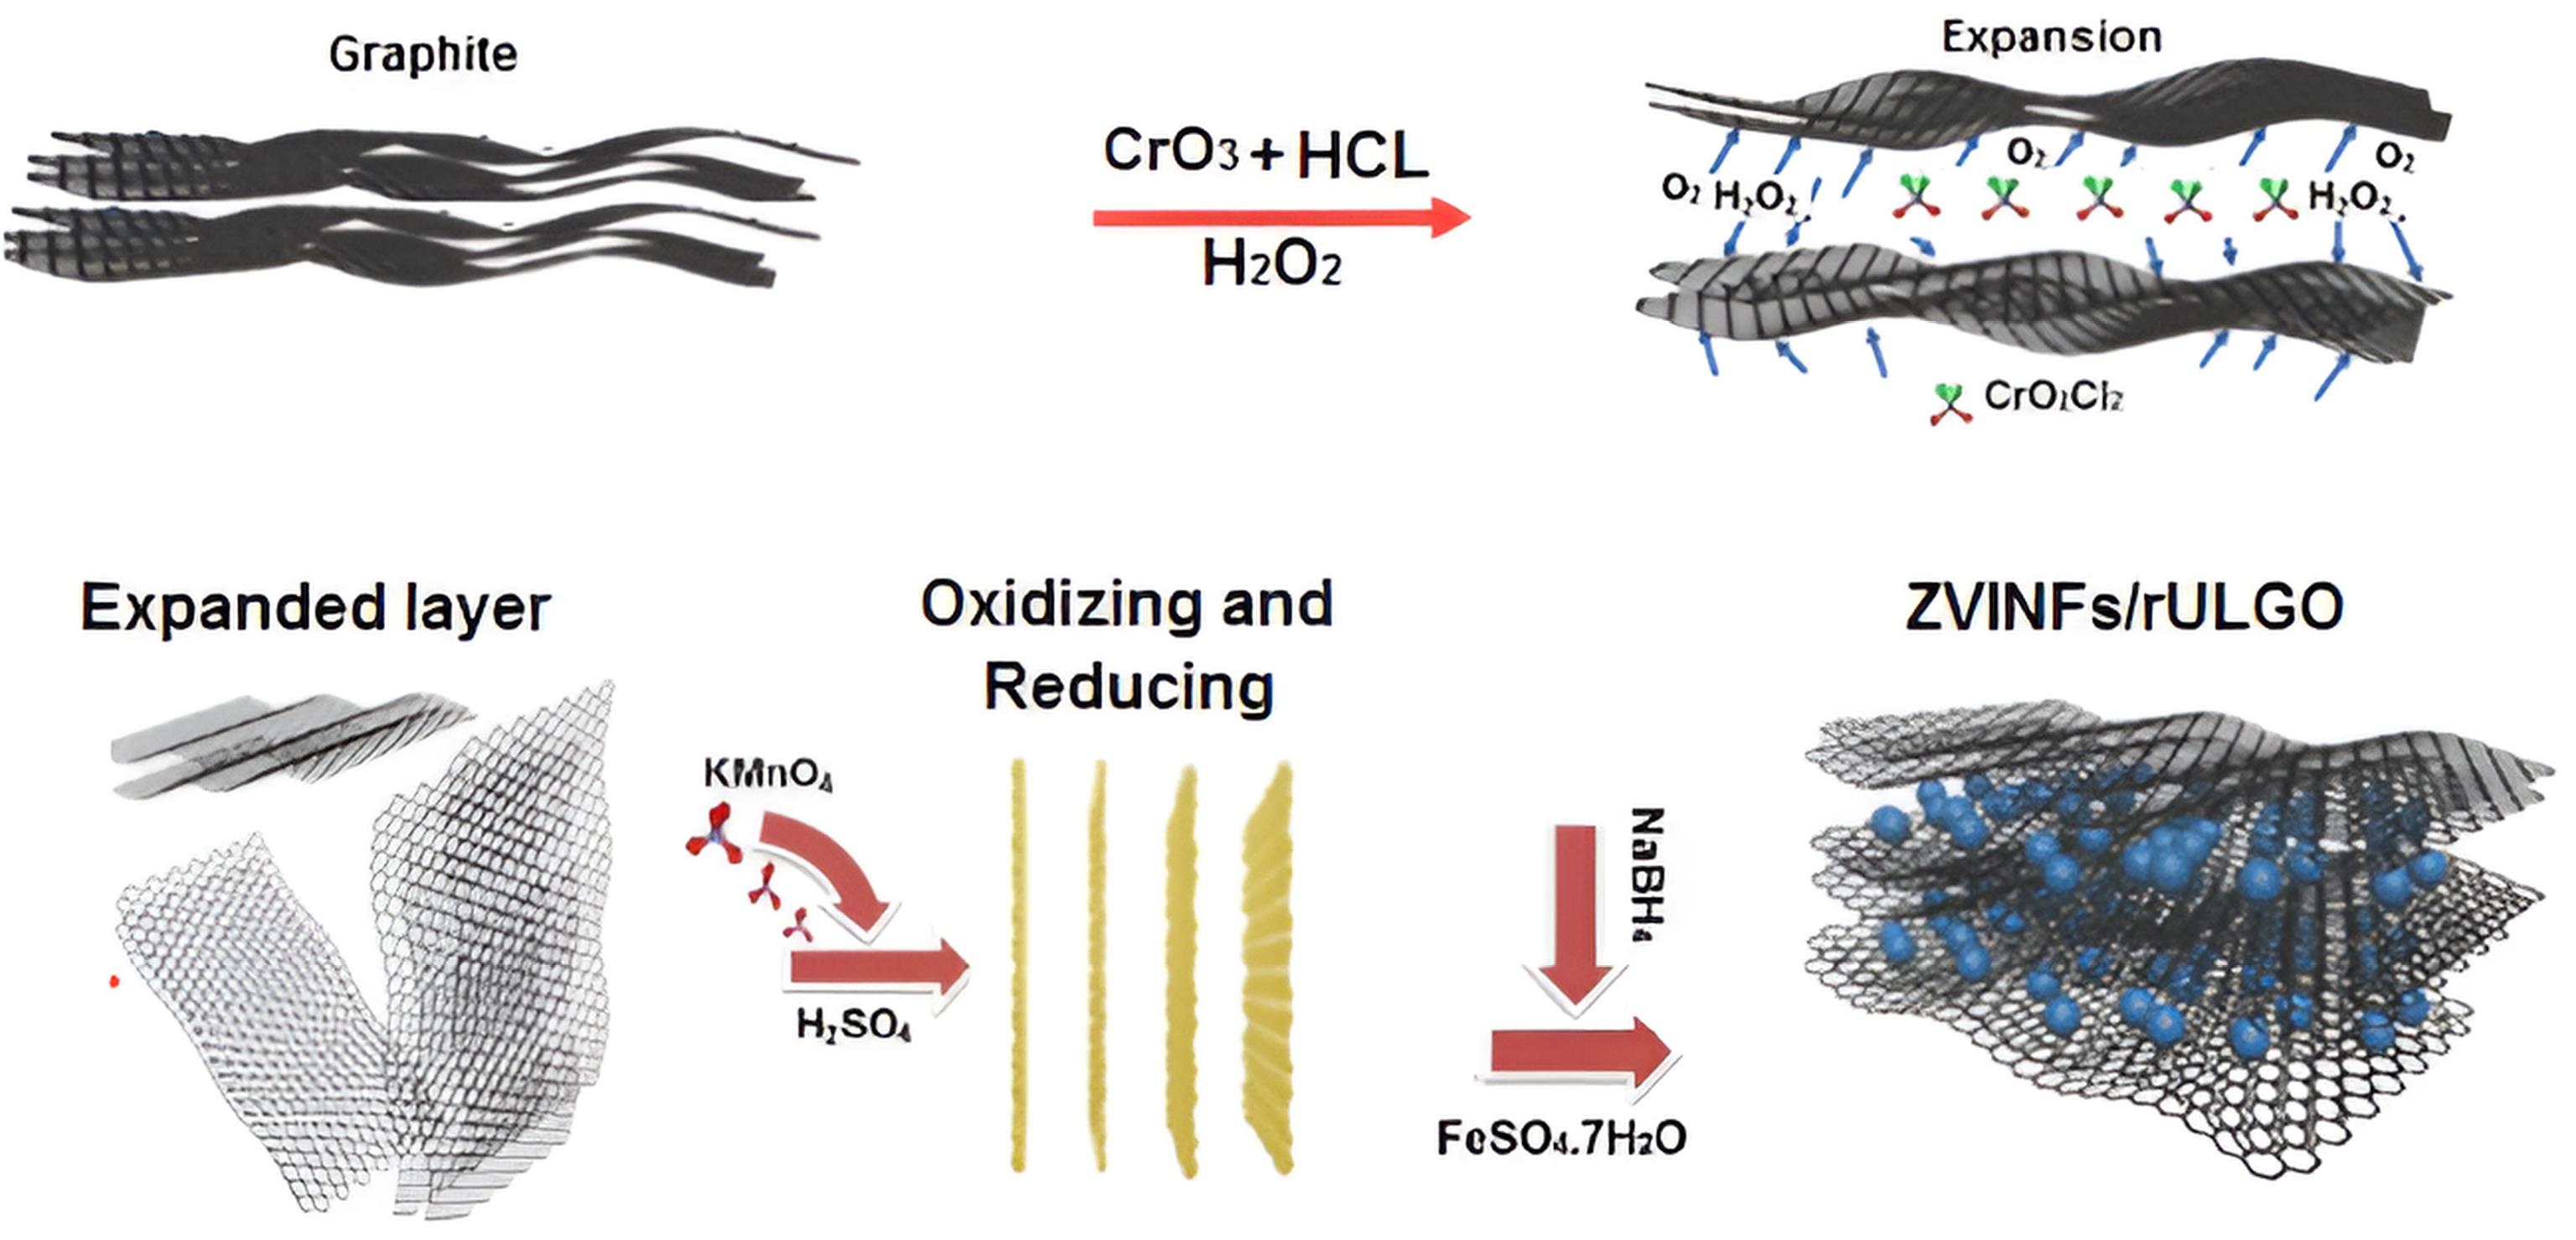
Fig. 3.
Preparation of (a) EG, (b) rEGO, and (c) ZVINFs/rULGO. Note. EG: Expanded graphene; rEGO: Reduced expanded graphene oxide; ZVINFs/rULGO: Zero-valent iron nanofibers/reduced ultra-large graphene oxide.
.
Preparation of (a) EG, (b) rEGO, and (c) ZVINFs/rULGO. Note. EG: Expanded graphene; rEGO: Reduced expanded graphene oxide; ZVINFs/rULGO: Zero-valent iron nanofibers/reduced ultra-large graphene oxide.
Scanning electron microscopy (SEM) and energy dispersive X-ray spectroscopy (EDS) analysis were used to provide high-definition images of the sample surface and information on the chemical composition of activators (VEGA3//TESCAN-Libusina Trida, Czech). X-ray diffraction (XRD) was used to investigate the characteristics of activators’ crystallographic structure (X’Pert PRO MPD, PANalytical Company).
A spectrophotometer (HACH, DR 5000) was used to measure COD and NH3 concentrations. Soubh and colleagues’ method was used to avoid the possibility of interference between PS and COD concentrations (13). Furthermore, a BOD meter OxiDirect was employed to determine BOD5, and pH was measured by a pH meter (Metrohm-691). Total dissolved solids (TDS) and electrical conductivity (EC) were determined using a conductivity meter (6,14,38). Moreover, Gas chromatography-mass spectrometry (GC-MS) was used to detect compounds in leachate and detect intermediate compounds in treated leachate to measure toxicity. The initial column temperature was set at 60 °C for 2 minutes, then increased to 200 °C at a rate of 15 °C/min, and further increased to 280 °C at a rate of 5 °C/min. One microliter of sample was injected into the GC column with a split ratio of 1:5.
Landfill leachate toxicity was estimated using the method by Soubh and Mokhtarani which applies Eq. 1 to assess toxicity levels (6). Chemical waste toxicity in leachate is divided into five categories: X, A, B, C, and D, corresponding to the following ranges < 0.01, 0.01– < 0.1, 0.1– < 1.0, 1.0– < 10.0, and 10.0–100.0 for fish LC50, respectively.
(1)
In the batch process, the influence of each pH value (3, 5, 7, and 11), activator concentration (0.6, 0.8, 1, 1.2, and 1.4 g L-1), and PS concentration as a proportional ratio with COD (PS/COD (g/g): 1, 2, 4, and 6) on removal efficiency was evaluated to select the optimal operating condition. Experiments were separately conducted for each activator. COD indicates the number of compounds that need oxidation, therefore determining the amount of required oxidant (39,40).
In the continuous process, the response surface methodology (RSM) was utilized to estimate the relationships and interactive effects of discrete parameters(activator, pore volume [PV], and flow rate) on the removal of the COD and NH3. This study used the BBDpolynomial model (second-order) to design experiments and investigate the correlation between the effective parameters,using Eq. 2:
(2)
Where R is the predicted response, β0 is the constant coefficient (intercept term), β i are the linear coefficients, βii are the quadratic coefficients, and β ij are the interaction coefficients. Xi and Xj are independent variables, where k is the number of factors, and e is the residual term, allowing uncertainties between observed and predicted values. The analysis of the variance (ANOVA) was employed to determine the compatibility between the model and laboratory values (41). The F-test was used to estimate the statistical significance of all terms in the polynomial equation within a 95% confidence level (42). The levels and ranges of effective parameters were coded at three levels (-1, 0, and + 1), as shown in Table 2. For the first parameter, values of 0, 50, and 100 correspond to ZVINFs/rULGO alone, 50% CS + 50 ZVINFs/rULGO, and CS alone, respectively. Finally, BOD5/COD ratios and leachate toxicity before and after treatment were estimated.
Table 2.
Levels of Effective Parameters
|
|
|
Range and Levels
|
|
Factors
|
Symbols
|
(−1)
|
0
|
(+1)
|
| Activator |
A |
0 |
50 |
100 |
| PV (mL) |
B |
1 |
6.5 |
12 |
| Flow (mL/min) |
C |
1 |
7 |
13 |
The values of the experimental results were presented at the selected points of the BBD to be statistically evaluated, as illustrated in Table 3. The removal percentage was achieved using Eq. 3:
(3)
Table 3.
The BBD Model for Effective Parameters
|
Run
|
Factors
|
Removal Efficiency (%)
|
|
COD
|
NH3
|
|
Activator A
|
PV (mL)
B
|
Flow (mL/min)
C
|
Actual
|
Predicted
|
Actual
|
Predicted
|
| 1 |
0 |
6.5 |
1 |
67.10 |
65.98 |
60.20 |
59.10 |
| 2 |
100 |
1 |
7 |
68.20 |
66.65 |
57.90 |
56.73 |
| 3 |
50 |
6.5 |
7 |
58.50 |
57.96 |
49.10 |
48.58 |
| 4 |
50 |
6.5 |
7 |
56.20 |
57.96 |
46.90 |
48.58 |
| 5 |
50 |
6.5 |
7 |
59.10 |
57.96 |
48.90 |
48.58 |
| 6 |
0 |
12 |
7 |
43.10 |
44.65 |
36.80 |
37.97 |
| 7 |
50 |
6.5 |
7 |
57.90 |
57.96 |
49.80 |
48.58 |
| 8 |
100 |
6.5 |
13 |
35.20 |
36.33 |
27.10 |
28.20 |
| 9 |
0 |
1 |
7 |
82.10 |
82.30 |
73.10 |
73.77 |
| 10 |
50 |
1 |
13 |
62.30 |
62.73 |
53.20 |
53.27 |
| 11 |
50 |
12 |
13 |
29.30 |
28.38 |
19.10 |
18.67 |
| 12 |
100 |
6.5 |
1 |
44.20 |
44.83 |
31.90 |
32.65 |
| 13 |
50 |
12 |
1 |
35.50 |
35.08 |
24.90 |
24.82 |
| 14 |
50 |
1 |
1 |
79.10 |
80.03 |
67.90 |
68.33 |
| 15 |
100 |
12 |
7 |
25.20 |
25.00 |
15.10 |
14.42 |
| 16 |
50 |
6.5 |
7 |
58.10 |
57.96 |
48.20 |
48.58 |
| 17 |
0 |
6.5 |
13 |
51.10 |
50.48 |
43.10 |
42.35 |
Note. BBD: Box–Behnken design; pH: Potential of hydrogen; COD: Chemical oxygen demand; PV: Pore volume.
Where C0 and Ce(mg/L) are the initial and ultimate concentrations of COD and NH3, respectively.
3. Results and Discussion
The XRD patterns of CS and ZVINFs/rULGO are presented in Figs. 4A and 4B, respectively, and EDS analysis of CS and ZVINFs/rULGO is presented in Table 5. The XRD pattern of CS (Fig. 4A) shows peaks resting from iron oxides, which decompose into iron ions in an acidic medium, needed for activating the PS process (43). Conversely, the XRD pattern of ZVINFs/rULGO (Fig. 4B) illustrates peaks related to Fe°, which is considered a strong PS activator, especially in acidic conditions (34).
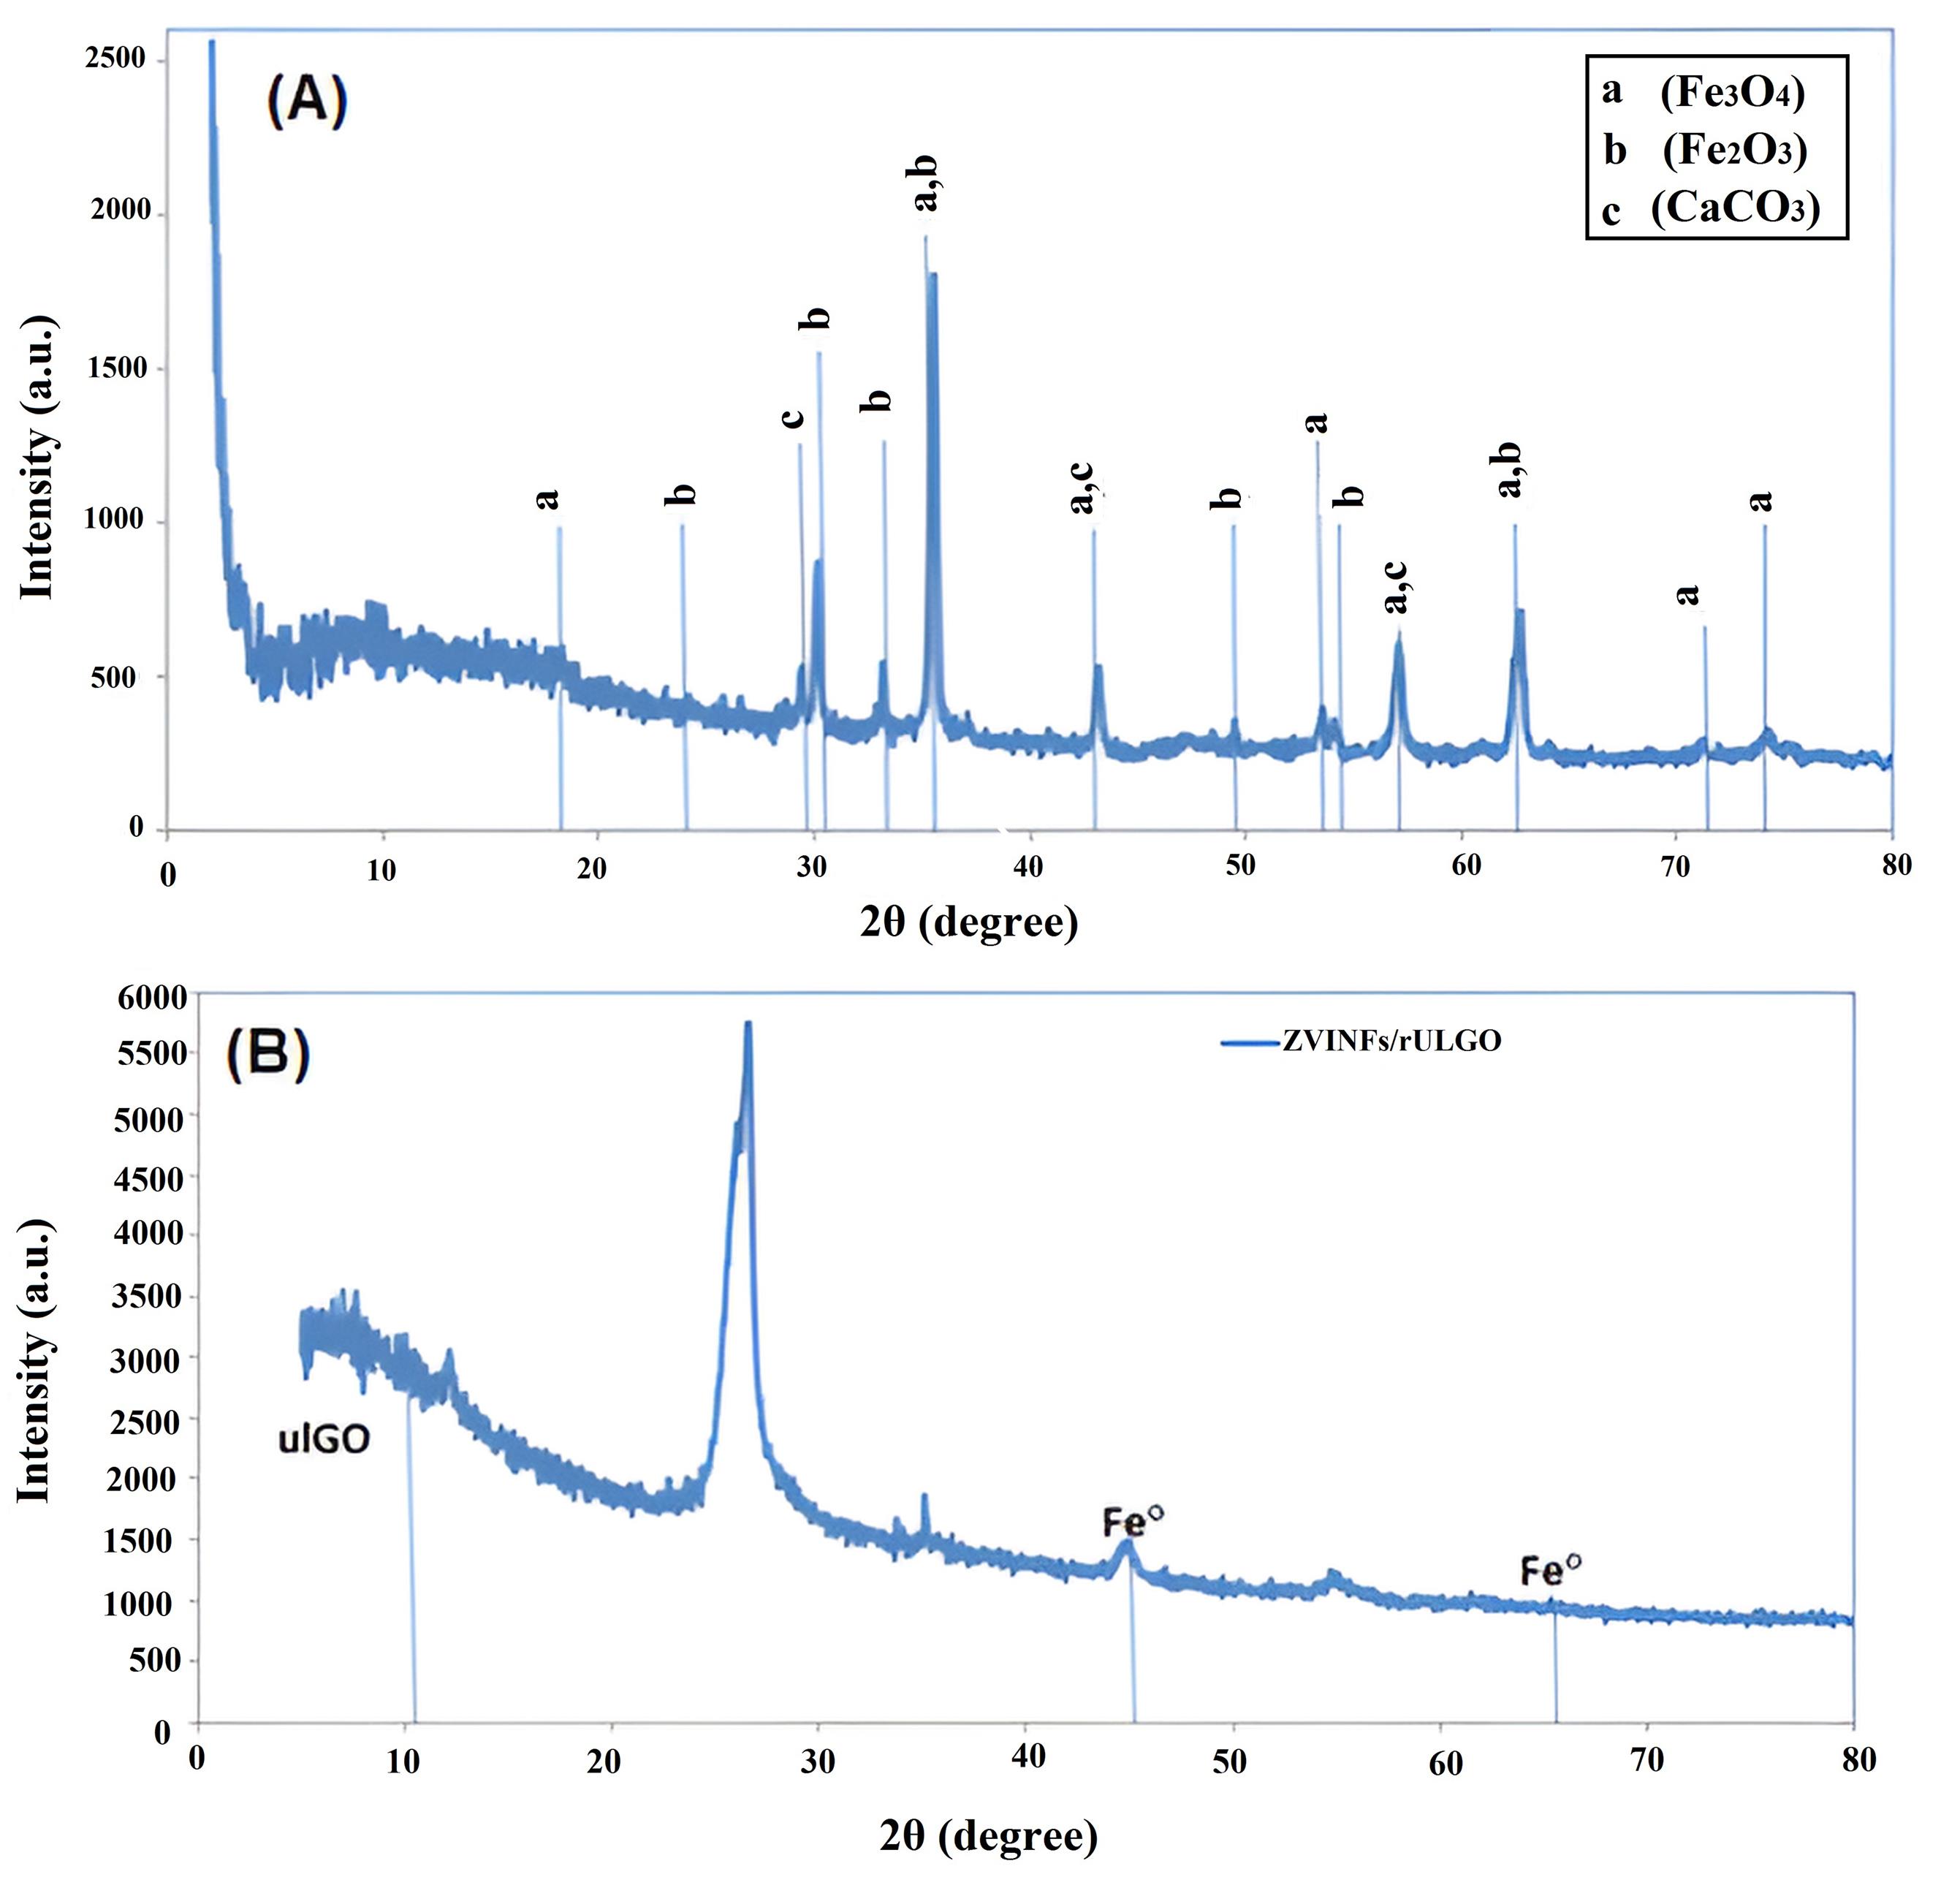
Fig. 4.
X-ray Diffraction Analysis of (A) CS and (B) ZVINFs/rULGO. Note. CS: converter sludge; ZVINFs/rULGO: Zero-valent iron nanofibers/reduced ultra-large graphene oxide.
.
X-ray Diffraction Analysis of (A) CS and (B) ZVINFs/rULGO. Note. CS: converter sludge; ZVINFs/rULGO: Zero-valent iron nanofibers/reduced ultra-large graphene oxide.
The SEM images displayed that the particle size of CS is less than 800 nm (Fig. 5A). The images also showed the distribution of ZVINFs on the surface of the rULGO in the chain structure with a diameter of about 100 nm (Fig. 5B), which may increase their effectiveness as activators. As evident in Table 4, EDS analysis confirmed the presence of iron to be more than 70% in CS and more than 55% in ZVINFs/rULGO.
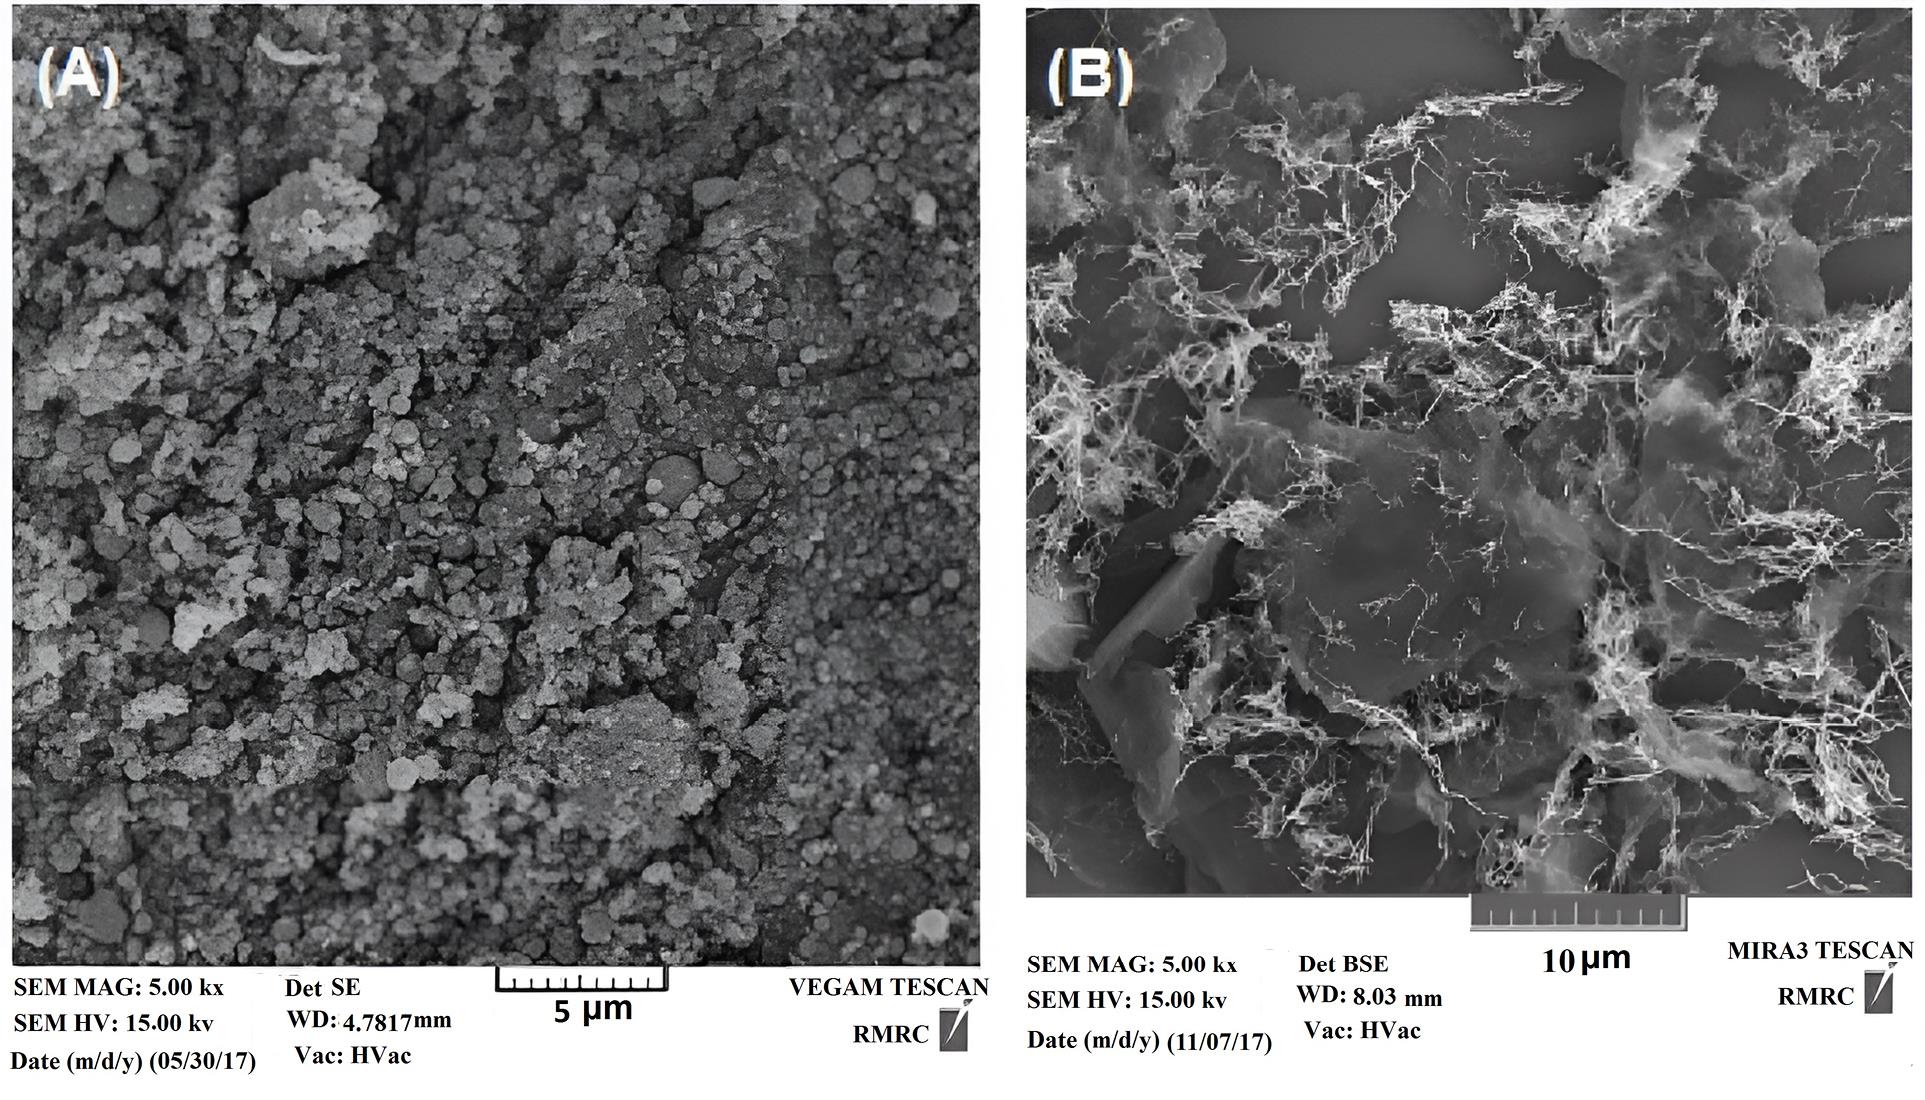
Fig. 5.
SEM Images of (A) CS and (B) ZVINFs/rULGO. Note. SEM: Scanning electron microscopy; CS: Converter sludge; ZVINFs/rULGO: Zero-valent iron nanofibers/reduced ultra-large graphene oxide.
.
SEM Images of (A) CS and (B) ZVINFs/rULGO. Note. SEM: Scanning electron microscopy; CS: Converter sludge; ZVINFs/rULGO: Zero-valent iron nanofibers/reduced ultra-large graphene oxide.
Table 4.
EDS Analysis of Activators
|
Element
|
Wt% of CS
|
Wt% of ZVINFs/rULGO
|
| Carbon |
0.011 |
16.58 |
| Oxygen |
19.95 |
25.48 |
| Silicon |
0.54 |
-- |
| Calcium |
3.5 |
-- |
| Manganese |
3.97 |
-- |
| Iron |
72.03 |
55.95 |
| Sodium |
-- |
1.99 |
Note. EDS: Energy dispersive X-ray spectroscopy; Wt: Weight; CS: Converter sludge; ZVINFs/rULGO: Zero-valent iron nanofibers/reduced ultra-large graphene oxide.
Batch Process
pH is one of the most important factors that significantly affects the decomposition of iron compounds in solutions (30,44,45). Fig. 6a shows the change in removal efficiency of COD with varying pH. As can be seen, the removal efficiency was significantly higher in acidic media due to the decomposition of iron oxides in CS, releasing iron ions according to Eqs. 4 and 5 (43).Furthermore,zero iron particles decompose into iron ions according to the equations (6-9) (14), and these iron ions activate PS as in Eq. 10 (46,47).
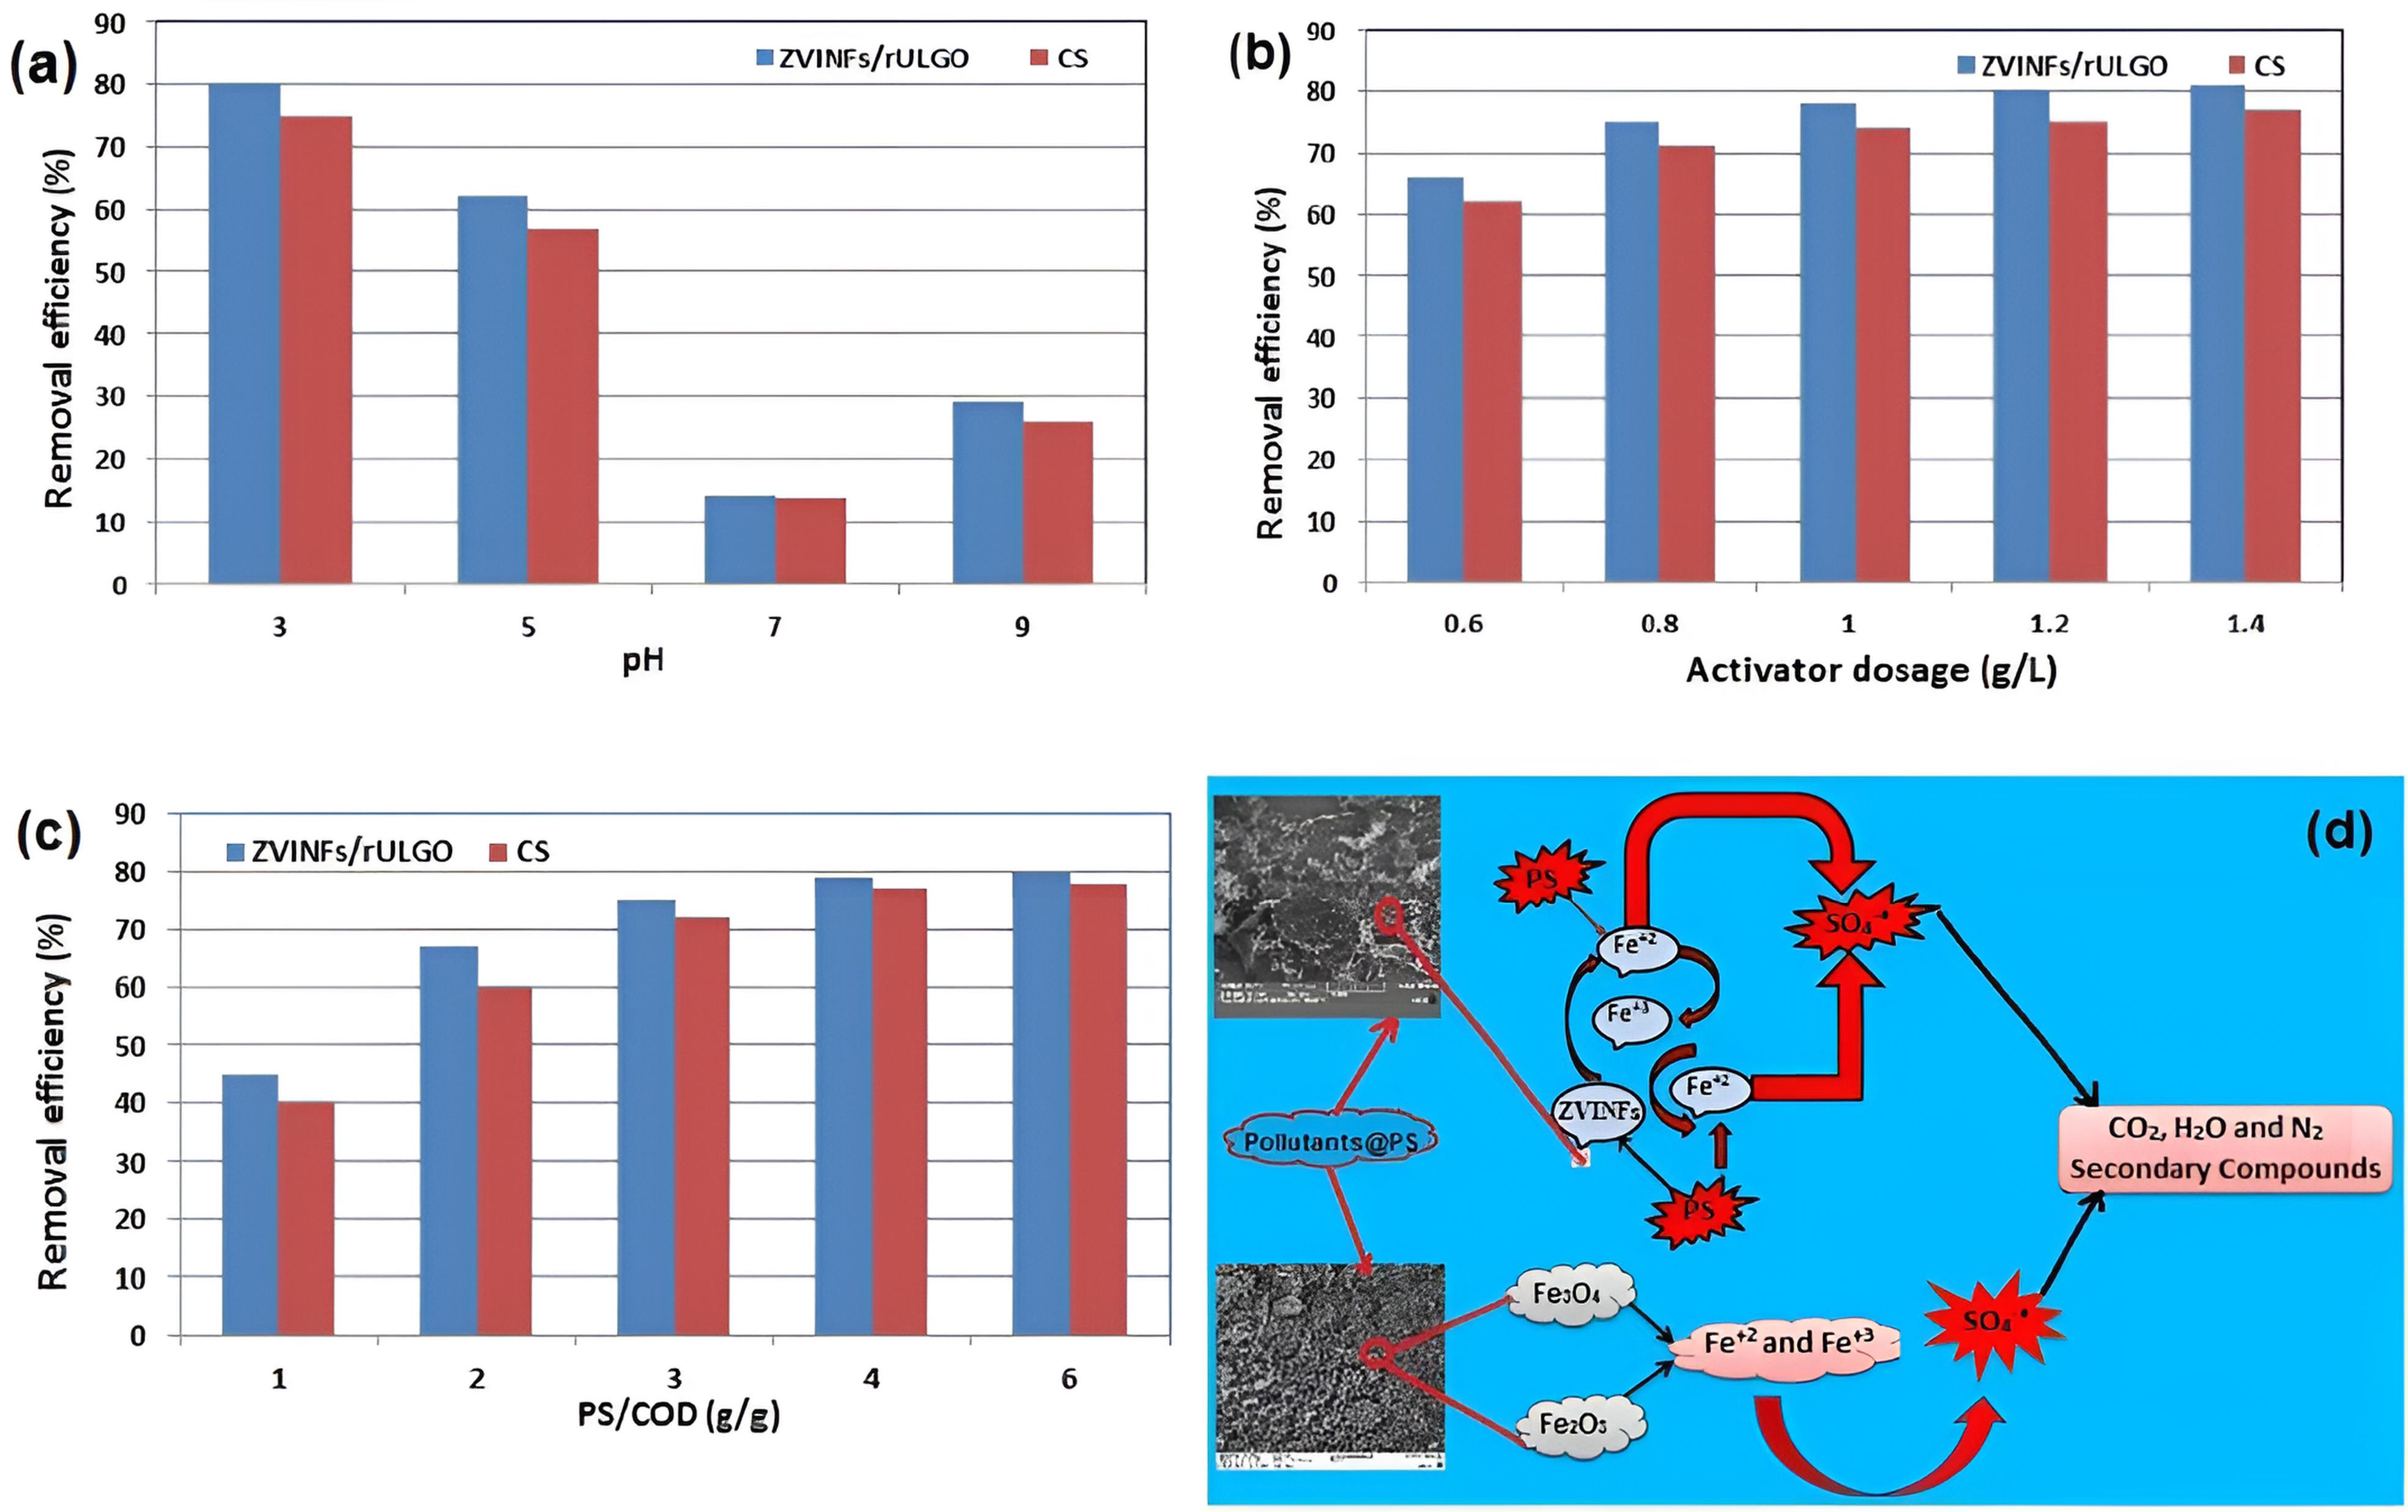
Fig. 6.
Effect of (a) pH (PS/COD ratio: 4; ZVINFs/rULGO Dosage: 1 (g/L); Reaction Time: 60 min), (b) ZVINFs/rULGO dosage (PS/COD Ratio: 4; pH 3; Reaction Time: 60 min), (c) PS/COD Mass Ratio (ZVINFs/rULGO Dosage: 1.6 (g/L); pH 3; Reaction Time: 60 min) on the COD Removal. (d) The Supposed Mechanism of Contaminants Removal by Activated PS. Note. pH: Potential of hydrogen; PS: Persulfate; COD: Chemical oxygen demand; ZVINFs/rULGO: Zero-valent iron nanofibers/reduced ultra-large graphene oxide.
.
Effect of (a) pH (PS/COD ratio: 4; ZVINFs/rULGO Dosage: 1 (g/L); Reaction Time: 60 min), (b) ZVINFs/rULGO dosage (PS/COD Ratio: 4; pH 3; Reaction Time: 60 min), (c) PS/COD Mass Ratio (ZVINFs/rULGO Dosage: 1.6 (g/L); pH 3; Reaction Time: 60 min) on the COD Removal. (d) The Supposed Mechanism of Contaminants Removal by Activated PS. Note. pH: Potential of hydrogen; PS: Persulfate; COD: Chemical oxygen demand; ZVINFs/rULGO: Zero-valent iron nanofibers/reduced ultra-large graphene oxide.
(4)
(7)
(8)
(9)
(10)
By increasing pH, the removal efficiency decreased up to pH 7 because a rise in pH levels leads to the formation of complexes and deposits of iron compounds, removing iron ions from the medium according to the equations (11 to 14) (48,49).
(13)
(14)
An increase in pH above 8 causes a slight increase in removal efficiency, as shown in Fig. 4a because strong alkaline conditions contribute to PS decomposition and sulfate radical formation, according to several steps in equations (15 to 17) (50).
(15)
(16)
(17)
The acidic condition is ideal for the decomposition of iron compounds necessary for PS activation, so pH 3 was selected for the continuous process (13,14). Acidic conditions are most suitable for systems that rely on iron ions to activate PS (51,52).
Fig. 6b illustrates the effect of activator concentration on the removal efficiency of COD. As the activator concentration increases, the removal efficiency of COD increases to a concentration of 1.2 g/L since increasing the activator concentration in the solution increases the concentration of dissolved iron ions (53). Beyond this point, the removal efficiency did not change with the increase in activator concentration because an increase in the concentration of ions beyond saturation can hinder sulfate radical according to Eq. 18(46).
(18)
The 1.2 g/L activator concentration was selected for the continuous process based on the batch study results (13,34) because the increase in the catalyst concentration beyond a certain limit causes the active sites on the surface of the catalyst to interfere with each other (54,55).
Fig. 6c presents the results of the effect of oxidant dose on the removal efficiency of COD. It was observed that rising PS dose initially increases COD removal efficiency, but this increase stopped at a certain point because an increase above the required limit may lead to the inhibition of the radical formation as depicted in the equations (19 to 20) (46).
(19)
The 1.2 g/L concentration was chosen when near stability was achieved in the removal effectiveness. After this point, increasing the concentration became useless; therefore, a PS/COD ratio of 3 was selected for the continuous process based on the batch study results. A similar trend was observed in a previous study in which the researchers attributed this ineffectiveness to the saturation of the active sites when the PS concentration exceeded a certain limit (56). Fig. 6d illustrates the proposed mechanism of contaminant removal by activated PS using CS and ZVINFs/rULGO in PRB technology.
Continuous Process
F-values for COD and NH3 degradation were 222.52 and 273.00, respectively (Table 5), showing the model’s significance, but the model’s lack of fit (LOF) is not significant (P value<0.05) (45). Furthermore, the predicted R2 and adjusted R2 valuesindicate that the model is suitable. The signal-to-noise ratios for the model should be greater than 4 to be eligible (57). The signal-to-noise ratios for COD and NH3 removals models were 51.067 and 58.099, respectively, confirming the model’s eligibility.
Table 5.
ANOVA Test for COD and NH3 Removal
|
Source
|
COD Removal
|
NH3
Removal
|
|
SS
|
df
|
Mean
square
|
F-value
|
P
Value
Probability>F
|
SS
|
df
|
Mean
square
|
F-value
|
P
Value
Probability>F
|
| Model |
4286.40 |
9 |
476.27 |
222.52 |
< 0.0001 |
4358.71 |
9 |
484.30 |
273.00 |
< 0.0001 |
| A (Activator) |
623.04 |
1 |
623.04 |
291.10 |
< 0.0001 |
824.18 |
1 |
824.18 |
464.59 |
< 0.0001 |
| B (Flow) |
3144.24 |
1 |
3144.24 |
1469.08 |
< 0.0001 |
3049.80 |
1 |
3049.80 |
1719.17 |
< 0.0001 |
| C (PV) |
288.00 |
1 |
288.00 |
134.56 |
< 0.0001 |
224.72 |
1 |
224.72 |
126.67 |
< 0.0001 |
| AB |
4.00 |
1 |
4.00 |
1.87 |
0.2139 |
10.56 |
1 |
10.56 |
5.95 |
0.0448 |
| AC |
12.25 |
1 |
12.25 |
5.72 |
0.0480 |
37.82 |
1 |
37.82 |
21.32 |
0.0024 |
| BC |
28.09 |
1 |
28.09 |
13.12 |
0.0085 |
19.80 |
1 |
19.80 |
11.16 |
0.0124 |
| A2 |
31.38 |
1 |
31.38 |
14.66 |
0.0065 |
13.30 |
1 |
13.30 |
7.50 |
0.0290 |
| B2 |
1.42 |
1 |
1.42 |
0.66 |
0.4427 |
4.89 |
1 |
4.89 |
2.76 |
0.1409 |
| C2 |
143.11 |
1 |
143.11 |
66.87 |
< 0.0001 |
163.29 |
1 |
163.29 |
92.05 |
< 0.0001 |
| Residual |
14.98 |
7 |
2.14 |
|
|
12.42 |
7 |
1.77 |
|
|
| Lack of fit |
10.27 |
3 |
3.42 |
2.91 |
0.1647 |
7.59 |
3 |
2.53 |
2.10 |
0.2435 |
| Pure error |
4.71 |
4 |
1.18 |
|
|
4.83 |
4 |
1.21 |
|
|
| Cor total |
4301.38 |
16 |
|
|
|
4371.13 |
16 |
|
|
|
|
Adjusted R2 = 0.9920, Predicted R2 = 0.9601 |
Adjusted R2 = 0.9935, Predicted R2 = 0.9705 |
Note. ANOVA: Analysis of variance; COD: Chemical oxygen demand; NH3: Ammonia; SS: Sum of squares; df: Degree of freedom; PV: Pore volume.
ANOVA was used to determine whether there were any statistically significant differences between variables (Table 6). Based on the RSM, the relationship between the COD and NH3 removal and the operating parameters (Activator, PV, and flow) was obtained as quadratic models (Eq. 21 and Eq. 22) based on BBD and ANOVA.
Table 6.
Major Organic Constituents of Unprocessed/Treated Leachate
|
Unprocessed Leachate
|
Treated Leachate
|
|
Peak No.
|
Compound
|
Time (min)
|
LC50 (ppm)
|
Area%
|
Peak
No.
|
Compound
|
Time (min)
|
LC50
(ppm)
|
Area%
|
| 1 |
Propanoic acid |
10.39 |
248.12 |
13.9 |
1 |
Propanoic acid |
8.43 |
248.12 |
1.88 |
| 1-1 |
Propanoic acid, 2-methyl- |
11.25 |
294.06 |
0.53 |
2 |
Methane, dichloro- |
8.82 |
316.87 |
0.01 |
| 1-2 |
Butanoic acid |
13.57 |
139.34 |
35.26 |
3 |
Methane, dichloro- |
8.96 |
316.87 |
0.01 |
| 2 |
Butanoic acid, 3-methyl- |
13.73 |
159.31 |
1.32 |
4 |
Methane, dichloro- |
9.26 |
316.87 |
0.02 |
| 3 |
Butanoic acid, 2-methyl- |
13.87 |
182.16 |
1.9 |
5 |
Propanoic acid |
10.05 |
248.12 |
1.05 |
| 3-1 |
Propanedioic acid, propyl- |
18.84 |
120.70 |
31.14 |
6 |
Ethene, tetrachloro- |
10.37 |
15.65 |
3.56 |
| 4 |
Pentanoic acid, 4-methyl |
15.15 |
110.13 |
1.05 |
7 |
Butanoic acid |
11.54 |
139.34 |
18.95 |
| 4-1 |
Hexanoicacid |
16.45 |
56.57 |
36.45 |
8 |
Butanoic acid, 3-methyl- |
12.09 |
159.31 |
1.24 |
| 5 |
5-Methylhexanoic |
16.76 |
22.75 |
0.3 |
9 |
Pentanoic acid |
13.41 |
299.91 |
19.67 |
| 6 |
Hexanoic acid, 4-methyl- |
16.81 |
53.71 |
0.15 |
10 |
Furan, tetrahydro-2,5-dimethyl- |
13.83 |
616.09 |
0.65 |
| 7 |
Propanoic acid, 3-(methylthio)- |
17.51 |
169.01 |
0.6 |
11 |
Benzaldehyde |
13.99 |
13.87 |
1.55 |
| 8 |
Hexanoic acid, 2-ethyl- |
17.61 |
27.76 |
0.9 |
12 |
2(3H)-Furanone, 5-ethyldihydro- |
15.74 |
397.23 |
1.78 |
| 9 |
Cyclohexanecarboxylic acid |
18.01 |
53.73 |
5.32 |
13 |
Acetophenone |
16.01 |
44.74 |
0.11 |
| 10 |
Octanoic acid |
18.37 |
9.04 |
16.2 |
14 |
Cyclohexanecarboxylic acid |
17.13 |
53.73 |
1.91 |
| 11 |
Benzoic acid |
18.50 |
106.35 |
1.02 |
15 |
2(3H)-Furanone, 5-hexyldihydro- |
17.42 |
23.06 |
0.64 |
| 12 |
Butanoic acid, 4-(methylthio)- |
18.6 |
124.53 |
0.45 |
16 |
Octanoic acid |
17.69 |
9.04 |
0.53 |
| 13 |
Octanoic acid |
18.86 |
9.04 |
0.3 |
17 |
2(3H)-Furanone, 5-butyldihydro- |
18.72 |
146.00 |
0.07 |
| 14 |
2-Piperidinone |
19.06 |
473.88 |
0.15 |
18 |
Mandelamide |
19.29 |
445.35 |
0.07 |
| 15 |
Benzeneacetic acid |
19.65 |
70.16 |
6.66 |
19 |
Bis(2-ethylhexyl) phthalate |
23.30 |
0.33 |
1.07 |
| 16 |
Caprolactam |
19.86 |
329.35 |
0.35 |
20 |
1H-Indene, 2,3-dihydro-1,1,3-trimethyl-3-phenyl- |
25.11 |
1.09 |
1.05 |
| 16-1 |
Benzenepropanoic acid |
20.74 |
61.13 |
7.21 |
21 |
2-Propenoic acid, 3-(4-methoxyphenyl)-, 2-ethylhexyl ester |
25.37 |
0.54 |
0.34 |
| 17 |
2H-1-Benzopyran-2-one |
21.14 |
87.84 |
0.3 |
22 |
Cyclopentadecanone, 2-hydroxy- |
25.73 |
137 |
0.17 |
| 18 |
Bicyclo[3.1.1]heptane, 2,6,6-trimethyl - |
22.25 |
0.93 |
0.2 |
23 |
2,4-Diphenyl-4-methyl-1-pentene |
25.92 |
0.82 |
0.56 |
| 19 |
2H-Indol-2-one, 1,3-dihydro- |
22.45 |
101.09 |
0.3 |
|
|
|
|
|
| 20 |
Ibuprofen |
23.90 |
2.55 |
0.4 |
|
|
|
|
|
| 21 |
7-Pentadecyne |
24.25 |
0.58 |
0.2 |
|
|
|
|
|
| 22 |
Acetic acid, phenoxy-, methyl ester |
24.53 |
20.09 |
1.15 |
|
|
|
|
|
| 23 |
2,2-Dimethyl-5-hydroxy-7-methoxy-chromanone |
24.87 |
8.96 |
0.3 |
|
|
|
|
|
| 24 |
Cyclopentadecanone, 2-hydroxy- |
25.85 |
137 |
0.1 |
|
|
|
|
|
| 25 |
11-Dodecenyl trifluoroacetate |
26.20 |
1.72 |
0.4 |
|
|
|
|
|
| 26 |
6(E),8(E)-Heptadecadiene |
26.33 |
0.21 |
0.5 |
|
|
|
|
|
| 27 |
1,2-Benzenedicarboxylic acid, bis(2-methylpropyl) ester |
26.45 |
4.16 |
0.2 |
|
|
|
|
|
| 28 |
1,2-Benzenedicarboxylic acid, diisooctyl ester |
26.98 |
1.82 |
0.3 |
|
|
|
|
|
| 29 |
Di-(2-ethylhexyl)phthalate |
27.12 |
0.33 |
2.2 |
|
|
|
|
|
| 30 |
Di-(2-ethylhexyl)phthalate |
27.22 |
0.33 |
5.05 |
|
|
|
|
|
| 31 |
Di-(2-ethylhexyl)phthalate |
27.36 |
0.33 |
5.7 |
|
|
|
|
|
| 32 |
1,2-Benzenedicarboxylic acid, diisooctyl ester |
27.59 |
1.82 |
3.6 |
|
|
|
|
|
| 33 |
1,2-Benzenedicarboxylic acid, diisooctyl ester |
27.71 |
1.82 |
2.98 |
|
|
|
|
|
| 34 |
Di-(2-ethylhexyl)phthalate |
27.79 |
0.33 |
2.95 |
|
|
|
|
|
| 35 |
Di-(2-ethylhexyl)phthalate |
27.97 |
0.33 |
7.1 |
|
|
|
|
|
(21)
(22)
Where A is activator, B is flow, and C is PV.
Figs. 7A through 7F show 3D diagrams of the relationship between operating parameters (PV and flow) in the presence of an activator at pH 3 and their effect on degradation efficiency.Figs. 7A and 7B illustrate the relationship between flow and PV in the presence of ZVINFs/rULGO alone and their effect on COD and NH3 removal efficiency, respectively. Figs. 7E and 7F display the relationship between flow and PV in the presence of CS alone and their effect on removal efficiency.Figs. 7C and 7D show the relationship between flow and PV in the presence of a 50% CS + 50% ZVINFs/rULGO and their effect on removal efficiency. The highest values of removal were attributed to ZVINFs/rULGO alone because the expanded graphene atoms are more stable in the rarefied medium, thus supplying the PRB with the necessary iron ions to activate the PS more effectively. However, increasing the PV number decreases the removal efficiency due to a reduction in the iron ion content as the flow continues or surface passivation caused by the pollutant deposition on the ZVINFs/rULGO surface, which prevents the process of supplying iron ions (14,34). This underscores the need to compensate for the loss of the activator by injecting it into PRB. Removal efficacy can also be improved by increasing the number of PRB.
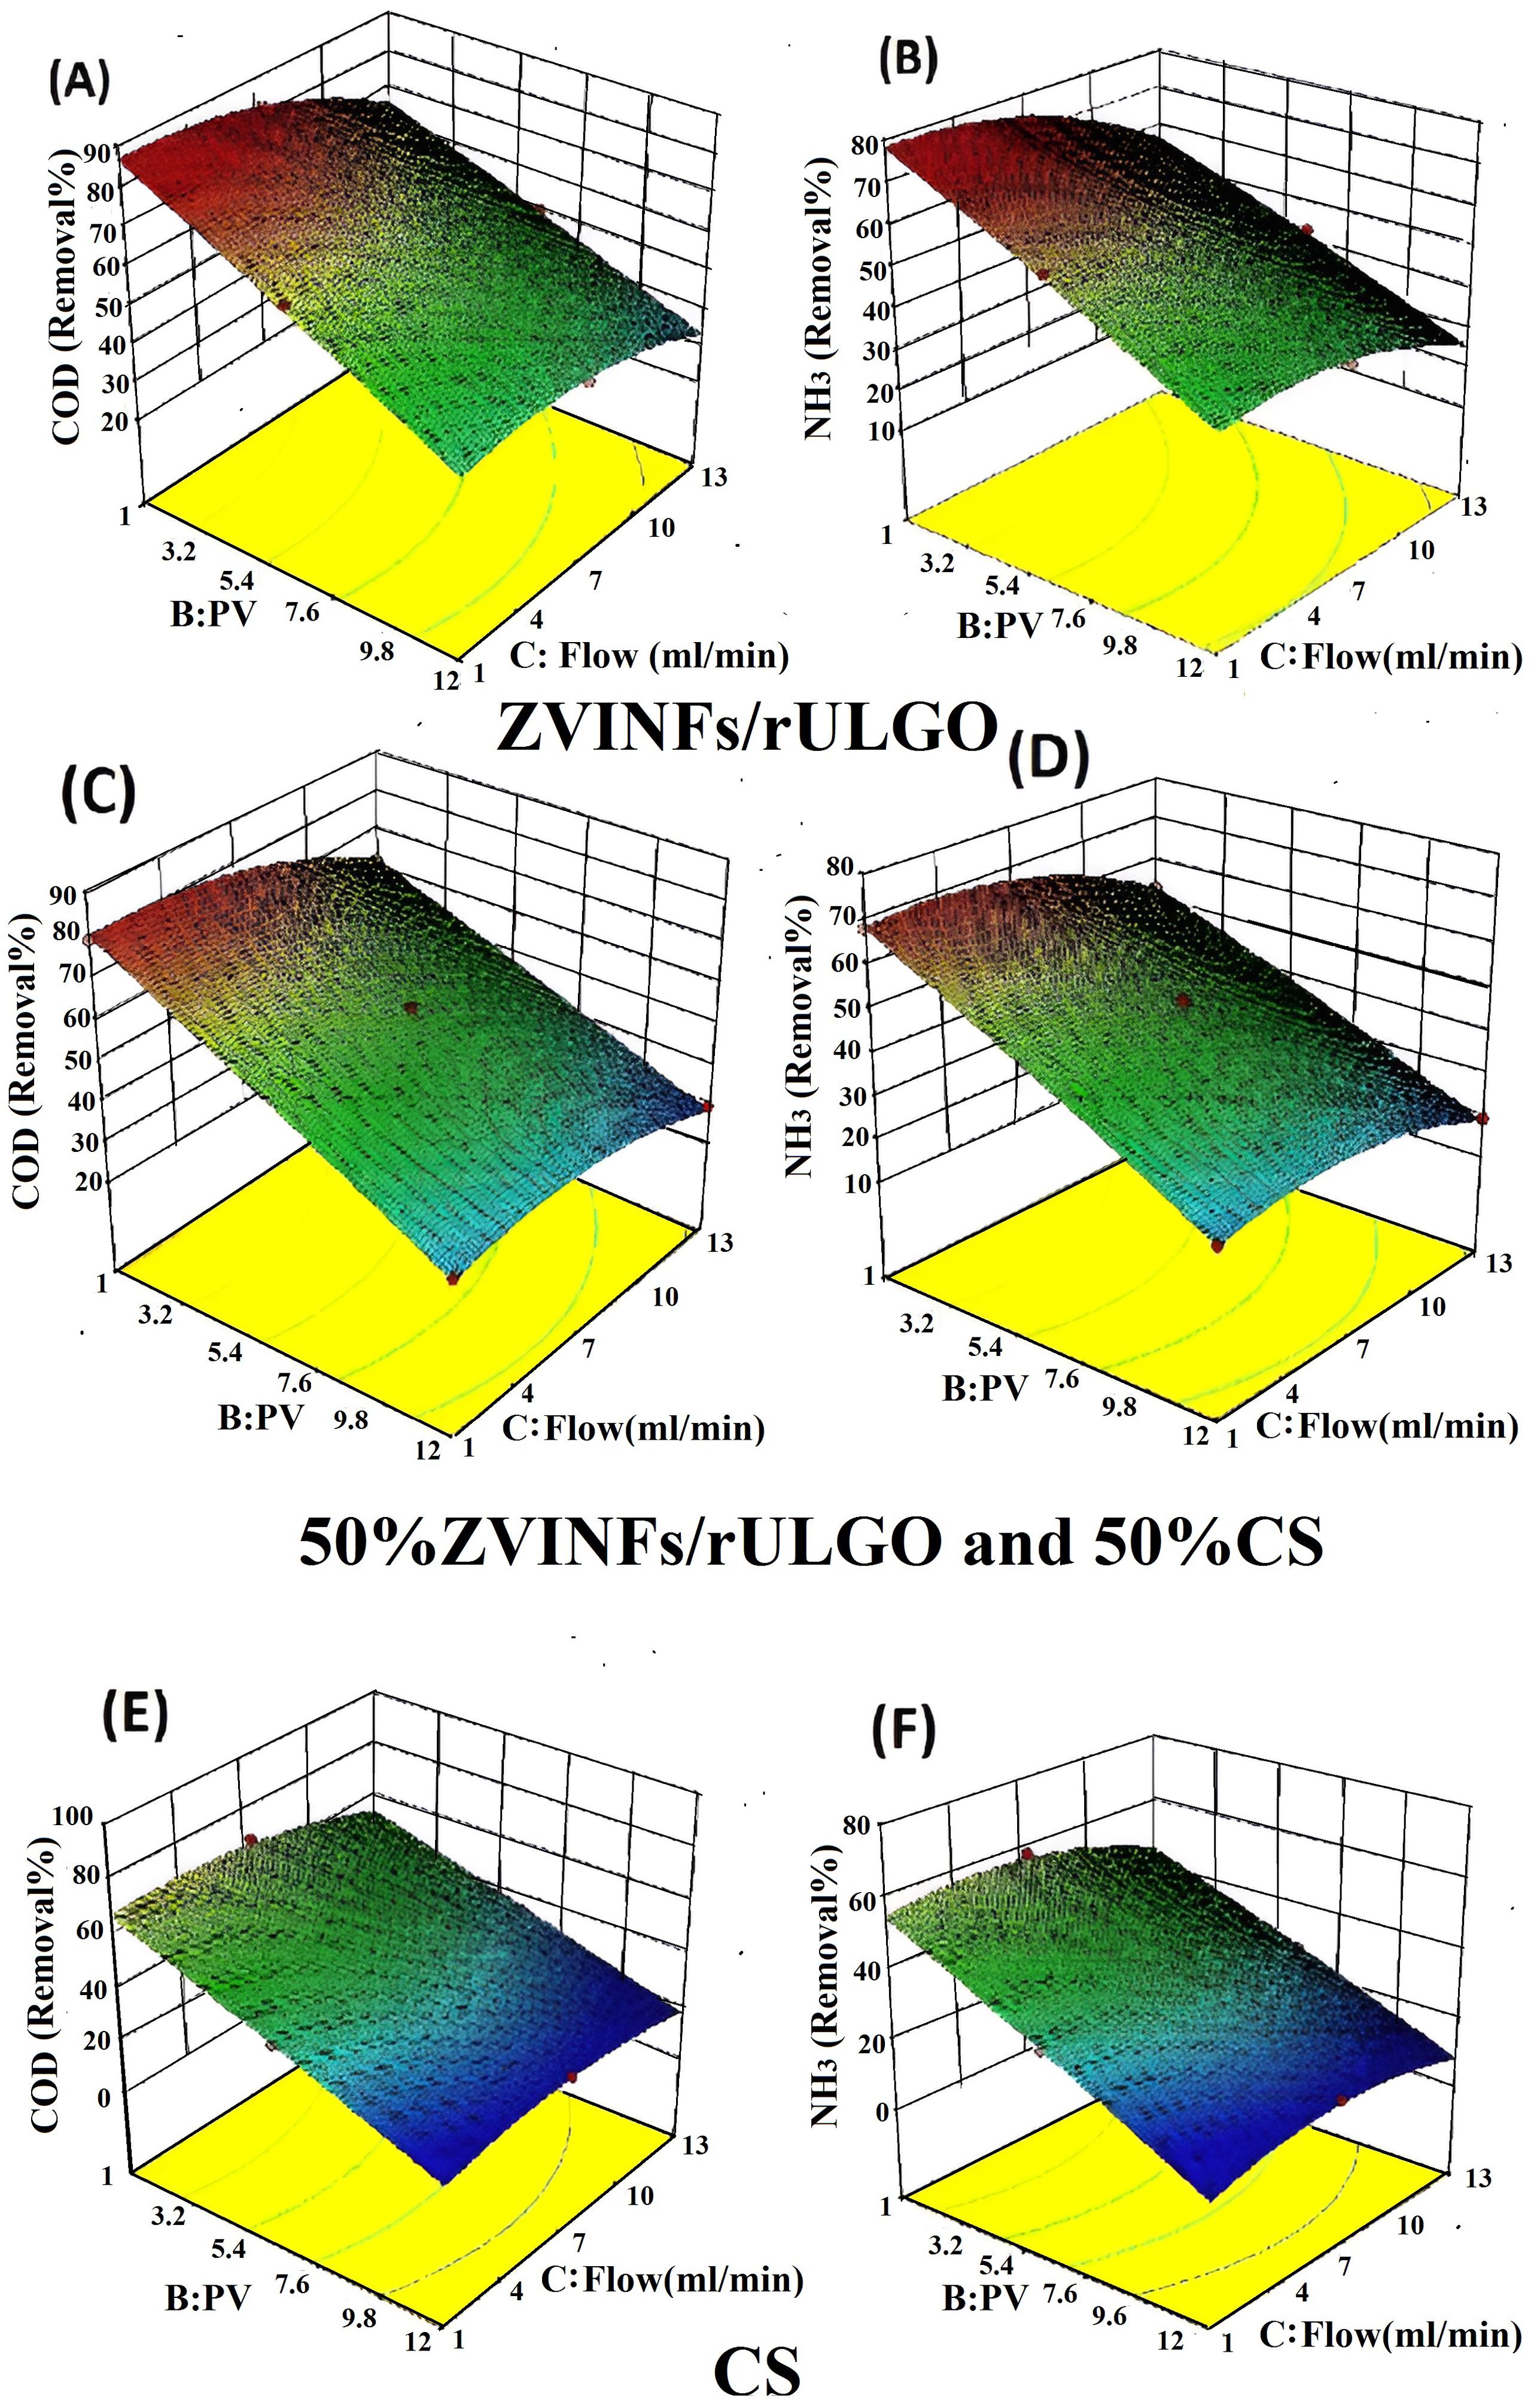
Fig. 7.
3D Diagrams for Relationship Between Operating Parameters (PV and Flow) in the Presence of Activator, (A and B) in the Presence of ZVINFs/rULGO Alone, (C and D) in the Presence of 50% CS + 50 ZVINFs/rULGO), (E and F) in the Presence of CS Alone. Note. PV: Pore volume; ZVINFs/rULGO: Zero-valent iron nanofibers/reduced ultra-large graphene oxide; CS: Converter sludge
.
3D Diagrams for Relationship Between Operating Parameters (PV and Flow) in the Presence of Activator, (A and B) in the Presence of ZVINFs/rULGO Alone, (C and D) in the Presence of 50% CS + 50 ZVINFs/rULGO), (E and F) in the Presence of CS Alone. Note. PV: Pore volume; ZVINFs/rULGO: Zero-valent iron nanofibers/reduced ultra-large graphene oxide; CS: Converter sludge
Figs. 7C, 7D, 7E, and 7F indicate lower removal efficacy when using CS because nano-CS is washed away with the leachate flow (17). Therefore, the PS/ZVINFs/rULGO system was chosen for this study. Continuous operation of PRB leads to reduced performance due to factors related to the physicochemical properties of the active substance, as well as engineering and procedural characteristics of PRB (58).
The major organic compounds identified in unprocessed and treated leachate (using GC/MS analysis) are illustrated in Table 6. The PS/ ZVINFs/rULGO system increased the value of the biodegradability from 0.24 before treatment to 0.67 after treatment in the presence of ZVINFs/rULGO lone as an activator. This indicates that part of the refractory-contaminated materials in the leachate were removed and another part was decomposed into simpler compounds (6,39). Additionally, the toxicity of unprocessed and treated leachate was 0.263% and 0.225%, respectively, suggesting a reduction of more than 85%.
4. Conclusion
This study proposed a system for leachate treatment using permeable barriers reinforced with PS within the site. The active layer was enriched with two types of activators (CS and ZVINFs/rULGO). The results indicated that ZVINFs/rULGO outperformed CS when used as an activator of PS in PRB technology. The nano-CS was prepared by grinding it in a ball mill, while EG was prepared via chemical intercalation method. The XRD analysis of CS and ZVINFs/rULGO revealed the presence of iron oxides and Fe°, respectively. Moreover, EDS analysis showed an iron component ratio of more than 70% and 55% in CS and ZVINFs/rULGO, respectively. Nevertheless, the removal effectiveness decreased as the number of treated batches increased.
Acknowledgements
The authors acknowledge the Nanotechnology Research Center of the Graduate Faculty of Environment, University of Tehran, and Sima Aminifrom the laboratory of the Graduate Faculty of Environment, University of Tehran, for their contribution to the interpretation of GC-Mass spectra.
Competing Interests
None declared.
Ethical Approval
Not applicable.
Funding
None.
References
- Chou YC, Lo SL, Kuo J, Yeh CJ. Derivative mechanisms of organic acids in microwave oxidation of landfill leachate. J Hazard Mater 2013; 254-255:293-300. doi: 10.1016/j.jhazmat.2013.04.011 [Crossref] [ Google Scholar]
- Mokhtarani N, Khodabakhshi S, Ayati B. Optimization of photocatalytic post-treatment of composting leachate using UV/TiO2. Desalin Water Treat 2016; 57(47):22232-43. doi: 10.1080/19443994.2015.1130652 [Crossref] [ Google Scholar]
- Kumari P, Gupta NC, Kaur A. A review of groundwater pollution potential threats from municipal solid waste landfill sites: assessing the impact on human health. Avicenna J Environ Health Eng 2017; 4(1):e11525. doi: 10.5812/ajehe.11525 [Crossref] [ Google Scholar]
- Orescanin V, Kollar R, Ruk D, Halkijevic I, Kuspilic M. Combined treatment of old sanitary landfill leachate. Avicenna J Environ Health Eng 2016; 3(1):e7647. doi: 10.17795/ajehe-7647 [Crossref] [ Google Scholar]
- Pazoki M, Abdoli MA, Karbassi A, Mehrdadi N, Yaghmaeian K. Attenuation of municipal landfill leachate through land treatment. J Environ Health Sci Eng 2014; 12(1):12. doi: 10.1186/2052-336x-12-12 [Crossref] [ Google Scholar]
- Soubh A, Mokhtarani N. The post treatment of composting leachate with a combination of ozone and persulfate oxidation processes. Rsc Adv 2016; 6(80):76113-22. doi: 10.1039/c6ra09539a [Crossref] [ Google Scholar]
- Abdul Aziz H, Syed Zainal SF, Alazaiza M. Optimization of coagulation-flocculation process of landfill leachate by Tin(IV) chloride using response surface methodology. Avicenna J Environ Health Eng 2019; 6(1):41-8. doi: 10.34172/ajehe.2019.06 [Crossref] [ Google Scholar]
- Rusdiza N, Abdul Aziz H, Omar Fatehah M. Potential use of polyaluminium chloride and tobacco leaf as coagulant and coagulant aid in post-treatment of landfill leachate. Avicenna J Environ Health Eng 2015; 2(2):e5836. doi: 10.17795/ajehe-5836 [Crossref] [ Google Scholar]
- Naveen BP, Mahapatra DM, Sitharam TG, Sivapullaiah PV, Ramachandra TV. Physico-chemical and biological characterization of urban municipal landfill leachate. Environ Pollut 2017; 220(Pt A):1-12. doi: 10.1016/j.envpol.2016.09.002 [Crossref] [ Google Scholar]
- Ahmad AA, Soubh AM. The effect of magnetic treatment on some physico-chemical properties of landfill leachate (Wadi Al-Hada). Pollution 2024; 10(1):383-91. doi: 10.22059/poll.2023.364132.2035 [Crossref] [ Google Scholar]
- Abu Amr SS, Abdul Aziz H, Adlan MN, Bashir MJ. Pretreatment of stabilized leachate using ozone/persulfate oxidation process. Chem Eng J 2013; 221:492-9. doi: 10.1016/j.cej.2013.02.038 [Crossref] [ Google Scholar]
- Zhen G, Lu X, Zhao Y, Chai X, Niu D. Enhanced dewaterability of sewage sludge in the presence of Fe(II)-activated persulfate oxidation. Bioresour Technol 2012; 116:259-65. doi: 10.1016/j.biortech.2012.01.170 [Crossref] [ Google Scholar]
- Soubh AM, Baghdadi M, Abdoli MA, Aminzadeh B. Activation of persulfate using an industrial iron-rich sludge as an efficient nanocatalyst for landfill leachate treatment. Catalysts 2018; 8(5):218. doi: 10.3390/catal8050218 [Crossref] [ Google Scholar]
- Soubh AM, Baghdadi M, Abdoli MA, Aminzadeh B. Zero-valent iron nanofibers (ZVINFs) immobilized on the surface of reduced ultra-large graphene oxide (rULGO) as a persulfate activator for treatment of landfill leachate. J Environ Chem Eng 2018; 6(5):6568-79. doi: 10.1016/j.jece.2018.10.011 [Crossref] [ Google Scholar]
- Oh SY, Kang SG, Kim DW, Chiu PC. Degradation of 2,4-dinitrotoluene by persulfate activated with iron sulfides. Chem Eng J 2011; 172(2-3):641-6. doi: 10.1016/j.cej.2011.06.023 [Crossref] [ Google Scholar]
- Rahmani AR, Zamani F, Shabanloo A, Almasi H. Effect of silica on the ultrasonic/persulfate process for degradation of acid black 1 in aqueous solutions. Avicenna J Environ Health Eng 2016; 3(2):e5923. doi: 10.5812/ajehe.5923 [Crossref] [ Google Scholar]
- Soubh AM, Abdoli MA, Baghdadi M, Aminzadeh B. Assessment of converter sludge from Esfahan steel company as a persulfate nano-activator for permeable reactive barriers (PRBs) in landfill leachate treatment. Pollution 2019; 5(2):395-409. doi: 10.22059/poll.2018.258975.449 [Crossref] [ Google Scholar]
- Soubh AM. Assessment of steel slag as a persulfate activator for treatment of landfill leachate. Open Access J Waste Manag Xenobiotics 2019; 2(3):1-6. doi: 10.23880/oajwx-16000125 [Crossref] [ Google Scholar]
- Soubh AM, Kerhaili YH. Review on using persulfate as an activator for wastewater treatment. Open Access J Waste Manag Xenobiotics 2022; 5(4):1-6. doi: 10.23880/oajwx-16000179 [Crossref] [ Google Scholar]
- Samadi MT, Asgari G, Rahmani AR, Ghavami Z. The use of acid-washed iron/aluminum mixture in permeable reactive barrier for the elimination of different heavy metal ions from water. Avicenna J Environ Health Eng 2017; 4(2):29-34. doi: 10.15171/ajehe.2017.06 [Crossref] [ Google Scholar]
- Faisal AA, Ali IM, Naji LA, Madhloom HM, Al-Ansari N. Using different materials as a permeable reactive barrier for remediation of groundwater contaminated with landfill’s leachate. Desalin Water Treat 2020; 175:152-63. doi: 10.5004/dwt.2020.24890 [Crossref] [ Google Scholar]
- Jayasundara RB, Udayagee KP, Karunarathna AK, Manage PM, Nugara RN, Abhayapala KM. Permeable reactive barriers as an in situ groundwater remediation technique for open solid waste dumpsites: a review and prospect. Water Air Soil Pollut 2023; 234(1):50. doi: 10.1007/s11270-022-06056-z [Crossref] [ Google Scholar]
- Kanafin YN, Abdirova P, Arkhangelsky E, Dionysiou DD, Poulopoulos SG. UVA and goethite activated persulfate oxidation of landfill leachate. Chem Eng J Adv 2023; 14:100452. doi: 10.1016/j.ceja.2023.100452 [Crossref] [ Google Scholar]
- Chiemchaisri C, Chiemchaisri W, Witthayapirom C. Remediation of MSW landfill leachate by permeable reactive barrier with vegetation. Water Sci Technol 2015; 71(9):1389-97. doi: 10.2166/wst.2015.111 [Crossref] [ Google Scholar]
- Cho YC, Hsu CC, Lin YP. Integration of in-situ chemical oxidation and permeable reactive barrier for the removal of chlorophenols by copper oxide activated peroxydisulfate. J Hazard Mater 2022; 432:128726. doi: 10.1016/j.jhazmat.2022.128726 [Crossref] [ Google Scholar]
- Siegrist RL, Crimi M, Simpkin TJ. In Situ Chemical Oxidation for Groundwater Remediation. New York: Springer; 2011.
- National Research Council. Groundwater and Soil Cleanup: Improving Management of Persistent Contaminants. Washington, DC: National Academies Press; 1999.
- Huling SG, Pivetz BE. In-Situ Chemical Oxidation. Washington, DC: USEPA; 2006.
- Bhalla B, Saini MS, Jha MK, Scientist C, Gujral P, City S. Assessment of industrial byproducts as permeable reactive barriers for landfill leachate management. Int J Res Eng Technol 2014; 3(3):637-48. [ Google Scholar]
- Graça CA, Fugita LT, de Velosa AC, Teixeira A. Amicarbazone degradation promoted by ZVI-activated persulfate: study of relevant variables for practical application. Environ Sci Pollut Res Int 2018; 25(6):5474-83. doi: 10.1007/s11356-017-0862-9 [Crossref] [ Google Scholar]
- Koulivand H, Shahbazi A. Statistical optimization and modeling of methylene blue adsorption onto graphene oxide in batch and fixed-bed column. Avicenna J Environ Health Eng 2018; 5(1):21-34. doi: 10.15171/ajehe.2018.04 [Crossref] [ Google Scholar]
- Parsa N, Rezai H. Removal of lead ions from aqueous solutions using melamine-modified nano graphene oxide. Avicenna J Environ Health Eng 2020; 7(2):55-65. doi: 10.34172/ajehe.2020.09 [Crossref] [ Google Scholar]
- Samarghandi MR, Poormohammadi A, Shanesaz S, Godini K. Comparison between the performance of activated carbon and graphene in removal of reactive red 198. Avicenna J Environ Health Eng 2017; 4(1):e6021. doi: 10.5812/ajehe.6021 [Crossref] [ Google Scholar]
- Soubh AM, Abdoli MA, Ahmad LA. Optimizing the removal of methylene blue from aqueous solutions using persulfate activated with nanoscale zero valent iron (nZVI) supported by reduced expanded graphene oxide (rEGO). Environ Health Eng Manag 2021; 8(1):15-24. doi: 10.34172/ehem.2021.03 [Crossref] [ Google Scholar]
- Daoud W, Ebadi T, Fahimifar A. Removal of hexavalent chromium from aqueous solutions using micro zero-valent iron supported by bentonite layer. Water Sci Technol 2015; 71(5):667-74. doi: 10.2166/wst.2014.493 [Crossref] [ Google Scholar]
- Dong L, Chen Z, Lin S, Wang K, Ma C, Lu H. Reactivity-controlled preparation of ultralarge graphene oxide by chemical expansion of graphite. Chem Mater 2017; 29(2):564-72. doi: 10.1021/acs.chemmater.6b03748 [Crossref] [ Google Scholar]
- Fan M, Li T, Hu J, Cao R, Wu Q, Wei X. Synthesis and characterization of reduced graphene oxide-supported nanoscale zero-valent iron (nZVI/rGO) composites used for Pb(II) removal. Materials (Basel) 2016; 9(8):687. doi: 10.3390/ma9080687 [Crossref] [ Google Scholar]
- Walter WG. Standard methods for the examination of water and wastewater. Am J Public Health Nations Health 1961; 51(6):940. doi: 10.2105/AJPH.51.6.940-a [Crossref] [ Google Scholar]
- Ranjbari A, Mokhtarani N. Post treatment of composting leachate using ZnO nanoparticles immobilized on moving media. Appl Catal B Environ 2018; 220:211-21. doi: 10.1016/j.apcatb.2017.08.042 [Crossref] [ Google Scholar]
- Jorge N, Teixeira AR, Gomes A, Lucas MS, Peres JA. Sulfate radical advanced oxidation processes: activation methods and application to industrial wastewater treatment. Eng Proc 2023; 56(1):162. doi: 10.3390/asec2023-15500 [Crossref] [ Google Scholar]
- Ghaedi M, Daneshyar A, Asfaram A, Purkait MK. Adsorption of naphthalene onto high-surface-area nanoparticle loaded activated carbon by high performance liquid chromatography: response surface methodology, isotherm and kinetic study. RSC Adv 2016; 6(59):54322-30. doi: 10.1039/c6ra09500c [Crossref] [ Google Scholar]
- Kumar A, Prasad B, Mishra IM. Optimization of process parameters for acrylonitrile removal by a low-cost adsorbent using Box-Behnken design. J Hazard Mater 2008; 150(1):174-82. doi: 10.1016/j.jhazmat.2007.09.043 [Crossref] [ Google Scholar]
- Soubh AM, Ghalebizade M. Using nano-converter sludge of steel company as a persulfate catalyst for removing methylene blue. Syrian J Agric Res 2020; 7(6):192-206. [ Google Scholar]
- Temiz K, Olmez-Hanci T, Arslan-Alaton I. Zero-valent iron-activated persulfate oxidation of a commercial alkyl phenol polyethoxylate. Environ Technol 2016; 37(14):1757-67. doi: 10.1080/09593330.2015.1131751 [Crossref] [ Google Scholar]
- Silveira JE, Barreto-Rodrigues M, Cardoso TO, Pliego G, Munoz M, Zazo JA. Nanoscale Fe/Ag particles activated persulfate: optimization using response surface methodology. Water Sci Technol 2017; 75(9-10):2216-24. doi: 10.2166/wst.2017.063 [Crossref] [ Google Scholar]
- Dong Z, Wang F, Song X, Zhang M, Jiang C, Sun F. Fe (II)-activated persulfate oxidation effectively degrades iodoform in water: influential factors and kinetics analysis. Arab J Chem 2020; 13(4):5009-17. doi: 10.1016/j.arabjc.2020.01.023 [Crossref] [ Google Scholar]
- Yang F, Yin C, Zhang M, Zhu J, Ai X, Shi W. Enhanced Fe(III)/Fe(II) redox cycle for persulfate activation by reducing sulfur species. Catalysts 2022; 12(11):1435. doi: 10.3390/catal12111435 [Crossref] [ Google Scholar]
- Ahmad A, Gu X, Li L, Lv S, Xu Y, Guo X. Efficient degradation of trichloroethylene in water using persulfate activated by reduced graphene oxide-iron nanocomposite. Environ Sci Pollut Res Int 2015; 22(22):17876-85. doi: 10.1007/s11356-015-5034-1 [Crossref] [ Google Scholar]
- Al-Shamsi MA, Thomson NR. Treatment of organic compounds by activated persulfate using nanoscale zerovalent iron. Ind Eng Chem Res 2013; 52(38):13564-71. doi: 10.1021/ie400387p [Crossref] [ Google Scholar]
- Shapiro J. On the measurement of ferrous iron in natural waters. Limnol Oceanogr 1966; 11(2):293-8. doi: 10.4319/lo.1966.11.2.0293 [Crossref] [ Google Scholar]
- Gao Y, Champagne P, Blair D, He O, Song T. Activated persulfate by iron-based materials used for refractory organics degradation: a review. Water Sci Technol 2020; 81(5):853-75. doi: 10.2166/wst.2020.190 [Crossref] [ Google Scholar]
- Li X, Yuan L, Zhao L. A comparative study on oxidation of acidic red 18 by persulfate with ferrous and ferric ions. Catalysts 2020; 10(6):698. doi: 10.3390/catal10060698 [Crossref] [ Google Scholar]
- Monteagudo JM, Durán A, González R, Expósito AJ. In situ chemical oxidation of carbamazepine solutions using persulfate simultaneously activated by heat energy, UV light, Fe2 + ions, and H2O2. Appl Catal B Environ 2015; 176-177:120-9. doi: 10.1016/j.apcatb.2015.03.055 [Crossref] [ Google Scholar]
- Zhang H, Wu X, Yang S, Xue G, Gong C, Wang L. Degradation of bisphenol A by persulfate activation of MoS2 composite iron tailings. Water Sci Technol 2023; 88(8):1927-43. doi: 10.2166/wst.2023.321 [Crossref] [ Google Scholar]
- Fernández-Velayos S, Menéndez N, Herrasti P, Mazarío E. Ofloxacin degradation over nanosized Fe3O4 catalyst via thermal activation of persulfate ions. Catalysts 2023; 13(2):256. doi: 10.3390/catal13020256 [Crossref] [ Google Scholar]
- Zhang J, Chen Y, Liang J, Xu H. Removal of norfloxacin by combining persulfate with nano zero-valent iron modified by activated carbon and copper nanocomposite. Environ Eng Res 2023; 28(5):220513. doi: 10.4491/eer.2022.513 [Crossref] [ Google Scholar]
- Prakash Maran J, Manikandan S, Thirugnanasambandham K, Vigna Nivetha C, Dinesh R. Box-Behnken design based statistical modeling for ultrasound-assisted extraction of corn silk polysaccharide. Carbohydr Polym 2013; 92(1):604-11. doi: 10.1016/j.carbpol.2012.09.020 [Crossref] [ Google Scholar]
- Yang YX, Chen JK, Zhao L, You YQ, Chen ZJ, Cao JN. A kinetic-based zeolite PRB design method for remediating groundwater polluted by high NH4 + MSW leachate considering spatio-temporal concentration evolutions. Environm Technol Innov 2023; 29:103020. doi: 10.1016/j.eti.2023.103020 [Crossref] [ Google Scholar]