Avicenna J Environ Health Eng. 9(1):35-44.
doi: 10.34172/ajehe.2022.05
Original Article
Removal of Microorganisms by UVC Radiation From the Air of Hospital
Maryam Dashti 1  , Abdollah Dargahi 2 , Hadi Sadeghi 1, * , Mehdi Vosoughi 1, 2 , Seyed Ahmad Mokhtari 1
Author information:
1Department of Environmental Health Engineering, School of Health, Ardabil University of Medical Sciences, Ardabil, Iran
2Social Determinants of Health Research Center, Ardabil University of Medical Sciences, Ardabil, Iran
Abstract
Currently, UVC radiation is used in hospitals to eliminate microorganisms and reduce adverse health effects in operating rooms (ORs) and protective environment rooms (PERs). The purpose of this study was to investigate the effect of UVC irradiation on bioaerosols in ORs and PERs. This experimental study was performed in ORs and PERs in a hospital. Bioaerosols were evaluated according to the National Institute for Occupational Safety and Health (NIOSH) standard (No. 0800). The samples were collected from indoor air of rooms before irradiation and after UVC(254 nm) irradiation for 20 and 480 minutes. The sample size of the study was determined to be 432 (216 fungi and 216 bacteria). The difference between the mean concentration of bioaerosols in the UVC radiation at two intervals (20 and 480 minutes) was significant, which indicates a decrease in the concentration of bioaerosols by increasing the duration of UVC radiation. Some bacteria, such as group B Streptococcus, Lactobacillus, and Listeria, were entirely killed after 20 minutes of irradiation; however, complete removal of the bacteria such as Staphylococcus pneumoniae and Staphylococcus saprophyticus was observed after 480 minutes of UVC irradiation. Fungi, such as Alternaria, Stofelim, and Mucor had a 100% reduction after 20 minutes of UVC irradiation, and Rhizopus and Aspergillus fumigatus showed a 100% decrease after 480 minutes of UVC irradiation. Other isolated fungi such as Cladosporium, Penicillium, Aspergillus niger, Rhodotorula, and Alternaria showed a decrease of 75%-98.78%. The ultraviolet (UV) sensitivity of bacterial and fungal bioaerosols depends strongly on their type. The results from this study may offer an important understanding of the control of indoor bioaerosols using UVC irradiation and help abate the environmental impacts of airborne microbes.
Keywords: UVC radiation, Bio-aerosol, Hospital, Operating room, Protective environment room
Copyright and License Information
© 2022 The Author(s); Published by Hamadan University of Medical Sciences.
This is an open-access article distributed under the terms of the Creative Commons Attribution License (
http://creativecommons.org/licenses/by/4.0), which permits unrestricted use, distribution, and reproduction in any medium provided the original work is properly cited.
Please cite this article as follows: Dashti M, Dargahi A, Sadeghi H, Vosoughi M, Mokhtari SA. Removal of microorganisms by uvc radiation from the air of hospital. Avicenna J Environ Health Eng. 2022; 9(1):35-44. doi:10.34172/ajehe.2022.05
1. Introduction
Airborne transmitted pathogenic infections can cause various diseases and severely threaten human health and life (1). Indoor pathogens can be transmitted through the ventilating, heating, and air conditioning systems. Talking for 5 minutes and a cough can produce 3000 droplets, and a sneeze can generate 40 000 droplets. Typical bioaerosols have a size greater than 1 and smaller than 50 μm (2-4). The aerodynamic diameter of the airborne biological particles is in the range of 0.001 to 100 µm (5-7). One of the main ways of human exposure to these microorganisms is inhalation, which may produce various health effects such as respiratory disease, acute toxic effects, allergies, and cancer (8-11). The hospital staff, patients, and visitors are exposed to bioaerosols that can lead to adverse health effects (12). The most important microorganisms that can cause airborne diseases are listed as follow: Penicillium, Aspergillus, Legionella pneumophila,Francisella tularensis, Bacillus anthracis, Yersinia pestis, Trichoderma spp., Variola virus, and Mycobacterium tuberculosis (13). The main goal of hospital managers is the provision of medical services for patients; however, they must focus on hospital disinfection. The operating rooms (ORs) and protective environment rooms (PERs) are important places that should be clean and free from pollutants. Positive air pressure was used to remove ambient air pollutants from ORs and PERs. The PERs have been established to hospitalize patients with immunological disorders such as AIDS or congenital immune deficiency syndrome. These rooms are also used for patients who suffer from diabetes, cancer, and heart failure the people who are exposed to radiation, and the patients who undergo organ transplantation, receive cytotoxic chemotherapy, and use analgesic drugs (14,15). To reduce the risk of infection, engineering control strategies should be implemented (16). A classical solution is filtration or dilution in which clean ventilation air is introduced into the room to replace any contaminated air (17). Considering the adverse effects of exposure to indoor airborne pathogens on human health, there is a huge demand for efficient indoor air disinfection technologies. Air disinfection is an imperative part of air treatment processes to remove pathogenic microorganisms from the air (18). Ultraviolet (UV) radiation is one of the demonstrated technologies. Ultraviolet germicidal irradiation (UVGI), especially at wavelengths ranging from 180 to 280 nm, has been recognized as having strong germicidal effects (19). However, studies considering the disinfection performance of conventional UVC in the air of hospital rooms have barely been reported in the literature (20,21).
The mechanism of the UV irradiation in reducing the microorganisms is as follows: after UV radiation to microorganisms, it penetrates their cell wall and affects the nucleic acids and other vital cellular substances, leading to damage and destruction of the cells (22,23). UV irradiation can cause damage through the denaturation of DNA and RNA. UV affects the inheritance chain and avoids the transcription of genetic information. Therefore, the DNA of the microorganism cells is destroyed or inactivated through the absorption of UV radiation by proteins and nuclear nucleic acids (24,25). Studies of the effects of photolysis on the removal of microorganisms have reported that UVA irradiation has no effect on the destruction of fungal spores, while it is effective in killing bacteria. Sepahvand et al conducted a study to investigate the concentration of fungal bioaerosols associated with particulate matter in the indoor and outdoor areas of Khorramabad Hospitals. The results showed that the infectious disease ward with 101.7 CFU/m3 had the highest concentration and the OR with 46.6 CFU/m3 had the lowest fungal concentration. According to the results, Cladosporium species had the highest frequency (36.75%) and Rhodotorula species had the lowest frequency (2.7%) (26). In another study, Azimi et al examined bacterial bioaerosols in ORs at Shariati Hospital in Tehran. The results showed that the mean concentration of total bacteria was 211 to 286 CFU/m3 and 208 to 443 CFU/m3 in the first and second floors. Gram-positive bacteria such as Micrococcus, Staphylococcus, and Streptococcus were also observed (27).
In this study, the effect of UVC irradiation on isolated airborne bacteria was compared after 20 and 480 minutes of irradiation for the first time during summer and autumn in 2019. Additionally, the effect of UVC irradiation on fungal bioaerosols in the air of Imam Khomeini Hospital wards in Khalkhal, Iran, was investigated.
2. Materials and Methods
2.1. Study Area
In this study, the samples were collected from Imam Khomeini Hospital in Khalkhal. There were 15 wards, including ICU, CCU, laboratory, radiology, CT scan, ORs, internal medicine, surgery, pediatrics, women, neonates, dialysis, emergency department, clinic, and offices. Khalkhal is one of the biggest cities in Ardabil province, Iran. It is located at latitude 37.62 and longitude 48.53 and situated at an elevation of 1790 m above sea level.
2.2. Sampling Procedures
This experimental study was conducted to determine the effect of UVC (254 nm) irradiation on bacterial and fungal bioaerosols in the air of ORs and PERsin the hospital for six months from June to December 2019. In this study, the Tryptic Soy Agar (TSA) culture medium (Merck Co, Germany) containing cycloheximide and Sabouraud Dextrose Agar (SDA) culture medium (Merck Co, Germany) containing chloramphenicol were used to identify and speciate bacterial and fungal bioaerosols, respectively (28-30). The cultures were prepared in the laboratory environment under sterile conditions according to the standards (31,32). They were transferred to the desired rooms under sterile conditions. Bacterial and fungal bioaerosols were collected according to the National Institute for Occupational Safety and Health (NIOSH) standard (No.0800) and using a 9 cm-diameter plate at each sampling point. The active sampling method was used in the present study. In this method, three points in four ORs and four PERs were determined for sampling. Besides, the concentration of bioaerosols in the air of one OR and one PER was determined in the absence of the irradiation for the control of bacterial and fungal bioaerosols at the same time intervals.
Before starting, the microbial sampler was calibrated using digital calibration at a flow rate of 28.3 (L/min). Biological aerosols were sampled using the single-stage Anderson Impactor and IGA30 sampling pumps, based on the manufacturer’s instructions. At each stage of sampling, 70% ethanol alcohol was used to clean and decontaminate the Anderson single-stage sampler. The sampler was located at the height of 120 cm (at the breathing zone) above the ground with a distance of more than one meter from the walls and barriers at three designated points in each room (33). Then, the Petri dish was placed in the sampling device, and sampling was performed for 10 minutes. The desired points were on the side, middle, and corner of the rooms as recommended by NIOSH. Environmental air parameters such as temperature (°C) and relative humidity were also simultaneously recorded using a portable instrument (Preservation Equipment Ltd, UK) to find the relationship between bioaerosol concentration and environmental air parameters. After sampling, the plates were wrapped with masking tape (as a control to minimize unexpected contamination and also to avoid secondary contamination), stored at 4°C (using a portable plastic cooler box), and transferred to a laboratory. The bacterial samples were incubated in an inverted position at 37°C for 24 to 48 hours, while the fungal samples were incubated at 25–28°C for 3–7 days (28,34-36).
The UVC irradiation source was located in the same room for 20 minutes. UVC was generated by six 30 W low-pressure mercury lamps (254 nm). Exposure values were reported in µW/cm2 (a distance of 100 cm from the lamp). Prior to the use of the UV lamps, they were cleaned with alcohol. After UVC irradiation, the sampling from the studied points was repeated. Additionally, these steps were repeated after 480 minutes of UVC irradiation, and the plates were transferred to the laboratory at each stage. All steps were repeated three times in each room. A total of 432 samples (216 fungi and 216 bacteria) were taken. The sample size was calculated as follows: 8 rooms (2 samples from each room including fungi and bacteria), at three time intervals (before irradiation, after 20 minutes of irradiation, and after 480 minutes of irradiation), each sample of three points of each room was taken according to NIOSH 3 standard (No.0800) with three replications.
2.3. Cleaning Operating and Protective Environment Rooms
After surgery, ORs and PERs floors were cleaned by the wet mopping tools. All of the instruments in ORs and PERs, including tables, trays, and beds were cleaned and disinfected with the same disinfectant. In addition, ORs and PERs were cleaned every Thursday according to the following steps: (1) all mattresses, rolls, logo boards, rims, and stretchers were rinsed with detergent and water and disinfected by Saya Sept-HP, (2) floors, walls, and doors were disinfected by Heygen, and (3) suction pump and flowmeter were washed with detergent and water and disinfected using Saya Sept-HI. After performing the mentioned steps, Percidin 1% was used to sterilize the surfaces.
2.4. Quantification and Characterization of Bioaerosols
The collected bacterial samples were transferred to an incubator at 37°C and analyzed after 24 to 48 hours and the colonies were then counted using a colony counter. Bergey’s manual and biochemical tests were applied for the identification of bacterial species (29,37,38).
The collected fungal samples were transferred to an incubator at 25°C and analyzed after 3 to 7 days. The slide culture method in the electronic microscope (Olympus BX60M BF/DF) with a magnification of 100 × and 400 × was utilized for the recognition of fungal species (29,37,38).
The following equation was utilized to calculate the bacterial and fungal bioaerosol concentrations in colony-forming unit per cubic meter (CFU/m3).
CFU/m3 = (1000 × T)/ (28.3 × t) (1)
Where, 1000 is the conversion factor of liter to cubic meter, T is the number of bacterial bioaerosols, 28.3 is the pump flow rate, and t is the duration of sampling (min).
2.5. Quality Control
2.5.1. Quality Control of Culture Media
According to previous studies, quality control (QC) of culture media is a very crucial parameter for the determination of the quality of media (39,40). In this study, there was no growth on the two plates at 37°C for 24 hours (TSA) and at 25°C (SDA) for three days.
2.5.2. Quality Control of Samples
QC of the samples consisted of field blanks and shipping blanks. The precision of the measurement was assessed by duplicate sampling (40). Hence, one of the main methods for QC of samples was field blanks (39,40). The possible contamination resulting from the handling of the sample media was assessed by analyzing a field blank (39-41). Blank values for bacteria and fungi were lower than 5% of the post sampling values for all samplers. In addition, the sterility of the plates was checked by returning one unexposed shipping blank of each medium (TSA and SDA). The shipping blank is prepared by taking an unused plate (without opening the Petri dish) and submitting it to the laboratory with the other samples (40). The sterility of the plates was checked and contamination was not observed on the shipping blank. The repeatability (precision) of sampling and analysis is assessed by duplicate sampling. In fact, the reported concentrations of each sampling site were the mean of duplicate samples.
2.6. Statistical Analysis
Statistical analysis of this study was performed using SPSS version 22.00. The confidence intervals in this study were 95%. The one-sample Kolmogorov-Smirnov test was utilized to examine the normality of data. The one-sample ttest was used to compare the difference between the mean concentration of bacterial bioaerosols and the value recommended by the World Health Organization (WHO) (10 colonies for the OR and 100 colonies for other wards) (42). Additionally, the one-sample t test was used to compare the mean concentration of fungal bioaerosols with the value suggested by WHO (10 colonies for the OR and 50 colonies for other wards). Moreover, ANOVA was conducted to compare bacterial and fungal bioaerosols at different times before and after radiation. Multiple regression analysis was applied to examine the relationship between environmental factors and the concentration of bacterial and fungal bioaerosols.
3. Results and Discussion
3.1. Concentration of Bioaerosols in Operating and Protective Environment Rooms
A total of 432 samples (216 bacteria and 216 fungi) were taken from the air of ORS and PERS. ORs include women’s surgery and cesarean section (WSCOR), orthopedic operating room (OOR), urological surgery room (UOR), and cosmetic surgery operating room (COR). The PERs include the internal medicine ward (IMW), women’s ward (WW), surgical ward (SW), and pediatrics ward (PW). In this study, in terms of bioaerosols in ORs and PERs, the frequency and concentration of fungal species (13 species) were higher than the observed bacterial species (9 species) before UVC irradiation (Table 1). Pictures of plates of bacteria and fungi isolates are shown in Fig. 1. The results of this investigation showed that the frequency and concentration of fungal species observed in the ORs and PERs were higher than the number and concentration of bacteria species observed after 20 and 480 minutes of UVC irradiation. Sarica et al studied the microbial quality of the ORs and observed that both the number and concentration of bacterial species (10 species) were higher than those of the observed fungal species (7 species) (43). Due to the importance of the risks associated with exposure to bioaerosols for patients and medical personnel, Abbasi et al focused on the identification of the density and diversity of bacterial and fungal bioaerosols in different wards and operating theaters; they observed that bacterial bioaerosol concentrations were generally higher than fungal bioaerosol concentrations at all sampling sites (44). It was also found that the percentage of bioaerosols in the air would increase in the absence of irradiation.
Table 1.
Percentage of Isolated Bacteria and Fungi in the ORs and PERs before UVC Irradiation
|
|
Percent
|
|
Bacteria
|
|
|
Staphylococcus epidermidis
|
65.93 |
| Group D Streptococcus |
9.73 |
| Group A Streptococcus |
8.41 |
|
Staphylococcus saprophyticus
|
4.87 |
|
Staphylococcus pneumoniae
|
4.42 |
|
Staphylococcus aureus
|
3.10 |
|
Group B Streptococcus
|
2.21 |
|
Lactobacillus
|
0.88 |
|
Listeria
|
0.44 |
|
Fungi
|
|
|
Cladosporium
|
38.60 |
|
Penicillium
|
24.12 |
|
Aspergillus niger
|
16.67 |
|
Rhodotorula
|
8.77 |
|
Aspergillus flavus
|
3.26 |
|
Curvularia
|
1.54 |
|
Alternaria
|
1.54 |
|
Drechslera
|
1.32 |
|
Rhizopus
|
1.32 |
|
Aspergillus fumigatus
|
0.88 |
|
Stofelim
|
0.88 |
|
Oculanium
|
0.66 |
|
Mucor
|
0.44 |
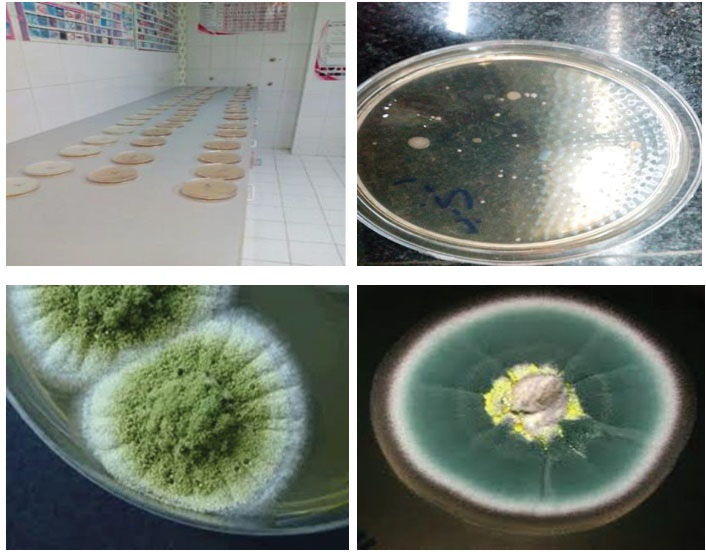
Figure 1.
Pictures of Plates of Bacterial and Fungal Isolates.
.
Pictures of Plates of Bacterial and Fungal Isolates.
3.2. Bacteria Aerosols
Table 2 presents the genus and the mean number of bacteria observed in the ORs and PERs before irradiation (a) and after 20 (b) and 480 (c) minutes of UVC irradiation. The bacterial genera found in the ORs were Staphylococcus epidermidis, group D Streptococcus, group A Streptococcus, Staphylococcus saprophyticus, Staphylococcus pneumoniae, Staphylococcus aureus, group B Streptococcus, Lactobacillus, and Listeria. In addition, before UVC irradiation, Staphylococcus epidermidis was the most frequently observed bacteria (65.93%), and Listeria (0.44%) was the least frequently observed bacteria (Table 1). On the other hand, the Staphylococcus epidermidis was the only bacterium found in all rooms. Staphylococcus aureus, Lactobacillus, and Listeria groups were found only in one of the rooms. The concentration of bacterial bioaerosols was higher in the WSCOR and OOR (Table 2). In the study conducted by Tolabi et al, it was found that intraoperative concentrations of bacterial and fungal bioaerosols in the indoor air of the OOR, IMW, and OPW were significantly higher than their preoperative concentration (45). In a study conducted by Hoseinzadeh et al, the highest and lowest averages of bioaerosol density were obtained from Shahid Beheshti and Fatemieh hospitals (36.18 CFU/m3vs. 24.03 CFU/m3), respectively. The highest and lowest concentrations of bioaerosols were found in PEW and ORs wards of the hospital, respectively (46). The results of bacterial sampling in the ORs and PERs before UVC radiation and after 20 and 480 minutes of irradiation are shown in Fig. 2. UV irradiation intensity was measured and recorded using the MIC98028 UV radiometer at the sampling points (a distance of 100 cm from the lamp). The effective irradiation density in the UVC range was 1600 µW/cm2. As can be seen, Staphylococcus epidermidis had the highest concentration of isolated bacteria before UVC irradiation and after 20 and 480 minutes of UVC irradiation.
Table 2.
Type of Bacteria Observed in the ORs and PERs Before and After 20 and 480 Minutes of UVC Irradiation (CFU/m3)
|
|
WSCOR
|
OOR
|
UOR
|
COR
|
IMW
|
WW
|
SW
|
PW
|
|
Type of Bacteria
|
a
|
b
|
c
|
a
|
b
|
c
|
a
|
b
|
c
|
a
|
b
|
c
|
a
|
b
|
c
|
a
|
b
|
c
|
a
|
b
|
c
|
a
|
b
|
c
|
|
Staphylococcus epidermidis
|
33 |
25 |
10 |
36 |
29 |
12 |
15 |
7 |
5 |
31 |
10 |
3 |
20 |
11 |
3 |
17 |
6 |
2 |
8 |
4 |
1 |
13 |
7 |
4 |
| Group D Streptococcus |
- |
- |
- |
- |
- |
- |
7 |
4 |
1 |
- |
- |
- |
4 |
- |
- |
11 |
6 |
- |
2 |
1 |
- |
- |
- |
- |
| Group A Streptococcus |
12 |
9 |
- |
2 |
1 |
- |
2 |
1 |
- |
4 |
3 |
- |
- |
- |
- |
- |
- |
- |
- |
- |
- |
3 |
1 |
- |
|
Staphylococcus saprophyticus
|
- |
- |
- |
7 |
4 |
- |
2 |
1 |
- |
- |
- |
- |
4 |
1 |
- |
- |
- |
- |
- |
- |
- |
- |
- |
- |
|
Staphylococcus pneumoniae
|
1 |
1 |
- |
3 |
1 |
- |
1 |
- |
- |
1 |
- |
- |
5 |
- |
- |
- |
- |
- |
- |
- |
- |
- |
- |
- |
|
Staphylococcus aureus
|
- |
- |
- |
- |
- |
|
- |
- |
- |
- |
- |
- |
8 |
5 |
1 |
- |
- |
- |
- |
- |
- |
- |
- |
- |
| Group B Streptococcus |
- |
|
|
- |
- |
- |
- |
- |
- |
1 |
- |
- |
4 |
- |
- |
- |
- |
- |
- |
- |
- |
- |
- |
- |
|
Lactobacillus
|
2 |
- |
- |
- |
- |
- |
- |
- |
- |
- |
- |
- |
- |
- |
- |
- |
- |
- |
- |
- |
- |
- |
- |
- |
|
Listeria
|
- |
- |
- |
- |
- |
- |
- |
- |
- |
- |
- |
- |
- |
- |
- |
- |
- |
- |
1 |
- |
- |
- |
- |
- |
| Total |
48 |
35 |
10 |
48 |
35 |
12 |
27 |
13 |
6 |
37 |
13 |
3 |
45 |
17 |
4 |
28 |
12 |
2 |
11 |
5 |
1 |
16 |
8 |
4 |
Note: (a) Before irradiation, (b) 20 min after irradiation and (c) 480 minutes after irradiation.
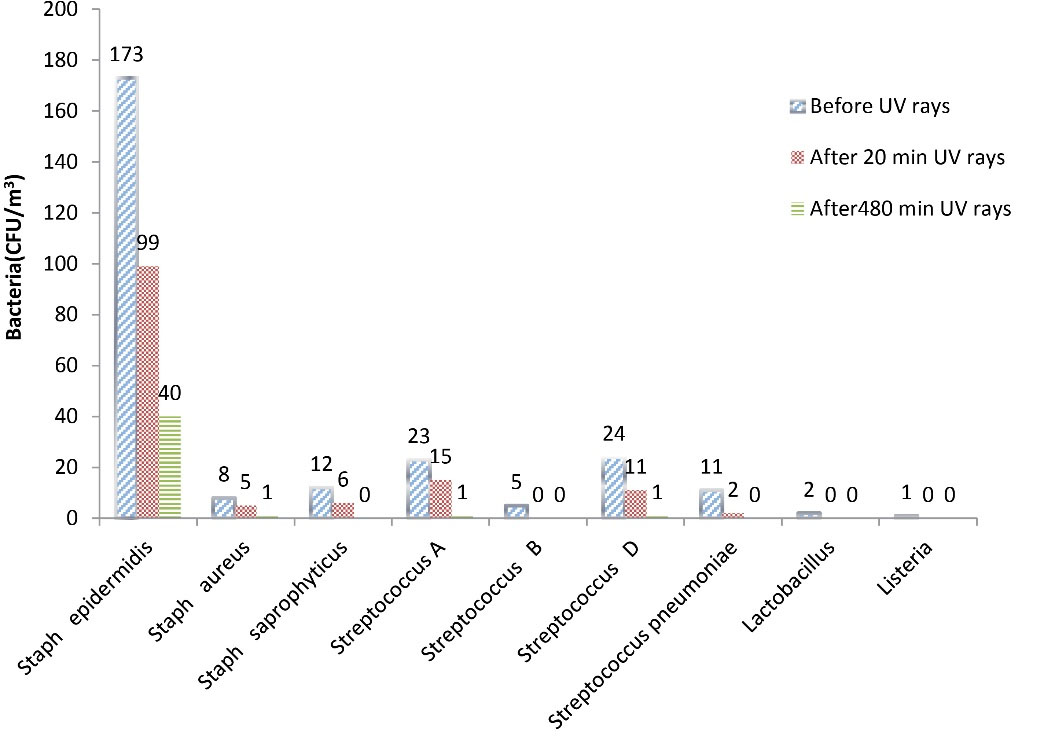
Figure 2.
Concentration of Isolated Bacteria Before UVC Irradiation and After 20 and 480 Minutes of UVC Irradiation.
.
Concentration of Isolated Bacteria Before UVC Irradiation and After 20 and 480 Minutes of UVC Irradiation.
In general, the concentration of bacterial bioaerosols decreased after UVC irradiation, and the decrease in percentages of bacteria after 20 and 480 minutes of UVC irradiation wasrepresentedin Fig. 3. As shown in Fig. 3, some bacteria, such as group B Streptococcus, Lactobacillus, and Listeria, were entirely killed after 20 minutes of irradiation; however, complete removal of the bacteria such as Staphylococcus pneumoniae and Staphylococcus saprophyticus was observed after 480 minutes of UVC irradiation. Group A Streptococcus and group D Streptococcus had 95% removal efficiency after 480 minutes of UVC of irradiation. Staphylococcus epidermidis and Staphylococcus aureus showed 76.88% and 85.50% reduction after 480 minutes of UVC irradiation, respectively. Kuhn reported that the difference in the concentration of epidermidis bacteria after exposure to UVA irradiation was significant compared to the absence of irradiation; he stated that UVA radiation could kill 80% of this bacterium because of the oxidative destruction of microorganisms by UVA irradiation. In the study conducted by Chuaybamroong et al, the effect of UVA irradiation on the removal of microorganisms was investigated. According to their results, there was a significant difference in the concentration of Bacillus subtilis usingconventional HEPA filters in the presence and absence of UVA irradiation (47). Pal et al performed a study to evaluate the inactivation of gram-negative and gram-positive bacteria using fluorescent light. Their study showed that UVA irradiation (at 4.28 mW/cm2) had a significant effect on the inactivation of Bacillus subtilis, and the rate of destruction of this bacterium was about 0.1279 per minute (48).
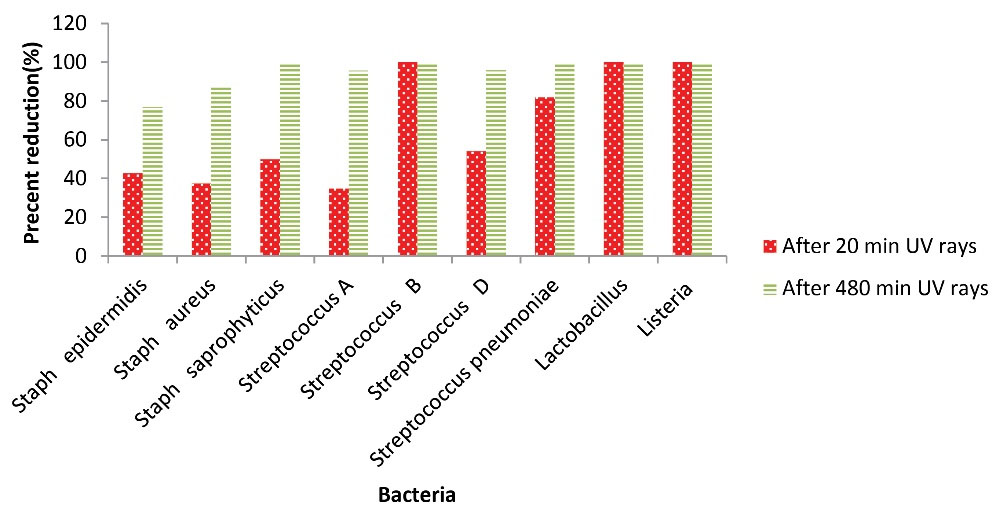
Figure 3.
The Decrease Percentage of Bacteria After 20 and 480 minutes of UVC Irradiation.
.
The Decrease Percentage of Bacteria After 20 and 480 minutes of UVC Irradiation.
3.3. Bacterial Interrelationships
In Table 3, the results of multiple regression analysis, which was used to investigate the relationship between environmental factors and bacterial bioaerosol concentration, were represented. As illustrated, there was no significant correlation between bacterial concentration and environmental factors (temperature and humidity) in ORs and PERs before and after UVC irradiation (20 and 480 minutes) (P > 0.05). These results were probably due to minor fluctuations in temperature and humidity in hospital wards. The comparison of the results of this research with other studies is indicative of the presence of agreement between our results and other similar studies (49,50). Unlike the present study, Li et al have reported that the indoor temperature had a significant correlation with bioaerosols compared to relative humidity (51); they demonstrated that at higher temperatures and relative humidity, the growth of microorganisms increases (52). Obbard et al conducted a study in hospitals of Singapore and found that there was a significant relationship between bacterial concentration, population density, and humidity (53).
Table 3.
The Results of Multiple Regression Analysis Used to Investigate the Relationship between Environmental Factors and Bacterial Bioaerosol Concentration in ORs and PERs
|
ORs
|
P
Value
|
PERs
|
P
Value
|
| Temperature before UVC irradiation |
0.823 |
Temperature before UVC irradiation |
0.682 |
| Moisture before UVC irradiation |
0.868 |
Moisture before UVC irradiation |
0.870 |
| Temperature after 20 minutes of UVC irradiation |
0.715 |
Temperature after 20 minutes of UVC irradiation |
0.904 |
| Moisture after 20 minutes of UVC irradiation |
0.599 |
Moisture after 20 minutes of UVC irradiation |
0.869 |
| Temperature after 480 minutes of UVC irradiation |
0.476 |
Temperature after 480 minutes of UVC irradiation |
0.760 |
| Moisture after 480 minutes of UVC irradiation |
0.366 |
Moisture after 480 minutes of UVC irradiation |
0.819 |
3.4. Fungal Aerosols
As observed in Tables 1 and 4, the fungi, including Cladosporium (38.60%), Penicillium (24.12%), and Aspergillus niger(16.67%), were detected in all rooms before UVC irradiation. Table 4 presents the genus and the mean number of fungi observed in the ORs and PERs before irradiation (a) and after 20 (b) and 480 (c) minutes of UVC irradiation. Faure et al sampled and analyzed the indoor air of 17 ORs and hematological units for eight years. They reported that there were various fungal species in the ORs including Penicillium species (28.4%), Cladosporium species (15.6%), and Aspergillus species (6.6%) (54). As seen in Table 4, the results of the present study are similar to their results. The fungi such as Rhizopus, Curvularia, Alternaria, Rhodotorula, and Aspergillus flavus were observed in some of the rooms. Mucor was observed only in UOR before UVC irradiation. Aspergillus fumigatus and Stofelim were observed in the IMW. Oculanium was only found in WW.
Table 4.
Type of Fungi Observed in the ORs and PERs before and after 20 and 480 minutes of UVC Radiation (CFU/m3)
|
Type of Fungi
|
WSCOR
|
OOR
|
UOR
|
COR
|
IMW
|
WW
|
SW
|
PW
|
|
a
|
b
|
c
|
a
|
b
|
c
|
a
|
b
|
c
|
a
|
b
|
c
|
a
|
b
|
c
|
a
|
b
|
c
|
a
|
b
|
c
|
a
|
b
|
c
|
|
Cladosporium
|
24 |
22 |
2 |
19 |
14 |
6 |
30 |
23 |
2 |
19 |
10 |
4 |
28 |
15 |
5 |
30 |
20 |
11 |
20 |
4 |
2 |
25 |
17 |
7 |
|
Penicillium
|
11 |
5 |
1 |
13 |
5 |
3 |
18 |
8 |
- |
32 |
16 |
12 |
7 |
1 |
- |
14 |
6 |
1 |
20 |
4 |
- |
19 |
9 |
2 |
|
Aspergillus niger
|
8 |
6 |
1 |
11 |
7 |
- |
6 |
4 |
- |
31 |
12 |
6 |
7 |
- |
- |
13 |
5 |
3 |
7 |
1 |
- |
6 |
- |
- |
|
Rhodotorula
|
8 |
5 |
- |
7 |
1 |
- |
- |
- |
- |
- |
- |
- |
4 |
1 |
- |
4 |
1 |
- |
23 |
5 |
1 |
- |
- |
- |
|
Aspergillus flavus
|
- |
- |
- |
2 |
1 |
- |
3 |
- |
- |
7 |
2 |
1 |
- |
- |
- |
1 |
1 |
- |
- |
- |
- |
6 |
- |
- |
|
Drechslera
|
- |
- |
- |
- |
- |
- |
|
- |
- |
- |
- |
- |
- |
- |
- |
- |
- |
- |
7 |
2 |
1 |
- |
- |
- |
|
Curvularia
|
- |
- |
- |
- |
- |
- |
- |
- |
- |
2 |
2 |
1 |
- |
- |
- |
5 |
- |
- |
- |
- |
- |
- |
- |
- |
|
Alternaria
|
- |
- |
- |
7 |
- |
- |
- |
- |
- |
- |
- |
- |
2 |
- |
- |
- |
- |
- |
- |
- |
- |
6 |
- |
- |
|
Rhizopus
|
- |
- |
- |
- |
- |
- |
- |
- |
- |
2 |
1 |
- |
- |
- |
- |
- |
- |
- |
5 |
1 |
- |
- |
- |
- |
|
Aspergillus fumigatus
|
- |
- |
- |
- |
- |
- |
- |
- |
- |
- |
- |
- |
5 |
2 |
- |
- |
- |
- |
- |
- |
- |
- |
- |
- |
|
Stofelim
|
- |
- |
- |
- |
- |
- |
- |
- |
- |
- |
- |
- |
5 |
- |
- |
- |
- |
- |
- |
- |
- |
- |
- |
- |
|
Oculanium
|
- |
- |
- |
- |
- |
- |
- |
- |
- |
- |
- |
- |
- |
- |
- |
5 |
2 |
1 |
- |
- |
- |
- |
- |
- |
|
Mucor
|
- |
- |
- |
- |
- |
- |
- |
- |
|
2 |
- |
- |
- |
- |
- |
- |
- |
- |
- |
- |
- |
- |
- |
- |
|
Total
|
51 |
38 |
4 |
59 |
28 |
9 |
57 |
35 |
2 |
95 |
43 |
24 |
58 |
19 |
5 |
72 |
35 |
16 |
82 |
13 |
4 |
62 |
26 |
9 |
Note: (a) Before irradiation, (b) 20 minutes after irradiation, and (c) 480 minutes after irradiation.
Fig. 4 shows the concentration of fungi in ORs and PERs before UVC radiation and after 20 and 480 minutes of irradiation. The UV radiometer at the sampling points (a distance of 100 cm from the lamp) showed that the effective irradiation density in the UVC range was equivalent to 1600 µW/cm2. This figure also shows that the highest number of fungal colonies in the air of the ORs and PERs studied belonged to Cladosporium at all three sampling times, followed by Penicillium, Aspergillus niger, Rhodotorula, Aspergillus flavus, Drechslera, Rhizopus, Oculanium, Aspergillus fumigates, Alternaria, Stofelim, Curvularia, and Mucor, respectively.
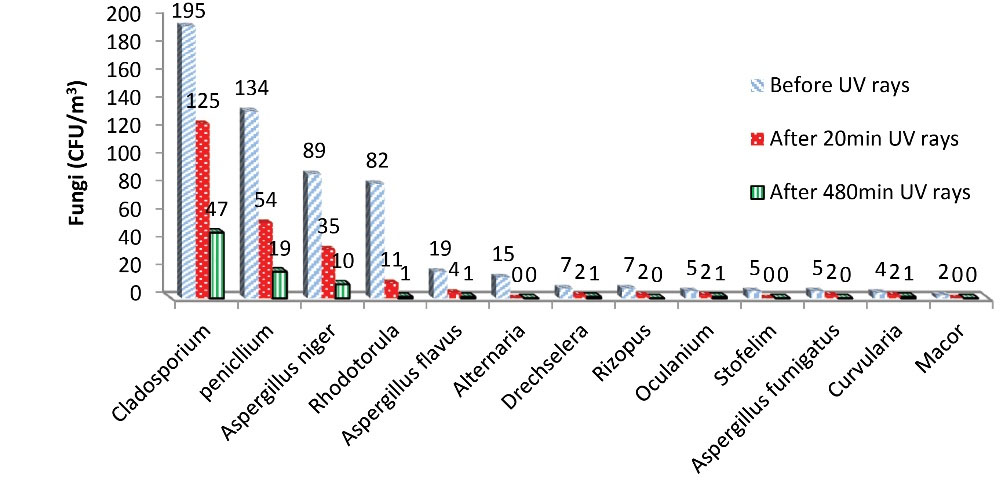
Figure 4.
Concentration of Isolated Fungi before UVC Irradiation and after 20 and 480 minutes of UVC Irradiation.
.
Concentration of Isolated Fungi before UVC Irradiation and after 20 and 480 minutes of UVC Irradiation.
Fungal bioaerosols also decreased after UVC radiation, and the percentage of the decrease in the concentration of fungi, after 20 and 480 minutes of UVC irradiation, was shown in Fig. 5. Fungi, such as Alternaria, Stofelim, and Mucor had a 100% reduction after 20 minutes of UVC irradiation, and Rhizopus and Aspergillus fumigatus showed a 100% decrease after 480 minutes of UVC irradiation. Other isolated fungi such as Cladosporium, Penicillium, Aspergillus niger, Rhodotorula, and Alternaria showed a decrease of 75%-98.78%.
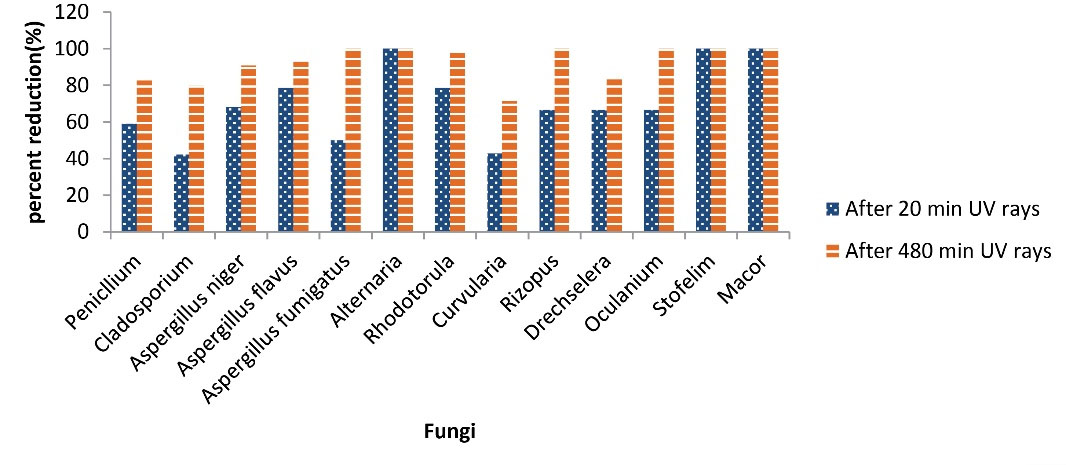
Figure 5.
The Decrease Percentage of Fungi after 20 and 480 minutes of UVC Irradiation.
.
The Decrease Percentage of Fungi after 20 and 480 minutes of UVC Irradiation.
Chuaybamroong et al (47) and Chotigawin et al (55) stated that the application of UVA alone had little effect on the eradication and destruction of Aspergillus and Penicillium. In their study, the difference in concentration of Aspergillus and Penicillium was tested after UVA irradiation at 0.85 mW/cm2 and no significant result was obtained. Nevertheless, in the present study, the UVC irradiation of 1600 µW/cm2 was used for 20 and 480 minutes, and the difference in concentration of these two fungi was significant at both time intervals. Therefore, differences in the type, intensity, and duration of irradiation may be the reason for this inconsistency. As known, the UVC beam has a shorter wavelength and higher energy compared to the UVA; therefore, it has a more destructive effect than the UVA. According to a study by Nhung et al, UVA radiation is effective in destroying vegetative cells due to its low intensity. In contrast, UVC has a significant effect on the destruction of spores due to its higher intensity (56).
3.5. Fungi Interrelationships
Multiple regression analysis was also applied to examine the relationship between environmental factors and fungal bioaerosol concentration (Table 5). The results in this table revealed that there is a weak and non-significant correlation between fungal bioaerosol concentrations and environmental factors (temperature and humidity) in ORs and PERs (P > 0.05). In different studies, different results have been obtained about the relationship between fungal bioaerosols and environmental parameters such as temperature and humidity (51). However, it seems that by increasing the irradiation time, the temperature increases and the humidity decreases, which may reduce the concentration of fungal bioaerosols. It may be due to slight changes in ambient temperature and humidity.
Table 5.
The Results of Multiple Regression Analysis Used to Investigate the Relationship between Environmental Factors and Fungi Bioaerosol Concentration in ORs and PERs
|
ORs
|
P
Value
|
PERs
|
P
Value
|
| Temperature before UVC irradiation |
0.622 |
Temperature before UVC irradiation |
0.722 |
| Moisture before UVC irradiation |
0.561 |
Moisture before UVC irradiation |
0.718 |
| Temperature after 20 minutes of UVC irradiation |
0.459 |
Temperature after 20 minutes of UVC irradiation |
0.357 |
| Moisture after 20 minutes of UVC irradiation |
0.576 |
Moisture after 20 minutes of UVC irradiation |
0.921 |
| Temperature after 480 minutes of UVC irradiation |
0.548 |
Temperature after 480 minutes of UVC irradiation |
0.574 |
| Moisture after 480 minutes of UVC irradiation |
0.541 |
Moisture after 480 minutes of UVC irradiation |
0.763 |
4. Conclusion
The active sampling method seems to be an appropriate approach for the determination of the relative concentration of bioaerosols in hospital air. The results of the present study showed that Staphylococcus epidermidis, group DStreptococcus, group A Streptococcus, Cladosporium, Penicillium, and Aspergillus niger are the most commonly observed bioaerosols in hospital wards. According to the results, it can be concluded that UVC radiation has a significant effect on bacterial and fungal bioaerosols in the ORs and PERs. The concentration of bioaerosols was decreased by increasing irradiation time. The removal efficiency of the microorganisms by UVC irradiation depends on the type, intensity, and irradiation time. To determine the effective intensity of UVC radiation, conducting studies on the concentration of microorganisms at different intensities of UVC irradiation is recommended. Increasing the efficiency of UV irradiation and reducing the concentration of microorganisms in the air may decrease the rate of hospital infections, which can be achieved through integrated management such as multi-layer rotation in the environment for more exposure to microorganisms or the use of LED UV lamps.
Acknowledgments
The present article was extracted from a part of the MSc thesis approved by Ardabil University of Medical Sciences (IR.ARUMS.REC.1397.111). The authors wish to thank the sincere cooperation of the director of the Imam Khomeini Hospital of Khalkhal and colleagues in the OR, internal medicine ward, surgical ward, pediatrics ward, women’s ward, and the laboratory.
Conflict of Interests
The authors declare that there is no conflict of interests.
References
- Vosoughi M, Karami C, Dargahi A, Jeddi F, Mazloum Jalali K, Hadisi A. Investigation of SARS-CoV-2 in hospital indoor air of COVID-19 patients’ ward with impinger method. Environ Sci Pollut Res Int 2021; 28(36):50480-8. doi: 10.1007/s11356-021-14260-3 [Crossref] [ Google Scholar]
- McDonald LC, Gerding DN, Johnson S, Bakken JS, Carroll KC, Coffin SE. Clinical practice guidelines for clostridium difficile infection in adults and children: 2017 update by the Infectious Diseases Society of America (IDSA) and Society for Healthcare Epidemiology of America (SHEA). Clin Infect Dis 2018; 66(7):e1-e48. doi: 10.1093/cid/cix1085 [Crossref] [ Google Scholar]
- Knutsen AP, Bush RK, Demain JG, Denning DW, Dixit A, Fairs A. Fungi and allergic lower respiratory tract diseases. J Allergy Clin Immunol 2012; 129(2):280-91. doi: 10.1016/j.jaci.2011.12.970 [Crossref] [ Google Scholar]
- Jaffal AA, Banat IM, El Mogheth AA, Nsanze H, Bener A, Ameen AS. Residential indoor airborne microbial populations in the United Arab Emirates. Environ Int 1997; 23(4):529-33. doi: 10.1016/s0160-4120(97)00055-x [Crossref] [ Google Scholar]
- Fabian MP, Miller SL, Reponen T, Hernandez MT. Ambient bioaerosol indices for indoor air quality assessments of flood reclamation. J Aerosol Sci 2005; 36(5-6):763-83. doi: 10.1016/j.jaerosci.2004.11.018 [Crossref] [ Google Scholar]
- Rautemaa R, Nordberg A, Wuolijoki-Saaristo K, Meurman JH. Bacterial aerosols in dental practice - a potential hospital infection problem?. J Hosp Infect 2006; 64(1):76-81. doi: 10.1016/j.jhin.2006.04.011 [Crossref] [ Google Scholar]
- Kim KY, Kim CN. Airborne microbiological characteristics in public buildings of Korea. Build Environ 2007; 42(5):2188-96. doi: 10.1016/j.buildenv.2006.04.013 [Crossref] [ Google Scholar]
- Hoseinzadeh E, Samarghandie MR, Ghiasian SA, Alikhani MY, Roshanaie G, Moghadam Shakib M. Qualitative and quantitative evaluation of bioaerosoles in the air of different wards of governmental Hamedan hospitals, during 2011-2012. Yafteh 2012; 14(4):29-39. [ Google Scholar]
- Jensen PA, Cih PE, Schafer MP. Sampling and characterization of bioaerosols. NIOSH Manual of Analytical Methods 1998; 1(15):82-112. [ Google Scholar]
- D’Amato G. Environmental urban factors (air pollution and allergens) and the rising trends in allergic respiratory diseases. Allergy 2002; 57 Suppl 72:30-3. doi: 10.1034/j.1398-9995.57.s72.5.x [Crossref] [ Google Scholar]
- Khamutian R, Najafi F, Soltanian M, Shokoohizadeh MJ, Poorhaghighat S, Dargahi A. The association between air pollution and weather conditions with increase in the number of admissions of asthmatic patients in emergency wards: a case study in Kermanshah. Med J Islam Repub Iran 2015; 29:229. [ Google Scholar]
- Srikanth P, Sudharsanam S, Steinberg R. Bio-aerosols in indoor environment: composition, health effects and analysis. Indian J Med Microbiol 2008; 26(4):302-12. doi: 10.4103/0255-0857.43555 [Crossref] [ Google Scholar]
- Haas CN, Rose JB, Gerba CP. Quantitative Microbial Risk Assessment. John Wiley & Sons; 1999.
- Lee LD, Berkheiser M, Jiang Y, Hackett B, Hachem RY, Chemaly RF. Risk of bioaerosol contamination with Aspergillus species before and after cleaning in rooms filtered with high-efficiency particulate air filters that house patients with hematologic malignancy. Infect Control Hosp Epidemiol 2007; 28(9):1066-70. doi: 10.1086/519866 [Crossref] [ Google Scholar]
- Dascalaki EG, Gaglia AG, Balaras CA, Lagoudi A. Indoor environmental quality in Hellenic hospital operating rooms. Energy Build 2009; 41(5):551-60. doi: 10.1016/j.enbuild.2008.11.023 [Crossref] [ Google Scholar]
- Bartley JM. APIC state-of-the-art report: the role of infection control during construction in health care facilities. Am J Infect Control 2000; 28(2):156-69. [ Google Scholar]
- Whitehouse JD, Friedman ND, Kirkland KB, Richardson WJ, Sexton DJ. The impact of surgical-site infections following orthopedic surgery at a community hospital and a university hospital: adverse quality of life, excess length of stay, and extra cost. Infect Control Hosp Epidemiol 2002; 23(4):183-9. doi: 10.1086/502033 [Crossref] [ Google Scholar]
- Nunayon SS, Zhang H, Lai ACK. Comparison of disinfection performance of UVC-LED and conventional upper-room UVGI systems. Indoor Air 2020; 30(1):180-91. doi: 10.1111/ina.12619 [Crossref] [ Google Scholar]
- Liu CY, Tseng CH, Wang HC, Dai CF, Shih YH. The study of an ultraviolet radiation technique for removal of the indoor air volatile organic compounds and bioaerosol. Int J Environ Res Public Health 2019; 16(14):2557. doi: 10.3390/ijerph16142557 [Crossref] [ Google Scholar]
- McDevitt JJ, Milton DK, Rudnick SN, First MW. Inactivation of poxviruses by upper-room UVC light in a simulated hospital room environment. PLoS One 2008; 3(9):e3186. doi: 10.1371/journal.pone.0003186 [Crossref] [ Google Scholar]
- Boyce JM, Donskey CJ. Understanding ultraviolet light surface decontamination in hospital rooms: a primer. Infect Control Hosp Epidemiol 2019; 40(9):1030-5. doi: 10.1017/ice.2019.161 [Crossref] [ Google Scholar]
- Teuschler LK, Rice GE, Wilkes CR, Lipscomb JC, Power FW. A feasibility study of cumulative risk assessment methods for drinking water disinfection by-product mixtures. J Toxicol Environ Health A 2004; 67(8-10):755-77. doi: 10.1080/15287390490428224 [Crossref] [ Google Scholar]
- Afsharnia M, Kianmehr M, Biglari H, Dargahi A, Karimi A. Disinfection of dairy wastewater effluent through solar photocatalysis processes. Water Sci Eng 2018; 11(3):214-9. doi: 10.1016/j.wse.2018.10.001 [Crossref] [ Google Scholar]
- Falahati SA, Noorbala MT, Malek M. The effects of UVC light and cornex for disinfection of surfaces in Yazd Shahid Sadughi burn center. Toloo-e-Behdasht 2012; 11(1):53-63. [ Google Scholar]
- Andersen BM, Bånrud H, Bøe E, Bjordal O, Drangsholt F. Comparison of UV C light and chemicals for disinfection of surfaces in hospital isolation units. Infect Control Hosp Epidemiol 2006; 27(7):729-34. doi: 10.1086/503643 [Crossref] [ Google Scholar]
- Sepahvand A, Godini H, Omidi Y, Tarrahi M, Rashidi R, Basiri H. Investigation of fungal bio aerosols and particulate matter in the teaching-medical hospitals of Khorramabad city, Iran during 2015. Iran J Health Environ 2016; 9(1):115-26. [ Google Scholar]
- Azimi F, Nabizadeh R, Alimohammadi M, Naddafi K. Bacterial bioaerosols in the operating rooms: a case study in Tehran Shariati hospital. J Air Pollut Health 2016; 1(3):215-8. [ Google Scholar]
- Dehghani M, Sorooshian A, Nazmara S, Norouzian Baghani A, Delikhoon M. Concentration and type of bioaerosols before and after conventional disinfection and sterilization procedures inside hospital operating rooms. Ecotoxicol Environ Saf 2018; 164:277-82. doi: 10.1016/j.ecoenv.2018.08.034 [Crossref] [ Google Scholar]
- Faridi S, Hassanvand MS, Naddafi K, Yunesian M, Nabizadeh R, Sowlat MH. Indoor/outdoor relationships of bioaerosol concentrations in a retirement home and a school dormitory. Environ Sci Pollut Res Int 2015; 22(11):8190-200. doi: 10.1007/s11356-014-3944-y [Crossref] [ Google Scholar]
- Niazi S, Hassanvand MS, Mahvi AH, Nabizadeh R, Alimohammadi M, Nabavi S. Assessment of bioaerosol contamination (bacteria and fungi) in the largest urban wastewater treatment plant in the Middle East. Environ Sci Pollut Res Int 2015; 22(20):16014-21. doi: 10.1007/s11356-015-4793-z [Crossref] [ Google Scholar]
- Kim KY, Kim HT, Kim D, Nakajima J, Higuchi T. Distribution characteristics of airborne bacteria and fungi in the feedstuff-manufacturing factories. J Hazard Mater 2009; 169(1-3):1054-60. doi: 10.1016/j.jhazmat.2009.04.059 [Crossref] [ Google Scholar]
- Fang Z, Ouyang Z, Zheng H, Wang X, Hu L. Culturable airborne bacteria in outdoor environments in Beijing,China. Microb Ecol 2007; 54(3):487-96. doi: 10.1007/s00248-007-9216-3 [Crossref] [ Google Scholar]
- Salmela A, Kokkonen E, Kulmala I, Veijalainen AM, van Houdt R, Leys N. Production and characterization of bioaerosols for model validation in spacecraft environment. J Environ Sci (China) 2018; 69:227-38. doi: 10.1016/j.jes.2017.10.016 [Crossref] [ Google Scholar]
- Bolookat F, Hassanvand MS, Faridi S, Hadei M, Rahmatinia M, Alimohammadi M. Assessment of bioaerosol particle characteristics at different hospital wards and operating theaters: a case study in Tehran. MethodsX 2018; 5:1588-96. doi: 10.1016/j.mex.2018.11.021 [Crossref] [ Google Scholar]
- Heydari M, Ehsani F, Naghmachi M, Salari M, Noorisepehr M, Moradnia M, Darvishmotevalli M, Bazmeh A. Bacterial Contamination of Mobile Phones Carried by Medical Staff in Maternity, Neonatal, and ICU Wards of Shahid Beheshti and Imam Sajjad Hospitals in Yasuj. Avicenna Journal of Environmental Health Engineering 2020; 7(2):92-6. [ Google Scholar]
- Gao M, Jia R, Qiu T, Han M, Song Y, Wang X. Seasonal size distribution of airborne culturable bacteria and fungi and preliminary estimation of their deposition in human lungs during non-haze and haze days. Atmos Enviro 2015; 118:203-10. doi: 10.1016/j.atmosenv.2015.08.004 [Crossref] [ Google Scholar]
- Naddafi K, Nabizadeh R, Norouzian Baghani A, Fazlzadeh M. Bioaerosols in the waterpipe cafés: genera, levels, and factors influencing their concentrations. Environ Sci Pollut Res Int 2019; 26(20):20297-307. doi: 10.1007/s11356-019-05413-6 [Crossref] [ Google Scholar]
- Thomas PA, Kaliamurthy J, Jesudasan CA, Geraldine P. Use of chlorazol black E mounts of corneal scrapes for diagnosis of filamentous fungal keratitis. Am J Ophthalmol 2008; 145(6):971-6. doi: 10.1016/j.ajo.2008.01.020 [Crossref] [ Google Scholar]
- Basu S, Pal A, Desai PK. Quality control of culture media in a microbiology laboratory. Indian J Med Microbiol 2005; 23(3):159-63. doi: 10.4103/0255-0857.16586 [Crossref] [ Google Scholar]
- Therkorn J, Thomas N, Scheinbeim J, Mainelis G. Field performance of a novel passive bioaerosol sampler using polarized ferroelectric polymer films. Aerosol Sci Technol 2017; 51(7):787-800. doi: 10.1080/02786826.2017.1316830 [Crossref] [ Google Scholar]
- de Rooij MMT, Hoek G, Schmitt H, Janse I, Swart A, Maassen CBM. Insights into livestock-related microbial concentrations in air at residential level in a livestock dense area. Environ Sci Technol 2019; 53(13):7746-58. doi: 10.1021/acs.est.8b07029 [Crossref] [ Google Scholar]
- World Health Organization (WHO). WHO Policy on TB Infection Control in Health-Care Facilities, Congregate Settings and Households. Geneva: WHO; 2009. Available from: http://whqlibdoc.who.int/publications/2009/9789241598323_eng.pdf. Accessed January 17, 2009.
- Sarıca S, Asan A, Otkun MT, Ture M. Monitoring indoor airborne fungi and bacteria in the different areas of Trakya University Hospital, Edirne, Turkey. Indoor Built Environ 2002; 11(5):285-92. doi: 10.1159/000066523 [Crossref] [ Google Scholar]
- Abbasi F, Samaei MR, Khodadadi H, Karimi A, Maleknia H. Effects of materials recovery facility construction on the release of fungal bioaerosols: a case study in southern of Iran. Fresenius Environ Bull 2016; 25(5):1512-8. [ Google Scholar]
- Tolabi Z, Alimohammadi M, Hassanvand MS, Nabizadeh R, Soleimani H, Zarei A. The investigation of type and concentration of bio-aerosols in the air of surgical rooms: a case study in Shariati hospital, Karaj. MethodsX 2019; 6:641-50. doi: 10.1016/j.mex.2019.03.016 [Crossref] [ Google Scholar]
- Hoseinzadeh E, Samarghandie MR, Ghiasian SA, Alikhani MY, Roshanaie G. Evaluation of bioaerosols in five educational hospitals wards air in Hamedan, during 2011-2012. Jundishapur J Microbiol 2013; 6(6):e10704. doi: 10.5812/jjm.10704 [Crossref] [ Google Scholar]
- Chuaybamroong P, Chotigawin R, Supothina S, Sribenjalux P, Larpkiattaworn S, Wu CY. Efficacy of photocatalytic HEPA filter on microorganism removal. Indoor Air 2010; 20(3):246-54. doi: 10.1111/j.1600-0668.2010.00651.x [Crossref] [ Google Scholar]
- Pal A, Pehkonen SO, Yu LE, Ray MB. Photocatalytic inactivation of Gram-positive and Gram-negative bacteria using fluorescent light. J Photochem Photobiol A Chem 2007; 186(2-3):335-41. doi: 10.1016/j.jphotochem.2006.09.002 [Crossref] [ Google Scholar]
- Frankel M, Bekö G, Timm M, Gustavsen S, Hansen EW, Madsen AM. Seasonal variations of indoor microbial exposures and their relation to temperature, relative humidity, and air exchange rate. Appl Environ Microbiol 2012; 78(23):8289-97. doi: 10.1128/aem.02069-12 [Crossref] [ Google Scholar]
- Green CF, Scarpino PV, Gibbs SG. Assessment and modeling of indoor fungal and bacterial bioaerosol concentrations. Aerobiologia 2003; 19(3):159-69. doi: 10.1023/B:AERO.0000006531.35387.bd [Crossref] [ Google Scholar]
- Li Y, Wang W, Guo X, Wang T, Fu H, Zhao Y. Assessment of airborne bacteria and fungi in various university indoor environments: a case study in Chang’an University, China. Environ Eng Sci 2015; 32(4):273-83. doi: 10.1089/ees.2014.0050 [Crossref] [ Google Scholar]
- Li A, Liu Z, Zhu X, Liu Y, Wang Q. The effect of air-conditioning parameters and deposition dust on microbial growth in supply air ducts. Energy Build 2010; 42(4):449-54. doi: 10.1016/j.enbuild.2009.10.013 [Crossref] [ Google Scholar]
- Obbard JP, Fang LS. Airborne concentrations of bacteria in a hospital environment in Singapore. Water, Air, and Soil Pollution 2003; 144(1):333-41. doi: 10.1023/a:1022973402453 [Crossref] [ Google Scholar]
- Faure O, Fricker-Hidalgo H, Lebeau B, Mallaret MR, Ambroise-Thomas P, Grillot R. Eight-year surveillance of environmental fungal contamination in hospital operating rooms and haematological units. J Hosp Infect 2002; 50(2):155-60. doi: 10.1053/jhin.2001.1148 [Crossref] [ Google Scholar]
- Chotigawin R, Sribenjalux P, Supothina S, Johns J, Charerntanyarak L, Chuaybamroong P. Airborne microorganism disinfection by photocatalytic HEPA filter. EnvironmentAsia 2010; 3(2):1-7. doi: 10.14456/ea.2010.16 [Crossref] [ Google Scholar]
- Nhung LTT, Nagata H, Takahashi A, Aihara M, Okamoto T, Shimohata T. Sterilization effect of UV light on Bacillus spores using TiO2 films depends on wavelength. J Med Invest 2012; 59(1-2):53-8. doi: 10.2152/jmi.59.53 [Crossref] [ Google Scholar]