Avicenna J Environ Health Eng. 9(1):25-34.
doi: 10.34172/ajehe.2022.04
Original Article
Effects of the Municipal Solid Waste Landfill on the Quality of Water Resources in Khalkhal: A Case Study
Zahra Javanmardi 1  , Morteza Alighadri 2, * , Saeed Parastar 3, Tayebe Sadeghi 2
Author information:
1Student of Environmental Health Engineering, School of Health, Ardabil University of Medical Sciences, Ardabil, Iran
2Department of Environmental Health Engineering, School of Health, Ardabil University of Medical Sciences, Ardabil, Iran
3Department of Environmental Health Engineering, Khalkhal University of Medical Sciences, Khalkhal, Iran
Abstract
Transmission of leachate from municipal solid waste landfills can potentially threaten ecosystems and human societies when the landfill has no system for collecting and treating leachate. Leachate produced from landfills finds its way through the soil to groundwater and surrounding surface waters, leading to pollution of water resources. This study aimed to investigate the effects of leachate from Khalkhal landfill (a city in Ardabil province, northwestern Iran) on the quality of groundwater and surrounding surface water. During 2019-2020, 4 wells (one control well located upstream of the landfill and three wells located downstream of the landfill) and two stations of the surface water resource of the Herochai river were spots for sampling. First, we did sampling during high and low rainfall seasons in accordance with the standards. Second, we analyzed the values of some physical, chemical, and biological quality parameters according to standard methods. The sampling of the soil texture was conducted following ASTM D 422 standards. Then, the soil was analyzed at Reference Laboratory of Water, Soil, and Plant in Ardabil province. The value of most parameters measured in the water of downstream wells was lower than the limit recommended by the Iranian and World Health Organization, indicating no limitation for drinking and agricultural uses. The quality of the Herochai river water was also relatively undesirable in terms of turbidity and total coliform in some samples. Additionally, consistent with the study results, no difference was observed between high and low rainfall seasons. According to the results obtained from different parameters, Schuler and Wilcox diagrams, and landfill water pollution index (LWPI), the quality of upstream and downstream water resources of Khalkhal municipal solid waste landfill was not much different. In other words, the landfill did not affect water.
Keywords: Water resources, Landfill, Water pollution index, Iran, Khalkhal
Copyright and License Information
© 2022 The Author(s); Published by Hamadan University of Medical Sciences.
This is an open-access article distributed under the terms of the Creative Commons Attribution License (
http://creativecommons.org/licenses/by/4.0), which permits unrestricted use, distribution, and reproduction in any medium provided the original work is properly cited.
Please cite this article as follows: Javanmardi Z, Alighadri M, Parastar S, Sadeghi T. Effects of the municipal solid waste landfill on the quality of water resources in khalkhal: A case study. Avicenna J Environ Health Eng. 2022; 9(1):25-34. doi:10.34172/ajehe.2022.04
1. Introduction
Groundwater plays an important role in the survival of living things, and it is regarded as a source of excellent quality water. In many countries of the world, it is used as the major source for drinking, irrigation, and industrial needs, due to its instant availability and natural protection from physical, chemical, and microbial contamination (1).
Polluted groundwaters affect drinking water wells, waters used in agriculture, and even surface water, and sometimes the contamination may extend up to one kilometer. Groundwater under the influence of leachate has a high concentration of pollutants in comparison with municipal wastewater (2). Municipal solid waste landfills act as reactors, and physical, chemical, and biological processes affect the wastes, which may result in the production of gas and leachate. The resulting leachate contains various pollutants that cause environmental and human health concerns. The contaminants such as heavy metals (3,4), pharmaceuticals (2), and organic pollutants (5) can enter the water through leachate. They enter groundwater and the human food chain and cause adverse effects on human health (6). In recent years, emerging pollutants in leachate from municipal solid waste have been found and raised concerns about the pollution of surface and groundwater resources (2).
Due to the importance of maintaining the quality of water resources, many studies have been conducted to better monitor water quality by various methods. Several indicators have been used in these methods. Some of these indicators include WHO Standards for Drinking Water, Horton’s Water Quality Index (WQI) to evaluate the effect of various parameters on water quality, and Organ Water Quality Index. Recently, several indicators have been proposed to evaluate water quality that have been effective in water resources management (7).
The landfill water pollution index (LWPI) was proposed by Talalaj in 2014. It takes into account 10 mandatory parameters according to European Union (EU) regulations. Most of these parameters include variables used to calculate the leachate pollution index (LPI) (7,8).
LPI determines the leachate contamination potential of landfills (closed yet as active) on a comparative scale using an index named LPI. Once the characteristics of leachate from a particular landfill site are determined, the LPI is calculated using the weighted linear additive model. The application of LPI includes the ranking of landfill sites, resource allocation for landfill remediation, analysis, enforcement of standards, research, and public information (9).
In a study, Knopek and Dabrowska evaluated groundwater quality using the LWPI and Cd pollution index and the degree of environmental risk caused by the municipal solid waste landfill in water and soil. The study conducted in Southern Poland showed five physicochemical parameters of water used during 2014-2019. This study is an example of using LWPI and Cd for evaluating groundwater quality (10). In another study, Talalaj IA surveyed groundwater quality using modified LWPI. A total of 128 samples were analyzed in terms of polycyclic aromatic hydrocarbons (PAH), pH, electrical conductivity (EC), total organic carbon (TOC), and heavy metals (Hg, Cd, Cu, Zn, Cr, and Pb). To quantify the quality of groundwater affected by the landfill, LWPI was calculated. The results showed that the landfill could not significantly affect wells near the landfill; therefore, LWPI in the wells changed from 0.52 to 98.25 with an average of 7.99. LWPI values in upstream wells ranged from 0.52 to 0.92. LWPI values of less than one indicate that landfills affect groundwater. According to the study results, LWPI is an efficient method for analyzing the quality of groundwater around landfills and evaluating its effects. A study in Iran was conducted by Baghanam et al using LWPI to examine the effects of landfills on groundwater quality. In this study, scientists measured heavy metals and 23 physicochemical parameters. They studied 3 surface water resources and 6 groundwater resources from September 2016 to August 2017 in high and low rainfall seasons. LWPI was analyzed. The results indicated low water quality in both surface water and groundwater due to landfill leachate penetration (11).
Many researchers have investigated the chemical processes governing landfills and identified the environmental risks of leachate leakage into groundwater. Alizadeh et al in their study about groundwater quality around Tonekabon landfill, a coastal city in northern Iran, investigated four stations to determine the parameters of organic matter such as biochemical oxygen demand (BOD) and chemical oxygen demand (COD) and parameters related to water quality (total suspended solids [TSS] and total dissolved solids [TDS], pH, and EC). According to the results, the authorities should consider the transfer of the landfill to another place to prevent groundwater pollution because it is located in the forest and agricultural areas (12). Przydatek and Kanownik analyzed changes in the physicochemical elements in groundwater in the vicinity of a small municipal solid waste landfill site located within the territory of the EU. They analyzed general physicochemical parameters (EC, pH, and TOC), inorganic elements (Cr, Zn, Cd, Cu, Pb, and Hg) and one organic element (PAH). The results show that the increased values of Cd, EC, and TOC turned out to be the determinants of the negative impact of leachate on the groundwater quality below the landfill. The integrated water threat model determined the potential negative effect of a landfill site (13).
In this study, we attempted to evaluate and analyze the results of the analysis of some parameters in groundwater and surface water upstream and downstream of Khalkhal landfill using a combination of some standards, indices, and LWPI.
2. Materials and Methods
2.1. Study Area
We conducted this study in Khalkhal, Ardabil Province, northwestern Iran (Fig. 1). Khalkhal has been located at longitude 48 degrees and 32 minutes and 37 minutes and 37 degrees latitude of the Greenwich meridian. Its height is 1843 m above sea level with a mean annual temperature of 7°C and a mean annual rainfall of 289 mm. Khalkhal landfill is located 5 km from the city and along Herochai river. The height of this area from the groundwater level is 60 m in the city and along the Herochai river. The distances of sampling points in the upstream well (4600 m), three downstream wells (500, 1600, and 685 m), and upstream and downstream points of the Herochai river (950 and 750 m, respectively) from the landfill were different. The selected points for sampling were the nearest (except for stations upstream of the river and upstream well) available points to the landfill.
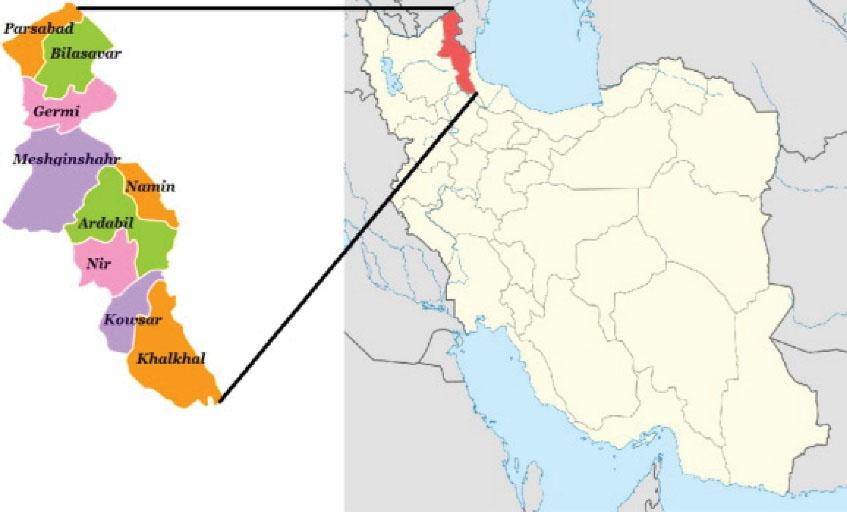
Figure 1.
Location of Khalkhal in Iran.
.
Location of Khalkhal in Iran.
Waste production per capita has been estimated to be 0.6 kg per person per day, 23 tons per day regarding the city’s population. The leachate volume has not been computed yet. In the management of the Khalkhal landfill, solid wastes were discharged to the landfill after collection. It seems landfilling method is the ramp used in combination with the trench method. Indeed, the operation in the burial is defective, so it seems to be like dumping. Moreover, leachate management does not occur; in other words, leachate is not observed outside, although it has been in operation for thirty years.
2.2. Sampling and Testing
We conducted the sampling in February (high rainfall season) and June (low rainfall season) in 2021. Four wells around the municipal solid waste landfill (one well located upstream and three wells downstream) and two surface water points upstream and downstream of Herochai river were designated as sampling stations (Fig. 2). Composite sampling procedure was used to take the water samples. The sampling was done twice in 2020 (low and high rainfall seasons). Sampling depths were 26 m in the upstream well and 14, 30, and 50 m in downstream wells. The sampling of wells was done from tapes because the wells were closed. They are located at the beginning of the pumping point for each well. The river sampling was carried out at a depth of 20 to 30 cm. Temperature, turbidity, EC, and pH were measured by portable devices on-site, and the results were recorded. The samples were transferred to the laboratory at 4°C. Parameters included COD, BOD5, nitrite, nitrate, sulfate, alkalinity, hardness, calcium, magnesium, sodium, iron, manganese, chromium, lead, zinc, copper, and nickel.
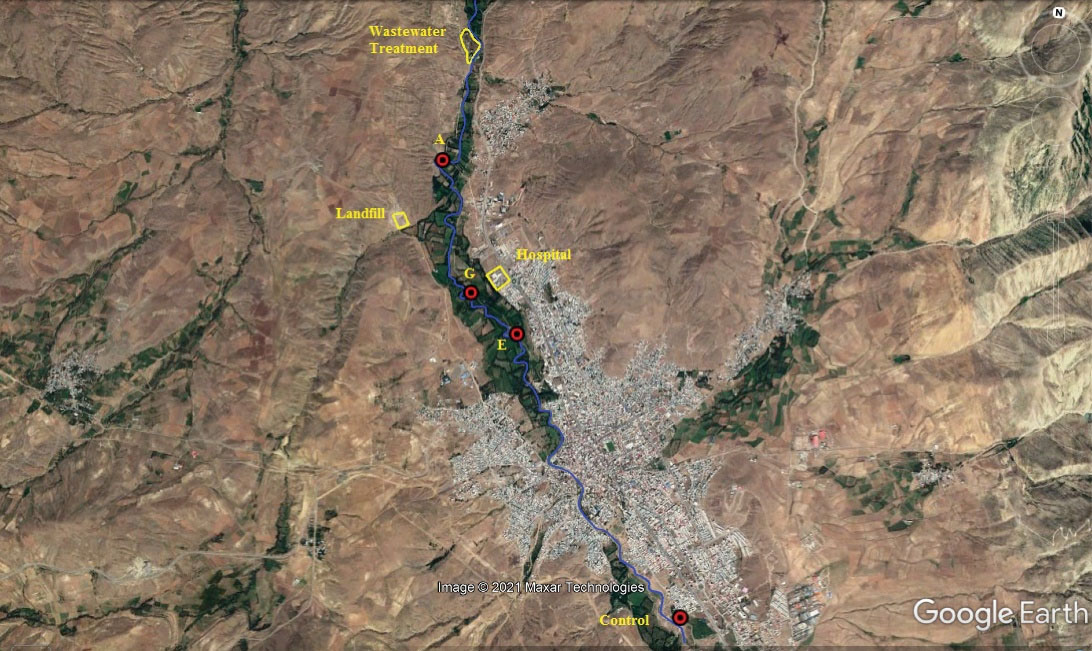
Figure 2.
Geographical Location of Khalkhal Municipal Solid Waste Landfill and Sampling Wells.
.
Geographical Location of Khalkhal Municipal Solid Waste Landfill and Sampling Wells.
Copper, nickel, and microbial quality of the samples were measured based on standard methods (14). Chromium, lead, zinc, copper, and nickel as well as iron and manganese were measured by atomic absorption Spectrometry method using Varian AA240 model (Varian Inc, Australia). Sodium was determined by ICP-MS (inductively coupled plasma-mass spectrometry) using Perkin-Elmer SCIEX - ELAN 6000 model (PerkinElmer Inc, United States). The nitrite, nitrate, and sulfate values were measured with a spectrophotometery method using DR 5000 UV-Vis model (HACH, United States). The pH of samples was measured in the sampling point using a portable pH meter using SAT 401 Canaway model (Sablan Azmaye Tehran company, Iran). EC and tempreature were determined by a conductivity meter using TESTO 240 model (TESTO Company, Germany). Turbidity meter of TL23 Series Laboratory model (HACH Company, United States) was applied to obtain the turbidity in solution. The titration method (with the Titrette® Bottletop Burette model, Merck, Germany) and the related calculations determined other parameters such as alkalinity, hardness, calcium, and magnesium.
The BOD was estimated by HQ440D Laboratory Biochemical Oxygen Demand (BOD) meter package with optical LBOD101 sensor (HACH Company, United States). A COD meter, Spectro Direct Aqualytic AL800 model (Aqualytic Company, Germany) was used to measure COD.
Also, we accomplished the sampling of chosen points to specify the soil texture of the study area following 422 ASTMD standards (15). Then, the soil was analyzed at the site of the reference laboratory of water, soil, and plant in Ardabil Province.
2.3. The Landfill Water Pollution Index
In this study, LWPI was used to investigate the effects of the landfill on groundwater quality. This index is calculated by the following equation (7):
(1)
Where LWPL is the groundwater quality index affected by the landfill, Wi is the weight of each pollutant, and n is the number of them. Then, si is calculated by the following equation (7):
Where Cp is the concentration of each parameter in the groundwater or surface water outflow sample (affected or polluted), and Cb is the concentration of each parameter in the inflow groundwater or surface water sample. For pH, Cp/Cb ratio is used if the pH of the upstream is higher than the pH of the downstream. If pH of the upstream is lower than the pH of the downstream, the inverse of this equation is used (8). The selection of these parameters and weights to calculate the LWPI was made based on the data obtained in the different studies. Table 1 presents the weight of the parameters used in this study (7-11). Table 2 shows the groundwater quality class based on LWPL (8).
Table 1.
The Parameters and WeightsUsed in LWPI (
7-
11)
|
Parameter
|
Wi
|
| COD |
3 |
| BOD |
3 |
| TDS |
1 |
| EC |
1 |
| pH |
2 |
| NO3 |
5 |
| NO2 |
5 |
| SO4 |
4 |
| Fe |
3 |
| Na |
2 |
| Cu |
3 |
| Zn |
3 |
| Cr |
3 |
| Pb |
3 |
| Ni |
3 |
Table 2.
Groundwater Classification Based on LWPL (
8)
|
Interpretation
|
LWPI Values
|
| Groundwater is not affected by landfills |
LWPI < 1 |
| Moderate groundwater pollution from landfills |
1 < LWPI ≤ 2 |
| Significant impact of landfills and poor groundwater quality |
2 < LWPI ≤ 5 |
| Groundwater heavily contaminated by landfills |
LWPI > 5 |
3. Results and Discussion
In this section, we discuss and interpret the results of soil texture analysis as well as qualitative analysis of groundwater samples around the landfill and surface water samples of the Herochai river. Then, the results were compared with relevant standards for drinking. Besides, the data were analyzed for agricultural purposes using Schoeller and Wilcox diagrams.
3.1. Soil Analysis
The soil of the study area is loamy-sandy in the upstream of Khalkhal municipal solid waste landfill and loamy and loamy-sandy in the downstream of the landfill. The loamy soils have medium particles, good drainage, permeability, and porosity. Sandy soils have low water holding capacity. The soil in the area has moderate to good permeability in terms of granulation. This feature can enhance the probability of transmission of pollution in this area. Generally, the lithological nature of the soils, temperament of waste discharge, depth of mines, and water table are involved in the rate of leachate production.
3.2. Qualitative Analysis of Water Samples Around Khalkhal Municipal Solid Waste Landfill
According to the direction of groundwater flow, to investigate the possible penetration of leachate from Khalkhal wastewater into groundwater and surface water from wells around the landfill and the Herochai river, its physical, chemical, and biological parameters were compared with standards. Tables 3 to 8 present the results of the measured parameters of water samples from wells around Khalkhal municipal solid waste landfill (in two high and low rainfall seasons).
Table 3.
Results of Qualitative Analysis of Water Samples from Wells around Khalkhal Municipal Solid Waste Landfill (Rainy Season)
|
Parameter
|
Downstream Wells
|
Control Well
|
FAO (16)
|
WHO (17)
|
Iranian Standard
for Irrigation (18)
|
Iranian Standard
for Drinking (19)
|
|
Qasim
|
Ellar
|
ABFA
|
| pH |
7.17 |
7.29 |
7.15 |
7.17 |
6.5-8 |
6.5-8.5 |
6.5-8.4 |
6.5-9 |
| EC |
855 |
604 |
924 |
802 |
3000 |
- |
3000 |
- |
| TDS |
603 |
424 |
652 |
566 |
2000 |
1500 |
- |
1500 |
| BOD5 |
> 3 |
> 3 |
> 3 |
> 3 |
10 |
5 |
- |
- |
| COD |
> 1 |
> 1 |
> 1 |
> 1 |
- |
10 |
- |
- |
| Nitrite |
> 0.03 |
> 0.03 |
> 0.03 |
> 0.03 |
- |
3 |
- |
3 |
| Nitrate |
38 |
3 |
3 |
19 |
30 |
50 |
30 |
50 |
| SO4 |
88.3 |
40.9 |
97.2 |
71.1 |
- |
400 |
- |
400 |
| Alkalinity |
310.5 |
283 |
368 |
348 |
- |
- |
- |
- |
| TH |
333.3 |
264.8 |
328.2 |
338.6 |
- |
500 |
- |
500 |
| Ca |
68.4 |
56.8 |
70.3 |
71.7 |
- |
300 |
- |
300 |
| Mg |
39.4 |
29.8 |
37 |
38.5 |
- |
30 |
- |
30 |
| Fe |
0.134 |
0.133 |
0.162 |
0.135 |
- |
1 |
5 |
1 |
| Mn |
- |
- |
- |
- |
- |
0.5 |
0.2 |
0.5 |
| Na |
35.8 |
16.1 |
50.7 |
27.1 |
- |
200 |
- |
200 |
| Cr |
- |
- |
- |
- |
- |
0.05 |
0.1 |
0.05 |
| Pb |
- |
- |
- |
- |
- |
0.01 |
- |
0.01 |
| Zn |
0.001 |
0.005 |
0.002 |
0.003 |
- |
4 |
2 |
3 |
| Cu |
- |
- |
- |
- |
- |
2 |
0.2 |
1 |
| Ni |
- |
- |
- |
- |
- |
0.07 |
0.2 |
0.07 |
| Coliform |
0 |
7 |
0 |
0 |
- |
0 |
- |
0 |
| Fecal coliform |
0 |
0 |
0 |
0 |
- |
0 |
- |
0 |
The sign (-) in the wells means that the desired parameter is not observed in the water sample.
Temperature in degrees Celsius. pH is unitless. EC in terms of µs/cm. Hardness and alkalinity in terms of mg/L CaCO3. Other parameters are in mg/L. Coliforms and fecal coliforms in MPN/100 mL
Table 4.
Results of Qualitative Analysis of Water Samples from Wells around Khalkhal Municipal Solid Waste Landfill (Low Rainfall Season)
|
Parameter
|
Downstream Wells
|
Control Well
|
FAO (16)
|
WHO (17)
|
Iranian Standard
for Irrigation (18)
|
Iranian Standard
for Drinking (19)
|
|
Qasim
|
Ellar
|
ABFA
|
| pH |
7 |
6.8 |
7.1 |
6.8 |
6.5-8 |
6.5-8.5 |
6.5-8.4 |
6.5-9 |
| EC |
780 |
559 |
891 |
800 |
3000 |
- |
3000 |
- |
| TDS |
528 |
476 |
623 |
599 |
2000 |
1500 |
- |
1500 |
| BOD5 |
> 3 |
> 3 |
> 3 |
> 3 |
10 |
5 |
- |
- |
| COD |
> 1 |
> 1 |
> 1 |
> 1 |
- |
10 |
- |
- |
| Nitrite |
> 0.03 |
> 0.03 |
> 0.03 |
> 0.03 |
- |
3 |
- |
3 |
| Nitrate |
35 |
2.65 |
3.6 |
17 |
30 |
50 |
30 |
50 |
| SO4 |
78 |
36.72 |
90 |
68 |
- |
400 |
- |
400 |
| Alkalinity |
300 |
264.8 |
328.2 |
338.6 |
- |
- |
- |
- |
| TH |
325 |
233.3 |
301 |
330.5 |
- |
500 |
- |
500 |
| Ca |
50 |
40 |
68 |
65 |
- |
300 |
- |
300 |
| Mg |
40 |
40 |
37.1 |
35 |
- |
30 |
- |
30 |
| Fe |
0.176 |
0.182 |
0.126 |
0.153 |
- |
1 |
5 |
1 |
| Mn |
- |
- |
- |
- |
- |
0.5 |
0.2 |
0.5 |
| Na |
40 |
20 |
50 |
25 |
- |
200 |
- |
200 |
| Cr |
- |
- |
- |
- |
- |
0.05 |
0.1 |
0.05 |
| Pb |
- |
- |
- |
- |
- |
0.01 |
- |
0.01 |
| Zn |
0.015 |
0.005 |
0.011 |
0.005 |
- |
4 |
2 |
3 |
| Cu |
0.008 |
- |
0.003 |
- |
- |
2 |
0.2 |
1 |
| Ni |
- |
- |
- |
- |
- |
0.07 |
0.2 |
0.07 |
| Total coliform |
0 |
0 |
0 |
0 |
- |
0 |
- |
0 |
| Fecal coliform |
0 |
0 |
0 |
0 |
- |
0 |
- |
0 |
The sign (-) in the wells means that the desired parameter is not observed in the water sample.
Temperature in degrees Celsius. pH is unitless. EC in terms of µs/cm. Hardness and alkalinity in terms of mg/L CaCO3. Other parameters are in mg /L. Coliforms and fecal coliforms in MPN/100 mL.
Table 5.
Results of Qualitative Analysis of Water Samples of the Herochai River in Both High and Low Rainfall Seasons
|
Parameter
|
Downstream of the Herochai River in Low Rainfall Season
|
Upstream of the Herochai River in Low Rainfall Season
|
Downstream of the Herochai River in the Rainy Season
|
Upstream of the Herochai river in the Rainy Season
|
| pH |
7.4 |
6.8 |
7.34 |
7.28 |
| EC |
580 |
560 |
565 |
558 |
| TDS |
487 |
390 |
400 |
394 |
| BOD5 |
3 > |
5 |
3 > |
3 > |
| COD |
3 |
17 |
4 |
4 |
| Nitrite |
< 0.03 |
> 0.03 |
> 0.03 |
> 0.03 |
| Nitrate |
4.5 |
4.5 |
5 |
4 |
| SO4 |
37 |
39.5 |
39.7 |
38.4 |
| Alkalinity |
250 |
265 |
253 |
241 |
| TH |
240 |
245 |
247 |
237.5 |
| Ca |
50 |
48 |
56.1 |
51 |
| Mg |
30 |
28 |
25.9 |
26.7 |
| Fe |
0.211 |
0.237 |
0.138 |
0.119 |
| Mn |
- |
- |
- |
- |
| Na |
14.5 |
16.57 |
15.3 |
14.1 |
| Cr |
- |
- |
- |
- |
| Pb |
- |
- |
- |
- |
| Zn |
0.004 |
0.004 |
- |
- |
| Cu |
- |
- |
- |
- |
| Ni |
0.005 |
0.008 |
0.07 |
0.017 |
| Total coliform |
112 |
50 |
50 |
48 |
| Fecal coliform |
15 |
10 |
0 |
5 |
The sign (-) in the wells means that the desired parameter is not observed in the water sample.
Temperature in degrees Celsius. pH is unitless. EC in terms of µs/cm. Hardness and alkalinity in terms of mg/L CaCO3. Other parameters are in mg/L. Total and fecal coliforms in MPN/100 mL
Table 6.
Quality of Water Resources around Khalkhal Municipal Solid Waste Landfill in High and Low Rainfall Seasons Based on Schoeller Diagram (
20)
|
Type of Water Source
|
Position of Water Sources
|
Water Quality
|
| Well No. 3 (control) |
Upstream |
Acceptable - Good drinking quality |
| Qasemzadeh well |
Downstream |
Acceptable - Good drinking quality |
| ABFA Aliabad well |
Downstream |
Acceptable - Good drinking quality |
| Ellar Baghi well |
Downstream |
Acceptable - Good drinking quality |
Table 7.
Determination of the Quality of Water Resources around Khalkhal Municipal Solid Waste Landfill Based on Wilcox Index in the Rainy Season
|
Type of Water Source
|
Position of Water Sources
|
EC
|
SAR
|
Water Class
|
Water Quality for Agriculture
|
| Well No. 3 (Control) |
Upstream |
802 |
3.65 |
C3-S1 |
Salty-with the necessary arrangements suitable for agriculture |
| Qasemzadeh well |
Downstream |
855 |
4.87 |
C2-S1 |
Slightly salty - relatively suitable for agriculture |
| ABFA Aliabad well |
Downstream |
924 |
6.92 |
C3-S2 |
Salty-with the necessary arrangements suitable for agriculture |
| Ellar Baghi well |
Downstream |
604 |
2.44 |
C2-S1 |
Slightly salty - relatively suitable for agriculture |
| Upstream of the Herochai river |
Upstream |
558 |
2.26 |
C2-S1 |
Slightly salty - relatively suitable for agriculture |
| Downstream of the Herochai river |
Downstream |
565 |
2.38 |
C2-S1 |
Slightly salty - relatively suitable for agriculture |
Table 8.
Determination of the Quality of Water Resources around Khalkhal Municipal Solid Waste Landfill Based on Wilcox Index in Low Rainfall Season
|
Type of Water Source
|
Position of Water Sources
|
EC
|
SAR
|
Water class
|
Water Quality for Agriculture
|
| Well No. 3 (Control) |
Upstream |
800 |
3.53 |
C3-S1 |
Salty-with the necessary arrangements suitable for agriculture |
| Qasemzadehwell |
Downstream |
780 |
5.96 |
C2-S1 |
Slightly salty - relatively suitable for agriculture |
| ABFA Aliabad well |
Downstream |
891 |
6.89 |
C3-S2 |
Salty-with the necessary arrangements suitable for agriculture |
| Ellar Baghi well |
Downstream |
559 |
3.16 |
C2-S1 |
Slightly salty - relatively suitable for agriculture |
| Upstream of the Herochai river |
Upstream |
560 |
2.68 |
C2-S1 |
Slightly salty - relatively suitable for agriculture |
| Downstream of the Herochai river |
Downstream |
580 |
2.29 |
C2-S1 |
Slightly salty - relatively suitable for agriculture |
The values of LWPI obtained in high and low rainfall seasons were 0.58 and 0.59, respectively, indicating that the landfill did not affect groundwater quality.
Figs. 3 and 4 present the results of two high and low rainfall seasons based on Schoeller diagram. Tables 6 and 7 (20) display the calculated sodium adsorption ratio (SAR), EC values, and the quality of water resources and their class based on Wilcox diagram for agricultural use. Additionally, the results based on Wilcox diagram in the two high and low rainfall seasons are presented in Figs. 5 and 6.
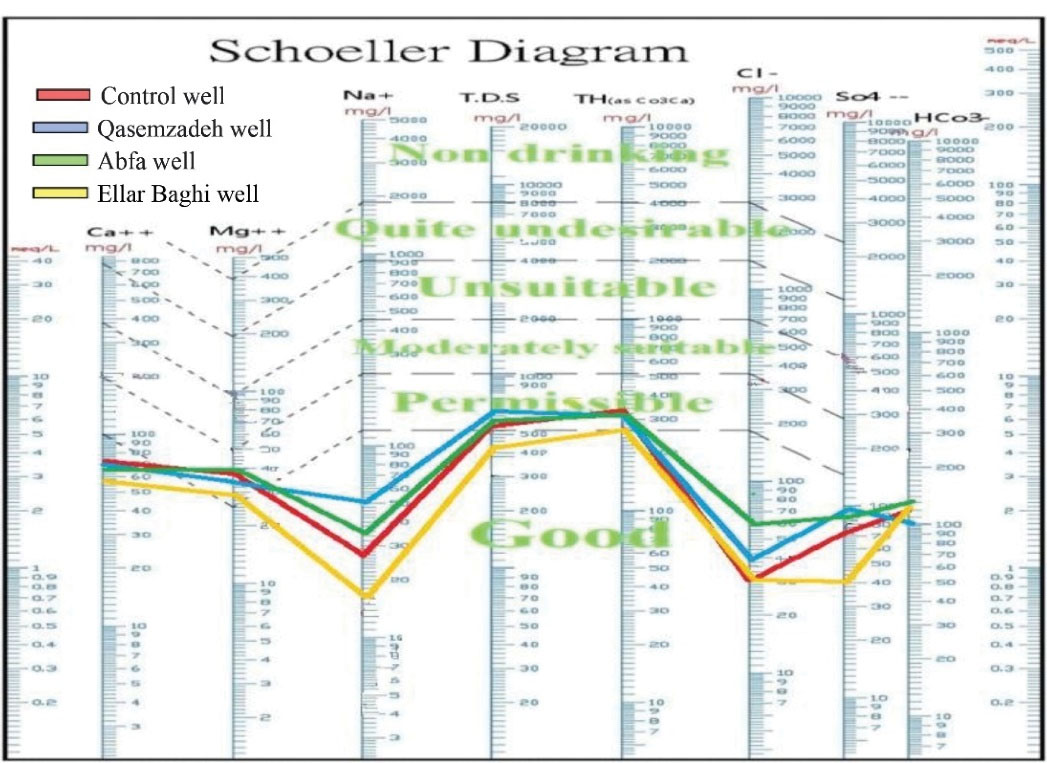
Figure 3.
Schoeller Diagram of Rainy Season in Wells Around Khalkhal Municipal Solid Waste Landfill.
.
Schoeller Diagram of Rainy Season in Wells Around Khalkhal Municipal Solid Waste Landfill.
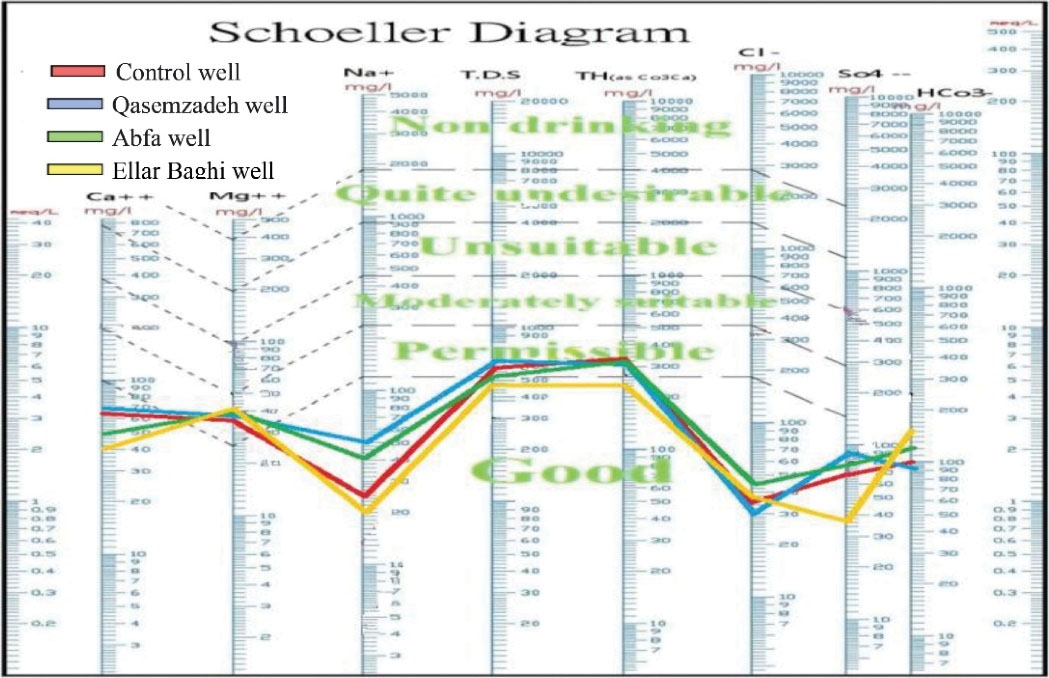
Figure 4.
Schoeller Diagram of Low Rainfall Season in Wells around Khalkhal Municipal Solid Waste Landfill.
.
Schoeller Diagram of Low Rainfall Season in Wells around Khalkhal Municipal Solid Waste Landfill.
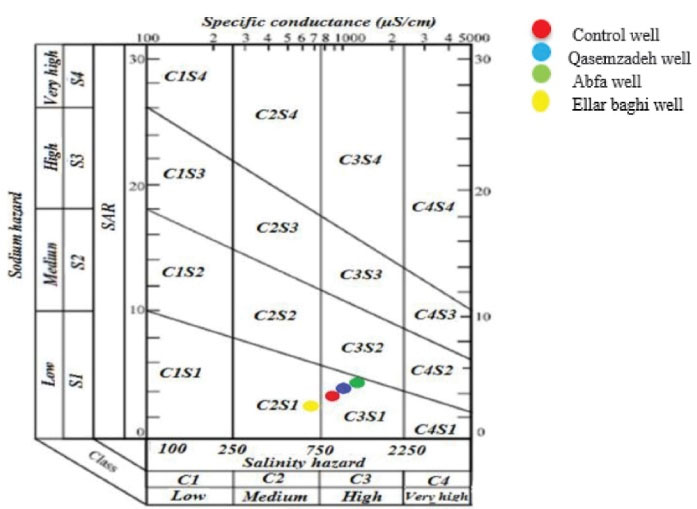
Figure 5.
Wilcox Diagram for the Rainy Season.
.
Wilcox Diagram for the Rainy Season.
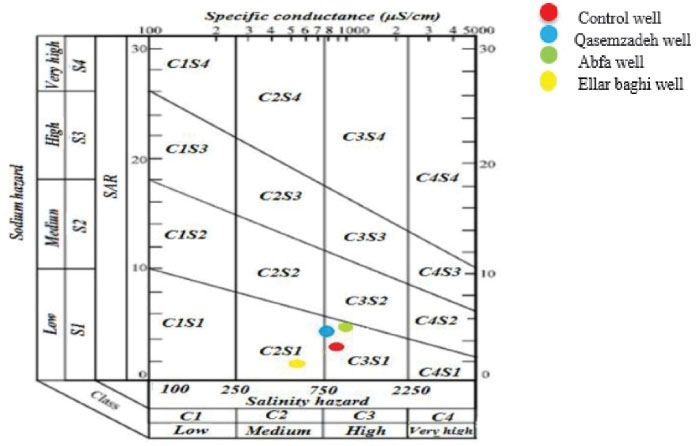
Figure 6.
Wilcox Diagram for Low Rainfall Season.
.
Wilcox Diagram for Low Rainfall Season.
The pH is an important parameter that affects the growth of plants, other aquatic organisms, and the solubility of matters in water. The majority of aquatic animals prefer a pH range of 6.5-9. In our study, the pH of the river and groundwater samples collected in high and low rainfall seasons ranged from 6.8 to 7.3 and in a normal range according to the standards; in other words, their use for drinking and agricultural purposes is not limited. In the study by Amano, pH values of groundwater and river were in the range of 5.1 to 7.7 (21). These results indicate that pH varies in different water resources. Following the results, the EC values of all surface and groundwater samples were less than the FAO guidelines for irrigation (16). The amounts of TDS of groundwater samples vary in the range of 424 to 652 mg/L and 390 to 487 mg/L in the Herochai river. According to the results, the quality of all surface and groundwater samples was desirable in terms of TDS, with no problems considering drinking and agricultural uses. In a study by Zeng et al on groundwater, the value of TDS was in the range of 38 to 342 mg/L (6). In the case of wells, the value of TDS in the control well was similar to the values obtained in other studies.
BOD5 (5 mg/L) and COD (17 mg/L) of upstream samples of the Herochai River in the low rainfall season were higher compared to downstream samples in the low rainfall season and upstream and downstream samples in the high rainfall season, which were lower than the maximum WHO guidelines for drinking water (17). This is probably due to the disposal of agricultural wastes and runoff upstream when the river flow is low. On the other hand, the self-purification capacity of the river probably reduced the values mentioned for downstream. In addition, these results confirm that in terms of organic matter, the landfill has no effect on the quality of groundwater and river water (22). The mean values of BOD5 and COD of the river at two upstream stations of the landfill were 1 and 45 mg/L, respectively. These values were (except for a station) about 5 and 70 mg/L, at downstream stations, which showed a significant increase in both parameters. However, no considerable change was observed in our study. In a study conducted by Thyagarajan et al on 23 selected sampling points of groundwater around the landfill, 13 points were polluted (with BOD5 and COD in the range of 2 to 6 and 32 to 704 mg/L, respectively) (23). Compared to this study, the results of our study indicate that the wells were not polluted with organic matter because all wells in our study had COD of less than 1 mg/L. The concentrations of nitrate in groundwater samples were in the range of 3 to 38 mg/L, and the highest value belonged to the Qasemzadeh well. According to the FAO guidelines (16), the amount was not suitable for irrigation, but there was no limitation in terms of drinking. Groundwater and surface water samples were in good condition in terms of nitrate; in other words, there is no particular concern about the quality of water resources in terms of drinking and agriculture. The possible reasons for high nitrate concentrations in Qasemzadeh well are the lands around this well because they are used for agriculture. Therefore, using nitrogen fertilizers in agriculture, high irrigation, heavy rainfall, and soil texture (loamy-sandy soil with high permeability) are among the factors that can affect the concentration of nitrate ions in groundwater in the region (24). The concentration of nitrate in all surface and groundwater samples in high and low rainfall seasons was less than 0.03 mg/L. A possible reason for the low concentration of nitrite could be the instability and rapid conversion of this ion to nitrate ions in nature. In a study by Samadder et al, the amounts of nitrate were found within the allowable limits of the Indian National Standard (25). In a similar study conducted in China on polluted groundwater (26), high concentrations of nitrate were observed at several sampling points but the low concentrations of nitrite were in agreement with the present study. The amounts of nitrate in our study were higher than the values obtained in a study by Thyagarajan et al study (23), where the concentrations of nitrate at 23 stations were in the range of 0.03 to 0.12 mg/L.
According to the results of Tables 2 to 4, in the present study, the concentrations of sulfate, calcium, magnesium, sodium, iron, and alkalinity, especially in the studied wells, were normal based on Iranian standards (19) and WHO guidelines (17). No significant difference was found between control and downstream wells in terms of the effect of the landfill on groundwater quality. Only the total hardness showed that the groundwater used for drinking in Khalkhal is considered hard water. According to the results, the amounts of magnesium in all well water samples were higher than the suggested value of Iranian national standard. Regarding the relationship between magnesium and sulfate ions in terms of taste changes and digestive system disorders, at magnesium concentrations higher than 30 mg/L, the concentration of sulfate should not exceed 250 mg/L. In the present study, the concentrations of magnesium and sulfate were observed to be 40 mg/L and 97.2 mg/L, respectively. The presence of magnesium can be due to the geological texture of the region, which includes calcareous salt and is the passage of water. The study results of Rashid in Kuwait showed that the soil and groundwater are polluted with TDS, Na, Ca, Mg, Cl, and SO4 due to the penetration of leachate from the landfill (27). In a study by Wong et al (28), the concentrations of calcium, magnesium, sodium, and iron in groundwater that were potentially polluted with leachate were 189, 31, 141, and 0.47 mg/L, respectively, which are high and differ from the values obtained in our study except for magnesium with similar values. In the study conducted by Samadder et al (25), the maximum and minimum alkalinity values of groundwater were 1765 and 240 mg/L, respectively. The high concentrations of soluble organic matters such as leachate and ionically charged organic acids play significant roles in producing total alkalinity. However, in our study, very high alkalinity was not observed as seen by Samadder et al (25).
The concentration of heavy metals in the surface and groundwater samples was low and sometimes lower than the limit of the device. According to the reported values, the quality of the samples taken in terms of heavy metals was lower than WHO and Iranian standards. Consequently, there was no limitation in terms of drinking (17,19) and agricultural (18) uses. The low concentration of these metals in all wells and the river indicate that the landfill does not affect the surveyed water resources in terms of these metals. In a similar study on waste mismanagement in Italy, the investigation of heavy metals in groundwater and surface showed that the concentrations of lead, nickel, and chromium decreased with increasing distance from the landfill. The reason for the high concentrations of the mentioned metals was the landfill (29). Chakraborty and Kumar also investigated the concentrations of heavy metals including Cu, Mn, As, Ni, and Pb, which reached maximum values of 0.19, 0.36, 0.01, 0.005, and 0.1 mg/L, respectively, indicating that the values exceeded the standards in some samples (30).
For biological parameters, except for Baghi well with a total of 3 coliforms per 100 mL in the rainy season, in other wells in the sampling site in both high and low rainfall seasons, total and fecal coliforms were not detected. In the Herochai river, however, the total and fecal coliforms exceed the WHO guidelines (17) for drinking (the range of total coliforms was 48 to 112 mL and the range of fecal coliforms was zero to 15 per 100 mL). In general, the most polluted station of the Herochai river in terms of coliforms belonged to downstream and low rainfall seasons. Coliforms can occur naturally in the soil, and other factors include animal manures used in agriculture, human and animal wastewater, and livestock activities in the river upstream. A similar study on waste mismanagement in Italy found high levels of coliforms in wells near the landfill and reported that households living around the landfill used the water from these wells for various purposes and high levels of coliforms were attributed to the proximity to the landfill (29).
In the present study, water resources quality for drinking purposes was investigated based on the Schoeller diagram and it was found that the groundwater was suitable for drinking. Additionally, the landfill did not change the quality of the water for drinking purposes. The data on the quality of water resources for agricultural purposes based on the Wilcox diagram also showed that the samples from the control well and ABFA Aliabad well during both high and low rainfall periods are in the salinity class C3-S2, which need treatment for agricultural use. According to the diagram, water quality is in the third class, which is only suitable for irrigating coarse-textured lands with good drainage. ABFA Aliabad well (66% sand) is located in coarse-textured lands. Water quality of Baghi and Ghasemzadeh wells and the Herochai River in both high and low rainfall seasons was in the slightly saline class C2-S1 and considered relatively suitable for agriculture. The changes in water quality showed that the landfill did not affect the quality of surrounding groundwater resources for agricultural use.
However, in this study, LWPI was also used, which showed that the landfill had no effect on groundwater quality in high and low rainfall seasons. The study conducted by Talalaj on the effect of landfills on groundwater showed that the effect was very strong (8). Gorzelak and Dąbrowska in their study on three aquifers concluded that the landfill may have no effect on one aquifer but can pollute the other two aquifers (31).
4. Conclusion
In investigating the quality of groundwater and surface water resources around Khalkhal landfill, we found that most of the values of the parameters measured in the water of downstream wells are less than the recommended limit by Iranian, WHO, and FAO standards/guidelines with no specific limitations on drinking and agriculture uses. The quality of the Herochai river water was also relatively undesirable in terms of turbidity and total coliform in some samples. Additionally, according to the study results, no difference was observed between high and low rainfall seasons. The concentrations of some pollutants in some downstream wells were slightly higher compared to the control well since these changes can be due to changes in soil texture, the geology of the region, and types of measurement errors, however, these differences were not significant. It can be concluded that the landfill did not affect the amount of water contamination. Data of the Schoeller and Wilcox diagrams also confirmed that Khalkhal municipal solid waste landfill did not change the quality of groundwater resources. Finally, LWPI, which shows the effect of landfills on downstream groundwater quality in both seasons, showed that the values were below one, indicating that landfills did not affect the water quality of wells.
Conflict of Interest Disclosures
The authors declare that they have no conflict of interests.
References
- Bodrud-Doza M, Islam SMD, Hasan MT, Alam F, Haque MM, Rakib MA. Groundwater pollution by trace metals and human health risk assessment in central west part of Bangladesh. Groundw Sustain Dev 2019; 9:100219. doi: 10.1016/j.gsd.2019.100219 [Crossref] [ Google Scholar]
- Masoner JR, Kolpin DW, Cozzarelli IM, Smalling KL, Bolyard SC, Field JA. Landfill leachate contributes per-/poly-fluoroalkyl substances (PFAS) and pharmaceuticals to municipal wastewater. Environ Sci Water Res Technol 2020; 6(5):1300-11. doi: 10.1039/d0ew00045k [Crossref] [ Google Scholar]
- Hussein M, Yoneda K, Mohd-Zaki Z, Amir A, Othman N. Heavy metals in leachate, impacted soils and natural soils of different landfills in Malaysia: an alarming threat. Chemosphere 2021; 267:128874. doi: 10.1016/j.chemosphere.2020.128874 [Crossref] [ Google Scholar]
- Ishchenko V. Heavy metals in municipal waste: the content and leaching ability by waste fraction. J Environ Sci Health A Tox Hazard Subst Environ Eng 2019; 54(14):1448-56. doi: 10.1080/10934529.2019.1655369 [Crossref] [ Google Scholar]
- Propp VR, De Silva AO, Spencer C, Brown SJ, Catingan SD, Smith JE. Organic contaminants of emerging concern in leachate of historic municipal landfills. Environ Pollut 2021; 276:116474. doi: 10.1016/j.envpol.2021.116474 [Crossref] [ Google Scholar]
- Zeng D, Chen G, Zhou P, Xu H, Qiong A, Duo B. Factors influencing groundwater contamination near municipal solid waste landfill sites in the Qinghai-Tibetan plateau. Ecotoxicol Environ Saf 2021; 211:111913. doi: 10.1016/j.ecoenv.2021.111913 [Crossref] [ Google Scholar]
- Talalaj IA, Biedka P. Use of the landfill water pollution index (LWPI) for groundwater quality assessment near the landfill sites. Environ Sci Pollut Res Int 2016; 23(24):24601-13. doi: 10.1007/s11356-016-7622-0 [Crossref] [ Google Scholar]
- Talalaj IA. Assessment of groundwater quality near the landfill site using the modified water quality index. Environ Monit Assess 2014; 186(6):3673-83. doi: 10.1007/s10661-014-3649-1 [Crossref] [ Google Scholar]
- Rana R, Ganguly R, Gupta AK. Indexing method for assessment of pollution potential of leachate from non-engineered landfill sites and its effect on ground water quality. Environ Monit Assess 2017; 190(1):46. doi: 10.1007/s10661-017-6417-1 [Crossref] [ Google Scholar]
- Knopek T, Dabrowska D. The use of the contamination index and the LWPI index to assess the quality of groundwater in the area of a municipal waste landfill. Toxics 2021; 9(3):66. doi: 10.3390/toxics9030066 [Crossref] [ Google Scholar]
- Baghanam AH, Nourani V, Aslani H, Taghipour H. Spatiotemporal variation of water pollution near landfill site: application of clustering methods to assess the admissibility of LWPI. J Hydrol 2020; 591:125581. doi: 10.1016/j.jhydrol.2020.125581 [Crossref] [ Google Scholar]
- Alizadeh M, Mirhoseini SA, Dolatabadi M, Ebrahimi AA. Evaluation the effect of landfill leachate on the surface water quality: a case study in Tonekabon landfill. J Environ Health Sustain Dev 2018; 3(1):472-80. [ Google Scholar]
- Przydatek G, Kanownik W. Impact of small municipal solid waste landfill on groundwater quality. Environ Monit Assess 2019; 191(3):169. doi: 10.1007/s10661-019-7279-5 [Crossref] [ Google Scholar]
- American Public Health Association, American Water Works Association, Water Environment Federation. Standard Methods for the Examination of Water & Wastewater. 21st ed. Washington, DC: APHA; 2005.
- ASTM Standards (D422-63). Standard test method for particle-size analysis of soils. West Conshohocken, PA, USA: ASTM; 2007.
- Abdollahi Z, Kavian A, Sadeghi SH. Spatio-temporal changes of water quality variables in a highly disturbed river. Glob J Environ Sci Manag 2017; 3(3):243-56. doi: 10.22034/gjesm.2017.03.03.002 [Crossref] [ Google Scholar]
- World Health Organization (WHO). Guidelines for Drinking-Water Quality. 4th ed. WHO; 2011.
- Iran water quality standard. Environmental Protection Organization, Human Environment Deputy, Water and Soil Office; 2016. [Persian].
- Drinking Water Physical and Chemical Specification. 5th ed. Amendment No.1. Institute of Standards and Industrial Research of Iran. ICS:13.060.020. No: 1053; 2013. [Persian].
- Parastar S, Jalilzadeh A, Poureshg Y, Hashemi M, Rezaee A, Hossini H. Assessment of national sanitation foundation water quality index and other quality characterization of Mamloo dam and supporting streams. Int J Environ Health Eng 2015; 4(3):44. doi: 10.4103/2277-9183.170711 [Crossref] [ Google Scholar]
- Amano KO, Danso-Boateng E, Adom E, Kwame Nkansah D, Amoamah ES, Appiah-Danquah E. Effect of waste landfill site on surface and ground water drinking quality. Water Environ J 2021; 35(2):715-29. doi: 10.1111/wej.12664 [Crossref] [ Google Scholar]
- Tengku Ibrahim TN, Othman F, Mahmood NZ. Assessment of water quality of Sembilang River receiving effluent from controlled municipal solid waste (MSW) landfill in Selangor. IOP Conf Ser Mater Sci Eng 2017; 210:012019. doi: 10.1088/1757-899x/210/1/012019 [Crossref] [ Google Scholar]
- Thyagarajan LP, Jeyanthi J, Kavitha D. Vulnerability analysis of the groundwater quality around Vellalore-Kurichi landfill region in Coimbatore. Environ Chem Ecotoxicol 2021; 3:125-30. doi: 10.1016/j.enceco.2020.12.002 [Crossref] [ Google Scholar]
- Modabber B, Alighadri M, Rahmani K. Assessment of groundwater quality around of municipal solid waste transfer station in Ardabil. J Environ Heath Eng 2018; 5(3):277-85. doi: 10.29252/jehe.5.3.277.[Persian] [Crossref] [ Google Scholar]
- Samadder SR, Prabhakar R, Khan D, Kishan D, Chauhan MS. Analysis of the contaminants released from municipal solid waste landfill site: a case study. Sci The Total Environ 2017; 580:593-601. doi: 10.1016/j.scitotenv.2016.12.003 [Crossref] [ Google Scholar]
- Wang F, Song K, He X, Peng Y, Liu D, Liu J. Identification of Groundwater Pollution Characteristics and Health Risk Assessment of a Landfill in a Low Permeability Area. Int J Environ Res Public Health 2021; 18(14):7690. doi: 10.3390/ijerph18147690 [Crossref] [ Google Scholar]
- Al Rashed AR. The environmental impacts of Kabd landfill on the soil and groundwater in Kuwait: a case study. Int J Geosci 2018; 9(5):255-71. doi: 10.4236/ijg.2018.95016 [Crossref] [ Google Scholar]
- Wong MH, Li MM, Leung CK, Lan CY. Decontamination of landfill leachate by soils with different textures. Biomed Environ Sci 1990; 3(4):429-42. [ Google Scholar]
- Ferronato N, Torretta V. Waste mismanagement in developing countries: a review of global issues. Int J Environ Res Public Health 2019; 16(6):1060. doi: 10.3390/ijerph16061060 [Crossref] [ Google Scholar]
- Chakraborty S, Kumar RN. Assessment of groundwater quality at a MSW landfill site using standard and AHP based water quality index: a case study from Ranchi, Jharkhand, India. Environ Monit Assess 2016; 188(6):335. doi: 10.1007/s10661-016-5336-x [Crossref] [ Google Scholar]
- Gorzelak M, Dąbrowska D. Assessment of changes in the quality of ground water in the area of landfill site in Poczesna (South Poland) using the LWPI index. Environ Socio-Econ Stud 2021; 9(1):35-43. doi: 10.2478/environ-2021-0004 [Crossref] [ Google Scholar]