Avicenna J Environ Health Eng. 9(1):1-8.
doi: 10.34172/ajehe.2022.01
Original Article
Simulation of an Industrial Wastewater Treatment Plant by Up-flow Anaerobic Fixed Bed Bioreactor Based on an Artificial Neural Network
Kobra Verijkazemi 1, *  , Reza Jalilzadeh Yengejeh 2
Author information:
1Department of Civil Engineering, Tonekabon Branch, Islamic Azad University, Tonekabon, Iran
2Department of Environmental Engineering, Ahvaz Branch, Islamic Azad University, Ahvaz, Iran
Abstract
Given the variable nature of industrial wastewaters, the appropriate operation of an industrial wastewater treatment plant (WWTP) is a prerequisite for keeping process stability at ideal conditions. In this respect, an artificial neural network (ANN) can be a powerful device for the prediction of treatment performance. This study assessed some qualitative parameters of industrial wastewater (Amol Industrial Estate) during a one-year operating period. The wastewater treatment process consisted of an equalization tank, up-flow anaerobic fixed bed (UAFB) bioreactor, activated sludge tank, sedimentation tank, and chlorination basin. The ANN was utilized to estimate the system efficiency of the UAFB process. The outcomes demonstrated an extraordinary arrangement between the real and simulated data (R2>0.8). This model supplied a proper device for forecasting the implementation of WWTPs. Continuous checking elements could be used for the simulation of wastewater specifications.
Keywords: Industrial wastewater, Artificial neural network, UAFB bioreactor, Simulation
Copyright and License Information
© 2022 The Author(s); Published by Hamadan University of Medical Sciences.
This is an open-access article distributed under the terms of the Creative Commons Attribution License (
http://creativecommons.org/licenses/by/4.0), which permits unrestricted use, distribution, and reproduction in any medium provided the original work is properly cited.
Please cite this article as follows: Verijkazemi K, Jalilzadeh Yengejeh R. Simulation of an Industrial wastewater treatment plant by upflow anaerobic fixed bed bioreactor based on an artificial neural network. Avicenna J Environ Health Eng. 2022; 9(1):1-8. doi:10.34172/ ajehe.2022.01
1. Introduction
Anaerobic wastewater treatment is a kind of biological treatment where anaerobic microorganisms are utilized to separate and eliminate biological pollutants from wastewater. Anaerobic treatment processes have several applications over the aerobic treatment processes, including lower production of sludge, reducing sludge disposal costs and requiring less energy for its system compared to the aerobic treatment (1-8). Recently, the use of smart models has been increased, including an artificial neural network (ANN), which is an extraordinary kind of machine calculation that is designed according to the human brain. ANNs are nonlinear statistical models which show a complicated connection between the inlets and outlets to find another example. A significant benefit of an ANN is the way that it sorts information on the model without knowing any previous hypotheses of relationship between parameters, and an irregular capacity estimation is considered as the most normal application of an ANN, providing an economical technique for showing up at the arrangements that characterize the spreading (9,10). A Kaiser-Meyer-Olkin (KMO) test is utilized in investigations to decide the inspecting efficiency of information for factor examinations. Social researchers regularly use factor investigation to guarantee that the applied factors for quantifying a specific idea are estimating the expected idea (11). Dogan evaluated the capacities of the ANN model to raise the precision of biochemical oxygen demand (BOD) assessments. In this research, the capability of an ANN method in BOD assessment in Melen River was analyzed by contrasting the outcomes and obtained BOD. From the acquired outcomes, an ANN model seems, by all accounts, to be a proper device for the expectation of the BOD in Melen River (12). In a study (13), three autonomous ANN models, which were prepared with back proliferation calculations, were created to anticipate wastewater chemical oxygen demand (COD), suspended solids (SS), and aeration tank blended mixed liquor suspended solid concentrations of Ankara focal wastewater treatment plant (WWTP). Elmolla et al inspected the performance of the ANN to predict and simulate the removal of COD from a watery antibiotic arrangement by the Fenton process. The obtained data showed a correlation coefficient (R2) of 0.997, and a mean square error (MSE) of 0.00037 (14). In another study, an ANN-genetic algorithm (GA) and an active neural-fuzzy logic inference system were used in correlation with an ANN to simulate WWTP execution. The outcome demonstrated that the GA creates more precise outcomes than a fuzzy logic strategy. It was observed that GA parts expanded the ANN capacity in foreseeing WWTP execution. The normalized root means square error (RMSE) for an ANN-GA in simulating COD, total suspended solids (TSS), and BOD was 0.150, 0.190, and 0.150, and the corresponding relationship coefficients were 0.89, 0.93, and 0.89, respectively (15). In this study, the operation of an up-flow anaerobic fixed bed (UAFB) treating wastewater of Amol Industrial Estate was reported for one year and then was modeled by ANNs. The predictability of the COD, TSS, and total dissolved solid (TDS) concentrations and pH in the effluent leaving the UAFB was investigated as well. The obtained results were quantitatively compared to experimental values and determined using linear regression. The current research sought to utilize ANN simulating to anticipate the execution of a UAFB bioreactor.
2. Materials and Methods
2.1. Study Area
Amol Industrial Estate treatment plant collects effluents from several companies such as poultry processing plant, meat and natural product juice activating plant, paperboard plant, dairy ranch items, glass industrial facility, tomato cannery, and a wide range of small plants. The industrial state is located in a 20 hectare of pasture land with a highly beautiful outskirt. The industrial activities generate a wastewater release stream amount of 350-400 m3 per day. The selected wastewater for the present research was obtained from the treatment plant of Amol Industrial Estate. This plant is located at a distance of 10 km of Amol, Mazandaran in the north of Iran. In addition to the plant, a small research laboratory was assigned to monitor the efficiency of the treatment plant. This plant site was selected because it has a short distance and was more convenient for sampling and data analysis. A significant variation in the composition of the created wastewater by several industries was considered as a challenge in guaranteeing the proficiency and viability of the WWTP. Different variables contributing to proficiency were pH, temperature, wastewater flow rate, and presence of toxic components. The effluent of the treatment plant unit must be in accordance with the effluent discharge standards (16,17) and is discharged to a sedimentation tank after biological treatment. Sludge is settled and the treated effluent will be discharged to the chlorination tank. Finally, the chlorinated effluent is discharged to Haraz River, which is near the plant. Amol WWTP units include equalization tank, UAFB bioreactor, activated sludge tank, sedimentation tank, and chlorination, respectively. In the activated sludge system, the air was supplied by a special air blower through the air diffusers installed in the bottom of the tank for efficient aeration. The process parameters were COD, TSS, pH, turbidity, and TDS. All the testing materials and strategies utilized in this research relied on Standard Methods for the Examination of Water and Wastewater (18). Two fixed-bed bioreactors with a volume of 120 m3 were used in this study. The reactors were filled with corrugated concrete. An improved schematic chart of the treatment plant is introduced (Fig. 1). More secure activity and control of the plant can be accomplished by improving an ANN model for anticipating the plant execution relying on previous perceptions of specific key wastewater quality factors.
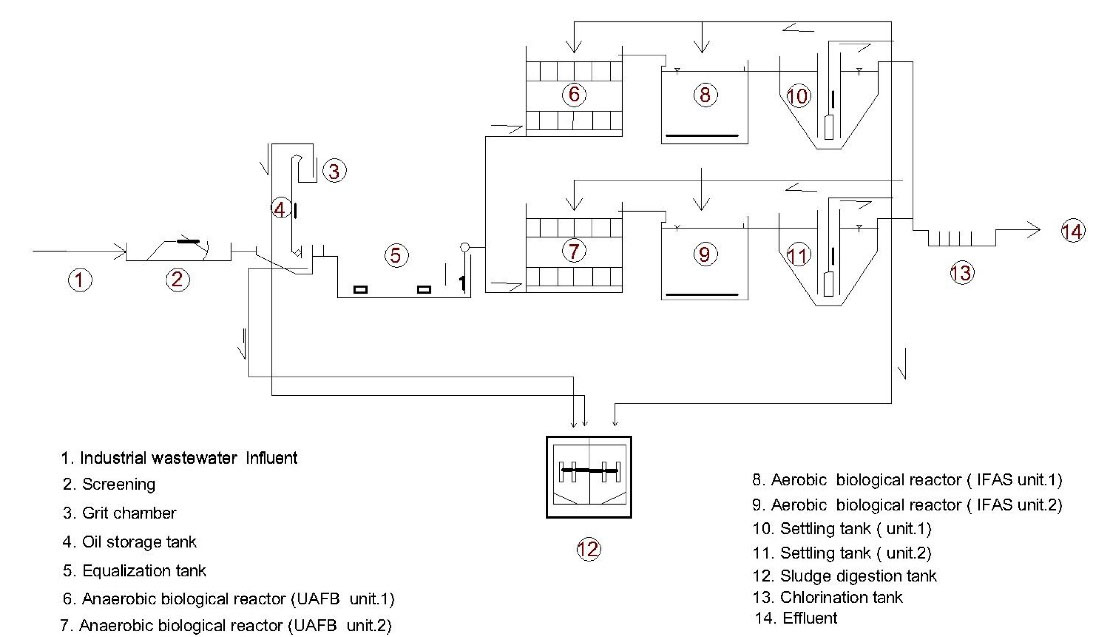
Figure 1.
Schematic Process Flow Diagram for Amol WWTP. Note. WWTP: Wastewater treatment plant; UAFB: Up-flow anaerobic fixed bed; IFAS: Integrated fixed activated sludge.
.
Schematic Process Flow Diagram for Amol WWTP. Note. WWTP: Wastewater treatment plant; UAFB: Up-flow anaerobic fixed bed; IFAS: Integrated fixed activated sludge.
2.2. Artificial Neural Networks
An ANN is the piece of a registering framework that is intended to recreate how the human mind breaks down and processes data (21). An artificial neural organization depends on the assortment of associated units or nodes called artificial neurons, which freely model the neurons in a natural cerebrum. Every association, similar to neuron transmitters in a biological cerebrum, can communicate a sign to different neurons. A counterfeit neuron that receives a sign then, at that point, processes it and can flag associated neurons (22). Handling units make up ANNs, which thus comprise the sources of info and results (23). The information sources are what the ANN obtains to create the ideal result. The info layer is the primary layer of an ANN that receives the info data as different texts, numbers, sound records, picture pixels, and the like (24). There are secret layers in the ANN model. There can be a solitary secret layer, as on account of a perceptron or different secret layers (25). These hidden layers perform different sorts of numerical calculations on the information and perceive the examples that are essential for them (26). The aftereffects of precise computations performed by the center layer will be acquired in the result layer. In a neural organization, there are various boundaries and hyperparameters that influence the presentation of the model. The result of ANNs is generally subject to these boundaries. A portion of these boundaries includes loads, inclinations, learning rate, group size, and so forth. Every hub in the ANN has some weight, and every nod in the organization has some loads relegated to it. An exchange work is utilized for computing the weighted amount of information sources and the inclination. After the exchange work has determined the total, the enactment work acquires the outcome. In view of the obtained result, the actuation capacities fire the fitting outcome from the nod (27). This study focused on using the ANN to foresee the presentation of the Amol WWTP through predicting the significant indicators of wastewater quality. Two sorts of feedforward networks were utilized to develop the ANN prescient model, including multilayer perceptron (MLP) and radial basis function (RBF) neural organizations, which are prepared on the gathered information for building prescient models for the expectation of wastewater quality boundaries. The picked MLP one-secret layer and the RBF network were prepared using the back spread joined with LM calculation and orthogonal least squares calculation, respectively. Prior to running all models, informational indexes were standardized to be incorporated inside the span {0, 1} according to previous research. The stop rules depend on the MSE for the approval set rather than that for the preparation set to guarantee model speculation. The applied method for preparing, approving, and testing the ANN model is described below for predicting wastewater quality parameters. The schematic ANN model in this work is shown in Fig. 2.
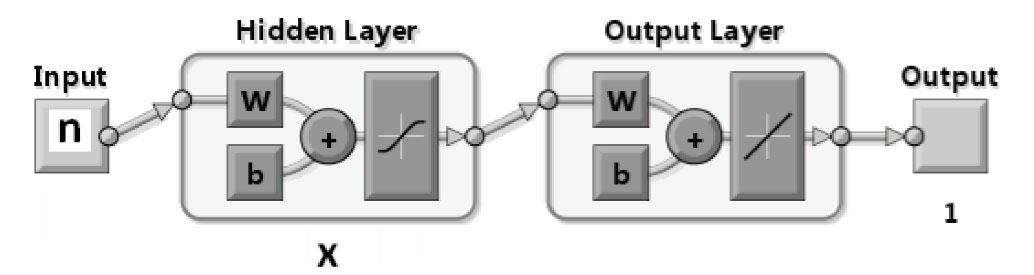
Figure 2.
The Applied Schematic Neural Model.
.
The Applied Schematic Neural Model.
2.3. Factor Analysis Technique
One of the measurable techniques for expounding the data in a collection of information is factor examination, which is a valuable and proper method for a more voluminous assortment of information. Generally, the principal objective of the component investigation is to understand the interior connection among some noticed indicators through lower quantities of unobserved variables called factors. The subsequent capacity is presenting a strategy for consolidating and briefing different factors into discrete gatherings and deciding on the most effective factors. The connection pattern is one of the methods for selecting suitable factors to utilize in factor investigation. The relationship pattern should be determined since the factor analysis depends on a non-causal interconnection between factors. There is another measurement which can help in surveying the appropriateness of the information for use in factor investigation (28,29). KMO coefficient test is a proportion of how fit your information is for factor analysis and estimates ampleness for every factor in the model and for the total model. It is one of those techniques which its worth fluctuates among zero and solidarity and is determined by (Eq.1) as follows:
(1)
Where rij is the correlation between the variable in the question and the other variables, and aij is the partial correlation. The worth of KMO would associate with solidarity if the pluralization of the fractional connection coefficient between all matched factors was irrelevant corresponding to adding up to the squares of the relationship coefficient. The small upsides of KMO demonstrate that the connection of the combined factors could not be dictated by different factors. Thus, the use of FA for these factors would not be sensible. Table 1 provides satisfactory qualities for the KMO coefficient. Those factors, which have a satisfactory KMO coefficient and are in a similar scope of the KMO coefficient, are considered as information factors (11).
Table 1.
Assortment of KMO Coefficient
|
Level of Acceptance
|
KMO Value
|
| Great |
> 0.9 |
| Very good |
0.8 to 0.9 |
| Good |
0.7 to 0.8 |
| Medium |
0.5 to 0.7 |
| Unacceptable |
< 0.5 |
Note. KMO:Kaiser-Meyer-Olkin.
2.4. Assessment Standards for ANN Forecast
To figure out which organization structure is ideal, the exhibition of an adjusted model was taken into account in contrast to at least one rule. In this research, the ANN model execution was surveyed by a quantitative mistake metric. The utilized measurements having a place with this class incorporate mean outright rate blunder, RMS mistake, and R correlation. The chosen model should be assessed after picking a model design and preparing the organization. Practically, the precision of a model is controlled by the ‘decency of fit’ between the results of the model and the framework given similar information. Hence, some approval tests should be taken into consideration. For the most part, the precision of a model should be assessed for three arrangements of information tests. These data sets include preparing information expressing the adequacy of learning, approving informational collection used to save the model from the overfitting issue, and testing informational collection that measure the speculation ability of the network. There is a need to point out that the testing informational collection should show the whole activity range while not having preferably been recently introduced to the organization (30). Thus, in addition to assessing the mistake level of models, Pearson’s R, RMSE, and mean absolute error (MAE) were used in this research, which are expressed as follows (31).
(3)
(4)
where Xi and Yi are the noticed and assessed worthiness of ith, individually. Further, X and Y are the mean of Xi and Yi, and N denotes the complete quantities of inputs.
3. Results and Discussion
This study was carried out in the wastewater treatment plant of Amol.The system used in the WWTP is UAFB bioreactor. Fig. 1 displays the system flowsheet and some data about those sections. Considering the importance of the UAFB bioreactor for the Amol treatment plant, this unit was simulated separately. Moreover, the wastewater of a stabilizer unit having similar specifications was utilized given the vast variety of the possibilities of approaching wastewater to units. Table 2 provides data on the UAFB bioreactor model. Note that only one result of some data sources is achieved in simulating. Accordingly, the number of test system models running during UAFB bioreactor simulating would be as indicated by the number of results (six results in this study). Based on the obtained data (Table 2) and the studied process parameters (5 parameters), there was a relationship between the two studied parameters. Therefore, only the result information of the equalization tank could be used for modeling pH and TDS. Figs. 4 to 6 illustrate the simulating results for pH and TDS parameters. As shown in Figs. 3 and 4, the varieties of 50 pH tests are in the range of 5.6-8.5, indicating wastewater with variable specifications. According to Fig. 3, the model is suitably ready for projecting intense qualities (the highest and least rates of pH) with acceptable estimates, and with regards to pointless mistakes, it tends to be utilized with good quality. Fig. 5 depicts that a variety scope of TDS lies in the range of 500-2400 mg/L, which is a vast change. Similar to pH, this model is acceptable and ready to simulate severe qualities for TDS, and users can apply it with a proper confidence level. The model would simulate more precisely when two factors of valence had a lower level. The upsides of RMSE and MAE were 0.34 and 0.46 individually. These outcomes are predictable with those of a previous report (32). Based on the results of Table 3, this model is adequately precise and can be utilized in simulations, and this could be affirmed by the upsides of two factual boundaries of MAE/RMSE, which are the standards of precision for simulation. It is noteworthy that MAE and RMSE should be independently determined for the boundary of each model. It is vital that the projected qualities extraordinarily adjust to noted ones (Table 3). According to recent references and because of the lack of comparative models in previous units, contrasting models is not feasible, and the mistake of each model can be simply studied with regard to the changes and upsides of information. It is significant that the pH model is the high trusty model in the forecast, and administrators with a decent accuracy can use it. A KMO test is utilized in exploration to decide the examining ability of data for factor analysis. The KMO test helped ensure that the information is appropriate for running a factor analysis and in this manner, deciding if we have set out what we expect to quantify. Since the standard is in the range of 0-1, the outcome is better when the number is nearer to 1. Table 2 presents the statistical analysis of UAFB bioreactor data and the KMO coefficient.
Table 2.
Output of SPSS Software Analysis for the UAFB Bioreactor
|
Model
|
Equalization Tank/UAFB Bioreactor
|
KMO Coefficient
|
| 01 |
pH |
0.74 |
| 02 |
Total dissolved solid |
0.72 |
| 03 |
Phenol |
0.60 |
| 04 |
Oil |
— |
| 05 |
Turbidity |
0.61 |
Note. UAFB: Up-flow anaerobic fixed bed; KMO: Kaiser-Meyer-Olkin.
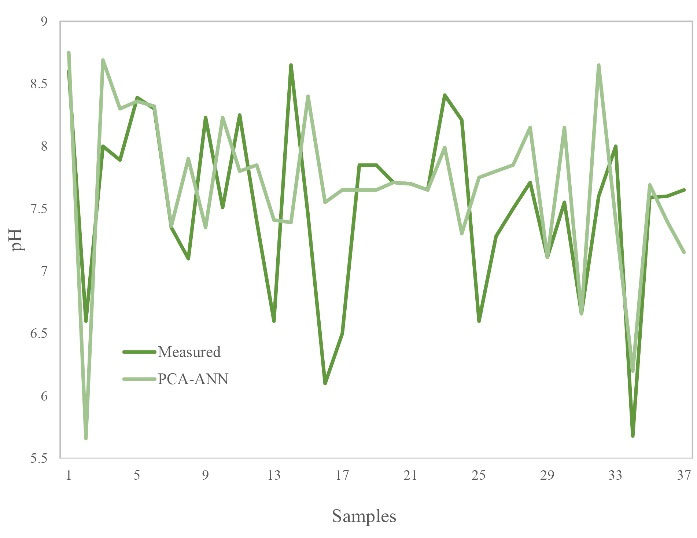
Figure 3.
Results of the Output Model and the Chart of pH for the UAFB Bioreactor Note. UAFB: Up-flow anaerobic fixed bed.
.
Results of the Output Model and the Chart of pH for the UAFB Bioreactor Note. UAFB: Up-flow anaerobic fixed bed.
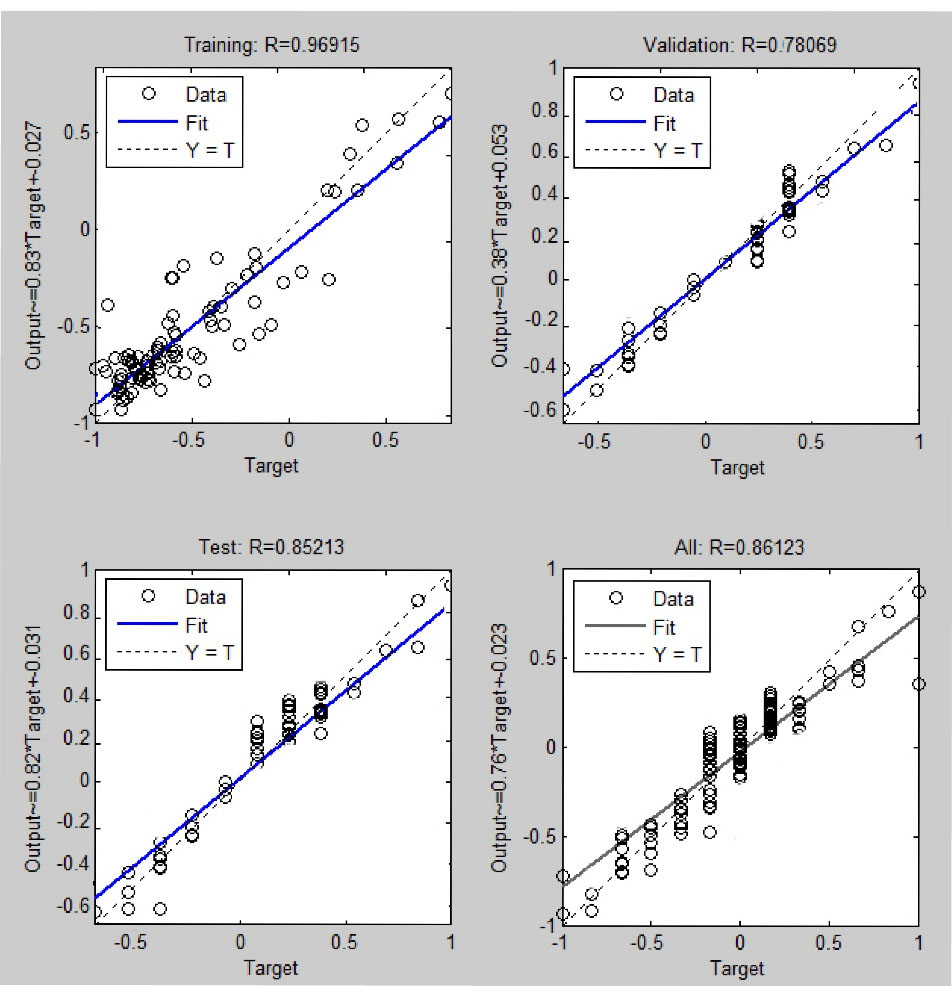
Figure 4.
Network Regression of pH for the UAFB Bioreactor. Note. UAFB: Up-flow anaerobic fixed bed.
.
Network Regression of pH for the UAFB Bioreactor. Note. UAFB: Up-flow anaerobic fixed bed.
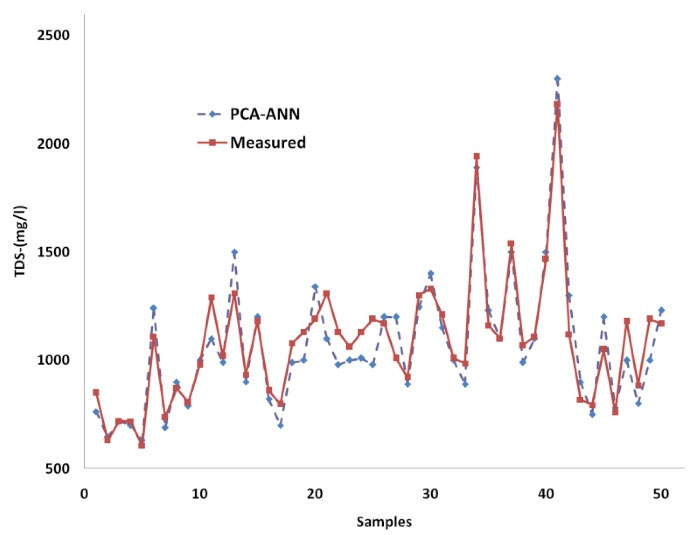
Figure 5.
Results of the Output Model and Chart of TDS for the UAFB Bioreactor. Note. TDS: Total dissolved solid; UAFB: Up-flow anaerobic fixed bed.
.
Results of the Output Model and Chart of TDS for the UAFB Bioreactor. Note. TDS: Total dissolved solid; UAFB: Up-flow anaerobic fixed bed.
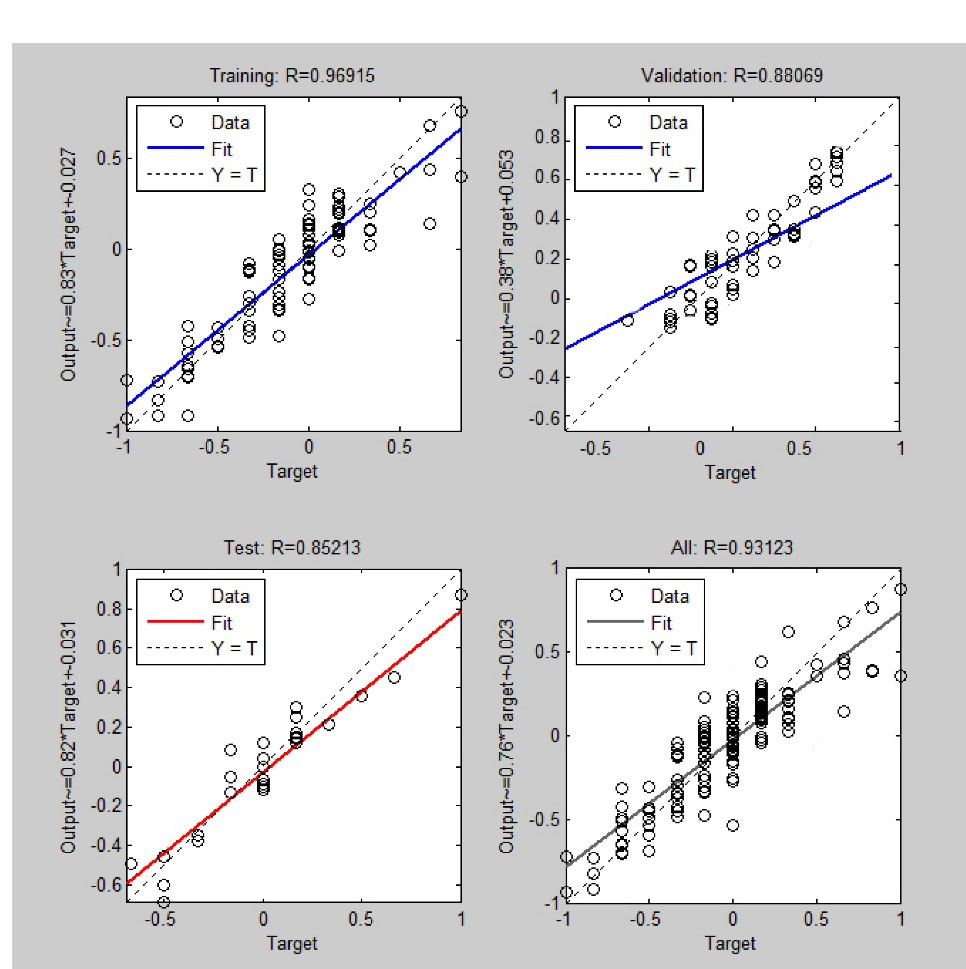
Figure 6.
Network Regression of TDS for the UAFB Bioreactor. Note. TDS: Total dissolved solid; UAFB: Up-flow anaerobic fixed bed.
.
Network Regression of TDS for the UAFB Bioreactor. Note. TDS: Total dissolved solid; UAFB: Up-flow anaerobic fixed bed.
Table 3.
Output of ANN Models for a UAFB Bioreactor
|
Number
|
Model
|
R
|
MAE
|
RMSE
|
Inputs
|
| 01 |
pH |
0.91 |
0.33 |
0.44 |
50 |
| 02 |
TDS |
0.86 |
80.83 |
102.37 |
50 |
Note. ANN: Artificial neural network; UAFB: Up-flow anaerobic fixed bed; MAE: Mean absolute error; RMSE: Root means square error; TDS: Total dissolved solid.
MSE, RMSE, and Pearson’s R were utilized for assessing the implementation of the ANN model. Based on the outcomes, Pearson’s R in the range of 0.8-0.9 showed high exactness of the models in assessing the subjective image of WWTP, and a model was created to precisely foresee the subjective attributes of the effluent of treatment sections, essentially time. Some studies reported a high correlation coefficient (R-value) among the observed and simulated results for parameters, coming to up to 0.9995 (33) and 0.89 and 0.96 (34). Previous research focused on the activity of various wastewater treatment systems and streamlining of the evacuation of ideal boundaries and demonstrated various outcomes in this regard. In this research, the ideal ANN models were chosen for fecal coliform and total coliform on the trial-and-error method (35). In the present study, the values of RMSE and MAE were 0.34 and 0.46, respectively. In another study, an ANN was used to predict the performance of EL-AGAMY WWTP-Alexandria in terms of COD and BOD, and the results revealed that the ANN can predict the plant performance with correlation coefficient (R) between the observed and predicted output variables reached up to 0.90 (36). Comparative correlation coefficient (R) and larger numbers were acquired (0.92) in this research. In a review, the enhanced ANN design (6–10–1), using the Levenberg-Marquardt preparing calculation, represented the most elevated prescient exhibition (R2= 0.983) and concurrence on the ANN affectability investigation, and the overall significance of the environmental component was organized as NO3− > PO43-> pH ≈ DO > temperature > EC (37). It is important to clarify that various models are applied in data examination and the results. For instance, in their review, Wang reported what variables influence the exactness of the AN-based delicate detecting models (38).
4. Conclusion
According to the obtained results, the created model in this research had a good popularization capacity and validity. To have a more exact model, factor analysis was employed to select efficient primary data. The results of factor analysis showed that a couple of elements have the capacity of simulation in various parts of a treatment plant. The outcomes of the real investigation were evaluated and confirmed by the ANN model, pH, and TDS in the UAFB bioreactor. pH and TDS were simulated as well. The error assessment revealed that forecast models have somewhat great precision and are satisfactory. The relationship coefficients of forecast models were additionally more noteworthy than 0.8. As to high varieties in the convergence of entering boundaries, this worth is acceptable. Accordingly, utilizing ANNs that are fit for divination nonlinear and complex connection among the sources of info and results, there is a suitable answer for supplanting direct multivariable regression strategies. Another matter is the lack of equivalent models and essential standards needed for the neural modeling of an industrial WWTP. Subsequently, it is impossible to expect to contrast the other neural network and other comparable models, and results satisfactorily relied on assign examinations. Thus, the outcomes of the present research can be accepted as a reason for contrasting and further developing subsequent investigates. In the present research, no model was provided for nitrogen and phosphorous as the most conspicuous biological factors, and this is probably the main fault of the present study. Thus, using other models such as fuzzy-neural and multilayer – neural network techniques is suggested for additional investigations.
Acknowledgements
The author thanks all the staff of the wastewater treatment plant of Amol Industrial Estate.
Conflict of Interest Disclosures
The authors declare that they have no competing interests.
References
- Bi H, Wang C, Jiang X, Jiang C, Bao L, Lin Q. Thermodynamics, kinetics, gas emissions and artificial neural network modeling of co-pyrolysis of sewage sludge and peanut shell. Fuel 2021; 284:118988. doi: 10.1016/j.fuel.2020.118988 [Crossref] [ Google Scholar]
- Alsulaili A, Refaie A. Artificial neural network modeling approach for the prediction of five-day biological oxygen demand and wastewater treatment plant performance. Water Supply 2020; 21(5):1861-77. doi: 10.2166/ws.2020.199 [Crossref] [ Google Scholar]
- Takdastan A, Kordestani B, Nisi A, Jalilzadeh Yengejeh R. Study of operational and maintenance problems and parameters of extended aeration activated sludge process in Golestan hospital wastewater treatment plant, Ahvaz, and their solutions. J Environ Health Eng 2016; 3(4):270-9. doi: 10.18869/acadpub.jehe.3.4.270.(Persian) [Crossref] [ Google Scholar]
- Heidari Farsani M, Jalilzadeh Yengejeh R, Hajiseyed Mirzahosseini A, Monavari M, Hassani AH, Mengelizadeh N. Effective leachate treatment by a pilot-scale submerged electro-membrane bioreactor. Environ Sci Pollut Res Int. 2021. 10.1007/s11356-021-16196-0.
- Matheri AN, Ntuli F, Ngila JC, Seodigeng T, Zvinowanda C. Performance prediction of trace metals and cod in wastewater treatment using artificial neural network. Comput Chem Eng 2021; 149:107308. doi: 10.1016/j.compchemeng.2021.107308 [Crossref] [ Google Scholar]
- Jawad J, Hawari AH, Zaidi SJ. Artificial neural network modeling of wastewater treatment and desalination using membrane processes: a review. Chem Eng J 2021; 419:129540. doi: 10.1016/j.cej.2021.129540 [Crossref] [ Google Scholar]
- Amini Fard F, Jalilzadeh Yengejeh R, Ghaeni M. Efficiency of microalgae scenedesmus in the removal of nitrogen from municipal wastewaters. Iran J Toxicol 2019; 13(2):1-6. doi: 10.32598/ijt.13.2.483.2 [Crossref] [ Google Scholar]
- Abbaspour M, Javid AH, Jalilzadeh Yengjeh R, Hassani AH, Mostafavi PG. The biodegradation of methyl tert-butyl ether (MTBE) by indigenous Bacillus cereus strain RJ1 isolated from soil. Pet Sci Technol 2013; 31(18):1835-41. doi: 10.1080/10916466.2011.611562 [Crossref] [ Google Scholar]
- Hamada M, Adel Zaqoot H, Abu Jreiban A. Application of artificial neural networks for the prediction of Gaza wastewater treatment plant performance-Gaza strip. J Appl Res Water Wastewater 2018; 5(1):399-406. doi: 10.22126/arww.2018.874 [Crossref] [ Google Scholar]
- Gopi Kiran M, Das R, Behera SK, Pakshirajan K, Das G. Modelling a rotating biological contactor treating heavy metal contaminated wastewater using artificial neural network. Water Supply 2020; 21(5):1895-912. doi: 10.2166/ws.2020.304 [Crossref] [ Google Scholar]
- Li X, Du J, Long H. Understanding the green development behavior and performance of industrial enterprises (GDBP-IE): scale development and validation. Int J Environ Res Public Health 2020; 17(5):1716. doi: 10.3390/ijerph17051716 [Crossref] [ Google Scholar]
- Dogan E, Ates A, Yilmaz EC, Eren B. Application of artificial neural networks to estimate wastewater treatment plant inlet biochemical oxygen demand. Environ Prog 2008; 27(4):439-46. doi: 10.1002/ep.10295 [Crossref] [ Google Scholar]
- Güçlü D, Dursun S. Artificial neural network modelling of a large-scale wastewater treatment plant operation. Bioprocess Biosyst Eng 2010; 33(9):1051-8. doi: 10.1007/s00449-010-0430-x [Crossref] [ Google Scholar]
- Elmolla ES, Chaudhuri M, Eltoukhy MM. The use of artificial neural network (ANN) for modeling of COD removal from antibiotic aqueous solution by the Fenton process. J Hazard Mater 2010; 179(1-3):127-34. doi: 10.1016/j.jhazmat.2010.02.068 [Crossref] [ Google Scholar]
- Bayat Varkeshi M, Godini K, ParsiMehr M, Vafaee M. Predicting the performance of Gorgan wastewater treatment plant using ANN-GA, CANFIS, and ANN models. Avicenna J Environ Health Eng 2019; 6(2):92-9. doi: 10.34172/ajehe.2019.12 [Crossref] [ Google Scholar]
- Nikpour B, Jalilzadeh Yengejeh R, Takdastan A, Hassani AH, Zazouli MA. The investigation of biological removal of nitrogen and phosphorous from domestic wastewater by inserting anaerobic/anoxic holding tank in the return sludge line of MLE-OSA modified system. J Environ Health Sci Eng 2020; 18(1):1-10. doi: 10.1007/s40201-019-00419-1 [Crossref] [ Google Scholar]
- Kamble S, Singh A, Kazmi A, Starkl M. Environmental and economic performance evaluation of municipal wastewater treatment plants in India: a life cycle approach. Water Sci Technol 2019; 79(6):1102-12. doi: 10.2166/wst.2019.110 [Crossref] [ Google Scholar]
- APHA, AWWA, WEF. Standard Methods for the Examination of Water and Wastewater. 19th ed. Washington, DC: APHA; 1999.
- Afrous A, Yarian Kupaei M, Jalilzadeh R, Derikvand E, Kumar M. Reduction of phosphorus concentration from artificial wastewater in constructed wetland. Bull Environ Pharmacol Life Sci 2013; 2(19):128-9. [ Google Scholar]
- Jalilzadeh Yengejeh R, Davideh K, Baqeri A. Cost/benefit evaluation of wastewater treatment plant types (SBR, MLE, oxidation ditch), case study: Khouzestan, Iran. Bull Environ Pharmacol Life Sci 2014; 4:55-60. [ Google Scholar]
- Oliveira-Esquerre KP, Mori M, Bruns RE. Simulation of an industrial wastewater treatment plant using artificial neural networks and principal components analysis. Braz J Chem Eng 2002; 19(4):365-70. doi: 10.1590/s0104-66322002000400002 [Crossref] [ Google Scholar]
- Tumer AE, Edebali S. An artificial neural network model for wastewater treatment plant of Konya. Int J Intell Syst Appl Eng 2015; 3(4):131-5. doi: 10.18201/ijisae.65358 [Crossref] [ Google Scholar]
- Sakiewicz P, Piotrowski K, Ober J, Karwot J. Innovative artificial neural network approach for integrated biogas – wastewater treatment system modelling: effect of plant operating parameters on process intensification. Renew Sustain Energy Rev 2020; 124:109784. doi: 10.1016/j.rser.2020.109784 [Crossref] [ Google Scholar]
- Salari Z, Zinatizadeh AA, Banaei F, Mesgar M. Dynamic performance analysis and simulation of a full scale activated sludge system treating an industrial wastewater using artificial neural network. Int J Eng 2013; 26(5):465-72. doi: 10.5829/idosi.ije.2013.26.05b.02 [Crossref] [ Google Scholar]
- Musavi-Jahromi SH, Golabi M. Application of artificial neural networks in the river water quality modeling: Karoon River, Iran. J Appl Sci 2008; 8(12):2324-8. doi: 10.3923/jas.2008.2324.2328 [Crossref] [ Google Scholar]
- Talib A, Amat MI. Prediction of chemical oxygen demand in Dondang river using artificial neural network. Int J Inf Educ Technol 2012; 2(3):259-61. doi: 10.7763/ijiet.2012.V2.124 [Crossref] [ Google Scholar]
- Razi MA, Athappilly K. A comparative predictive analysis of neural networks (NNs), nonlinear regression and classification and regression tree (CART) models. Expert Syst Appl 2005; 29(1):65-74. doi: 10.1016/j.eswa.2005.01.006 [Crossref] [ Google Scholar]
- Elnekave M, Ozden Celik S, Tatlier M, Tufekci M. Artificial neural network predictions of up-flow anaerobic sludge blanket (UASB) reactor performance in the treatment of citrus juice wastewater. Pol J Environ Stud 2012; 21(1):49-56. [ Google Scholar]
- Tarke PD, Sarda PR, Sadgir PA. Performance of ANNs for prediction of TDS of Godavari river, India. Int J Eng Res 2016; 5(2):115-8. doi: 10.17950/ijer/v5s2/209 [Crossref] [ Google Scholar]
- Cawley GC, Talbot NL. On over-fitting in model selection and subsequent selection bias in performance evaluation. J Mach Learn Res 2010; 11:2079-107. [ Google Scholar]
- Memarian H, Balasundram SK. Comparison between multi-layer perceptron and radial basis function networks for sediment load estimation in a tropical watershed. J Water Resour Prot 2012; 4(10):870-6. doi: 10.4236/jwarp.2012.410102 [Crossref] [ Google Scholar]
- Hamed MM, Khalafallah MG, Hassanien EA. Prediction of wastewater treatment plant performance using artificial neural networks Environ Model. Softw 2004; 19(10):919-28. doi: 10.1016/j.envsoft.2003.10.005 [Crossref] [ Google Scholar]
- Vijayan A, Mohan GS. Prediction of effluent treatment plant performance in a diary industry using artificial neural network technique. J Civ Environ Eng 2016; 6(6):254. doi: 10.4172/2165-784x.1000254 [Crossref] [ Google Scholar]
- Bekkari N, Zeddouri A. Using artificial neural network for predicting and controlling the effluent chemical oxygen demand in wastewater treatment plant. Manag Environ Qual 2019; 30(3):593-608. doi: 10.1108/meq-04-2018-0084 [Crossref] [ Google Scholar]
- Khatri N, Khatri KK, Sharma A. Artificial neural network modelling of faecal coliform removal in an intermittent cycle extended aeration system-sequential batch reactor based wastewater treatment plant. J Water Process Eng 2020; 37:101477. doi: 10.1016/j.jwpe.2020.101477 [Crossref] [ Google Scholar]
- Nasr MS, Moustafa MAE, Seif HA, El Kobrosy G. Application of Artificial Neural Network (ANN) for the prediction of EL-AGAMY wastewater treatment plant performance-EGYPT. Alex Eng J 2012; 51(1):37-43. doi: 10.1016/j.aej.2012.07.005 [Crossref] [ Google Scholar]
- Ansari FA, Nasr M, Rawat I, Bux F. Artificial neural network and techno-economic estimation with algae-based tertiary wastewater treatment. J Water Process Eng 2021; 40:101761. doi: 10.1016/j.jwpe.2020.101761 [Crossref] [ Google Scholar]
- Wang G, Jia QS, Zhou M, Bi J, Qiao J, Abusorrah A. Artificial neural networks for water quality soft-sensing in wastewater treatment: a review. Artif Intell Rev 2021:1-23. doi: 10.1007/s10462-021-10038-8 [Crossref]