Avicenna J Environ Health Eng. 8(1):17-21.
doi: 10.34172/ajehe.2021.03
Original Article
Changes in Aflatoxin Content During the Processing of Vinegar Obtained From Grape
Ali Heshmati 1  , Freshteh Mehri 1, * , Amir Nili-Ahmadabadi 2, Amin Mousavi Khaneghah 3
Author information:
1Department of Nutrition and Food Safety, School of Medicine, Nutrition Health Research Center, Hamadan University of Medical Sciences, Hamadan, Iran
2Department of Pharmacology and Toxicology, School of Pharmacy, Medicinal Plants and Natural Products Research Center, Hamadan University of Medical Sciences, Hamadan, Iran
3Department of Food Science, Faculty of Food Engineering,University of Campinas (UNICAMP), Rua Monteiro Lobato, 80.Caixa Postal: 6121, Campinas, São Paulo CEP: 13083-862, Brazil
Abstract
Mycotoxins are known to be one of the most important food contaminants that pose potential health risks to humans. This study aimed to investigate the changes in total aflatoxin (TAF) content during grape vinegar production. Different types of aflatoxins including aflatoxin B1 (AFB1 ), B2 (AFB2 ), G1 (AFG1 ), and G2 (AFG2 ) were spiked into washed grape samples in the level of 5 μg/kg. Then grape samples were converted to vinegar. After different stages of vinegar processing including juicing, alcoholic fermentation, acetic acid fermentation, and pasteurization, sampling was performed and the level of each aflatoxin was measured using high performance liquid chromatography with fluorescence detector (HPLC-FD). Among different processing steps, the pasteurization operation had the least effect on the removal of aflatoxin. After juicing, the amount of AFB1, AFB2, AFG1 and AFG2 decreased by 14%, 11.18%, 13.77%, and 18.56%, respectively. Alcoholic fermentation had the greatest effect on the removal of aflatoxin so that it could reduce the levels of AFB1, AFB2, AFG1 and AFG2 by 41.87%, 45.34%, 45.37%, and 46.52%, respectively. Overall, during processing and conversion of grapes to vinegar, the values of AFB1, AFB2, AFG1 and AFG2 were reduced by 76.20%, 71.06%, 69.26%, and 75.85%, respectively. Processing grapes to vinegar can have a significant effect on the aflatoxin reduction.
Keywords: Mycotoxin, Aflatoxin, Vinegar, Processing, Grape
Copyright and License Information
© 2021 The Author(s); Published by Hamadan University of Medical Sciences.
This is an open-access article distributed under the terms of the Creative Commons Attribution License (
http://creativecommons.org/licenses/by/4.0), which permits unrestricted use, distribution, and reproduction in any medium provided the original work is properly cited.
1. Introduction
Grapes are one of the most important garden products in the world. In order to increases their shelf life, it is common to transform them into products such as vinegar and raisins (1). Vinegar is produced in both industrial and traditional forms (2) through alcoholic and acetic fermentation of sugar syrups (3). This product lowers blood sugar, triglycerides, and blood lipids (4,5). Consumption of 15 mL of vinegar (750 mg of acetic acid) during the day can be effective in improving lifestyle-related diseases, including high blood pressure and obesity (6). It seems that the therapeutic effects of vinegar may be related to the content of acetic acid and some other components (3,7). Vinegar has anti-bacterial, anti-viral, anti-fungal, as well as anti-parasitic effects since it stimulates the immune system (7).
Molds are the most agent of spoilage of fruits such as grape that contain high level of sugar (8). They grow under suitable environmental conditions such as high oxygen, sufficient temperature and humidity (7). Molds reduce the food quality and threaten human health by producing secondary metabolites (i.e. mycotoxins) (9). More than 300 mycotoxins have already been known. The mycotoxin contamination is one of the major food safety concerns. Aflatoxins are the most toxic mycotoxin (10), and are produced by some species of Aspergillus genus, including A. flavus, A. parasiticus, and A. nomius during their growth on foods and feeds (11). Aflatoxins cause tissue necrosis, fetal defects, cirrhosis, and liver cancer (11); and possess nephrotoxic, teratogenic, and immunosuppressive properties (12). Aflatoxins are classified by the International Agency of Research on Cancer (IARC) as group 1 (13,14). Therefore, the controlling of aflatoxin level in food is one of the most important problems in food safety in different countries.
Aflatoxin contamination has been reported in grapes and related products (15-17). Molds which are in the soil surface of the vineyard contaminate grapes during the harvest. The damage to grape during harvesting and their storage at high temperatures accelerate the molds growth – including aflatoxin-producing ones, and cause the occurrence of aflatoxin in this product (18).
There is no legal limit for aflatoxin in vinegar. Based on the EU standard, the allowable limit of aflatoxin in grapes and its products is 2 µg/kg (19). The previous studies have shown the processing applied for grape products may influence aflatoxin. For example, Heshmati et al have found that different stages of pekmez have a significant effect on the aflatoxins removal, and cause a significant reduction of AFB1, AFB2, AFG1, and AFG2 until 60.4, 76.7, 76.3 and 86.7%, respectively (18). There is no available information on the fate of the aflatoxins in grape vinegar. Therefore, this study aimed to investigate the changes of aflatoxins during the vinegar production from grapes.
2. Materials and Methods
The species of grape utilized for vinegar production was Asgari grapes that was harvested from vineyards located in Malayer city, Hamadan, Iran. The grape samples were transferred to the laboratory under suitable conditions. All chemicals were purchased from Merck (Darmstate, Germany) unless otherwise stated. The standard of Aflatoxin (B1, B2, G1, and G2) was obtained from Farogh laboratory (Tehran, Iran). Saccharomyces cerevisiae and vinegar containing Acetobacter aceti were purchased from Razavi yeast (Mashhad, Iran) and Khosh Khorak Sina (Hamadan, Iran) companies, respectively.
2.1. Vinegar Production
In this study, first, three grape samples weighing 1 kg were prepared. Each sample was converted separately into vinegar after the following steps, and its aflatoxin concentration and changes were determined. The mean of results from three samples was reported.
Five microliters of aflatoxin stock solution (1000 µ/L) was sprayed on each sample. Aflatoxin spiked grape samples were washed with tap water for 30 seconds. Then grape juice was extracted by a juicer apparatus and the grape skins and seeds were removed. The fermentation of grape sugars and their transformation into vinegar were performed after two fermentations (i.e. alcoholic fermentation and acetic acid fermentation). As for alcoholic fermentation, Saccharomyces cerevisiae powder (1%) was added into grape juice and placed at room temperature for 20 days. Afterward, vinegar containing A. aceti (2%) was added and the samples were placed at room temperature for 20 days (4). Finally, the prepared vinegar was pasteurized at 70°C for 25 min.
2.2. Extraction, Purification and Quantification of Aflatoxins
Aflatoxins extraction and the analysis were carried out in a similar fashion to previous study (18). Pure water (40 mL) methanol (160 mL) and sodium chloride (5 g) were added to grape and/or vinegar samples (20 g) and, then, the samples were mixed and filtered through by passing through Whatman filter paper. Next, 130 mL of phosphate buffer solution (PBS) was added to 20 mL of the filtered solution and passed through immunoaffinity column. Methanol (1.5 mL) was used for Aflatoxins removal from immunoaffinity column. Finally, 50 μL of methanol containing aflatoxins was injected into the high-performance liquid chromatography (HPLC) system (20).
2.3. Apparatus
Aflatoxins in samples were quantitatively analyzed with a HPLC system (waters company, USA) equipped with C18 column (Length 250 mm, inner diameter 4.6 mm, and particle size 5 microns), autosampler, as well as fluorescent detector. The water/ methanol/ acetonitrile solution (6:3:2) was employed for aflatoxins analysis as a mobile phase. The flow rate and excitation/emission wavelength were set at 1 mL/min and 365/333 nm, respectively.
2.4. Method Validation
For each aflatoxin (i.e. B1, B2, G1, and G2), the limit of detection (LOD) and the limit of quantification (LOQ) were calculated using the ratio of S/N=3 and S/N=10, respectively. Additionally, the recovery experiments were conducted by spiking 0.5, 2.5, and 5 μg/mL of each aflatoxin into samples, and each experiment was repeated three times.
2.5. Statistical Analysis
Since this study was an intervention and experimental study, all experiments were repeated three times. SPSS 20.01 was used for performing statistical analysis, and ANOVA and Tukey post hoc test were used to compare aflatoxin reduction between different treatments. The P value <0.05 was considered as a significant difference.
3. Results and Discussion
3.1. Evaluation of Method of Validation
The line equation, regression coefficient, LOD, and LOQ for AFB1, AFB2, AFG1 and AFG2 in grape and vinegar samples are shown in Tables 1 and 2. In grape samples, LOQ values for AFB1, AFB2, AFG1, and AFG2 were 0.08, 0.09, 0.07, and 0.08 (µg/kg), respectively. While the LOQ values of these toxins in vinegar were 0.07, 0.03, 0.010, and 0.08 (µg/kg), respectively. According to the results obtained, the recovery percentage for different levels spiked to the blank vinegar sample was 95.96%–98.63% for AFB1, 94.27%-92.18%, for AFB2, 90.38%-89.87% for AFG1, and 87.30%-95.84% for AFG2. The standard deviation percentages obtained for all samples were less than 20%. Based on the obtained data, the determined method for the detection of aflatoxin had a good performance. The rate of recovery for this study was similar to previous studies on different samples of berries, dates, and figs (18,21). The data obtained during validation of analysis method used in the current study was confirmed after they were compared with AOAC, Codex Alimentarius, and European Commission guidelines (11,22).
Table 1.
Dynamics range, line equation and regression coefficient for different types of aflatoxins in grape and vinegar samples
|
Sample
|
Aflatoxins
|
Linearity
range (μg/kg)
|
Calibration curve equation
|
Regression coefficient
(R
2
)
|
| Grape |
AFB1 |
0.2-22 |
Y = 114599x+15760 |
0.993 |
| AFB2 |
0.4-20 |
Y = 134519x+19820 |
0.995 |
| AFG1 |
0.6-10 |
Y = 103392x+13540 |
0.997 |
| AFG2 |
0.5-20 |
Y = 124231x+11160 |
0.996 |
| Vinegar |
AFB1 |
0.2-22 |
Y = 171566x+13210 |
0.998 |
| AFB2 |
0.4-20 |
Y = 143211x+14210 |
0.998 |
| AFG1 |
0.6-10 |
Y = 182291x+19540 |
0.999 |
| AFG2 |
0.5-20 |
Y = 204788x+13760 |
0.999 |
Table 2.
Validation results of aflatoxins
|
Sample
|
Aflatoxins
|
Recovery
%
|
Relative standard deviation %
|
(LOD)
(μg/kg)
|
(LOQ)
(μg/kg)
|
| Grape |
AFB1 |
97.92-100.12 |
8.3-12.3 |
0.08 |
0.25 |
| AFB2 |
95.92-90.14 |
9.17-12.72 |
0.09 |
0.28 |
| AFG1 |
89.12-94.13 |
12.1-15.12 |
0.07 |
0.23 |
| AFG2 |
92.02-94.12 |
4.32-5.35 |
0.08 |
0.25 |
| Vinegar |
AFB1 |
95.78-97.12 |
4.23-8.54 |
0.02 |
0.07 |
| AFB2 |
92.12-94.12 |
10.11-14.12 |
0.01 |
0.03 |
| AFG1 |
89.76-90.56 |
9.24-11.23 |
0.03 |
0.10 |
| AFG2 |
95.45-98.34 |
7.23-13.21 |
0.02 |
0.08 |
LOD: Limit of detection
LOQ: Limit of quantification
3.2. The Effect of Different Stages of Vinegar Production on Aflatoxin
The aflatoxin decreasing percentage during each stage of grape vinegar processing is presented in Table 3 and Figure 1. The results showed that all different steps were able to reduce the concentrations of AFB1, AFB2, AFG1, AFG2, and TAF. Furthermore, a significant difference in aflatoxin concentration was detected in different stages (P<0.05). According to the results, the juicing stage could significantly reduce the concentration of aflatoxins in fresh grapes. Concentrations of AFB1, AFB2, AFG1 and AFG2 and TAF reduced during juicing 14%, 11.18%, 13.77%. and 18.56%, respectively. Although there is no published information on the impact of juicing stage on aflatoxin concentrations during vinegar production, some studies have shown the juicing role in the fate of aflatoxin in other products. For example, the reduction range of AFB1, AFB2, AFG1, and AFG2 during grape juicing before pekmez production was reported as being 6.1–11.1%, 4.6–27.3%, 6.2–17.1%, and 14.0–28.0%, respectively (18,23). Aflatoxin reduction during juicing could be due to their binding to removed grape skin and seed 6.1–11.1% (8.2%), 4.6–27.3% (14.8%), 6.2–17.1% (12.4%), and 14.0–28.0% (22.7%).
Table 3.
Changes in the amount of aflatoxin during different stages of vinegar production
|
Stages of vinegar production
|
AFB
1
|
AFB
2
|
AFG
1
|
AFG
2
|
TAF
*
|
|
| Fresh grape |
5.00± 0.02a |
5.01± 0.01a |
5.01± 0.01a |
5.01± 0.02a |
20.02± 0.03 a |
| Juicing |
4.31± 0.23 (14.00)b |
4.45± 0.24 (11.18)b |
4.32± 0.22 (13.77)b |
4.08± 0.28 (18.56)b |
17.15± 1.18 (14.34)b |
| Alcoholic fermentation |
2.30± 0.13 (54.00)c |
2.38± 0.14 (52.50)c |
2.36± 0.13 (52.89)c |
2.23± 0.17 (55.49)c |
9.97± 0.69 (50.20)c |
| Acetic fermentation |
1.32± 0.08(73.60) d |
1.56± 0.11(68.86) d |
1.58± 0.11(68.46) d |
1.36± 0.11(72.85) d |
5.82± 0.49(70.93) d |
| Pasteurization |
1.19± 0.11 (76.20)e |
1.45± 0.12 (71.06)e |
1.54± 0.09 (69.26)e |
1.21± 0.07 (75.85)e |
5.39± 0.32 (73.08)e |
* Total aflatoxin
The numbers in parentheses indicate the percentage change compared to fresh grapes.
Different uppercase letters inside the column show a significant difference ( P < 0.05).
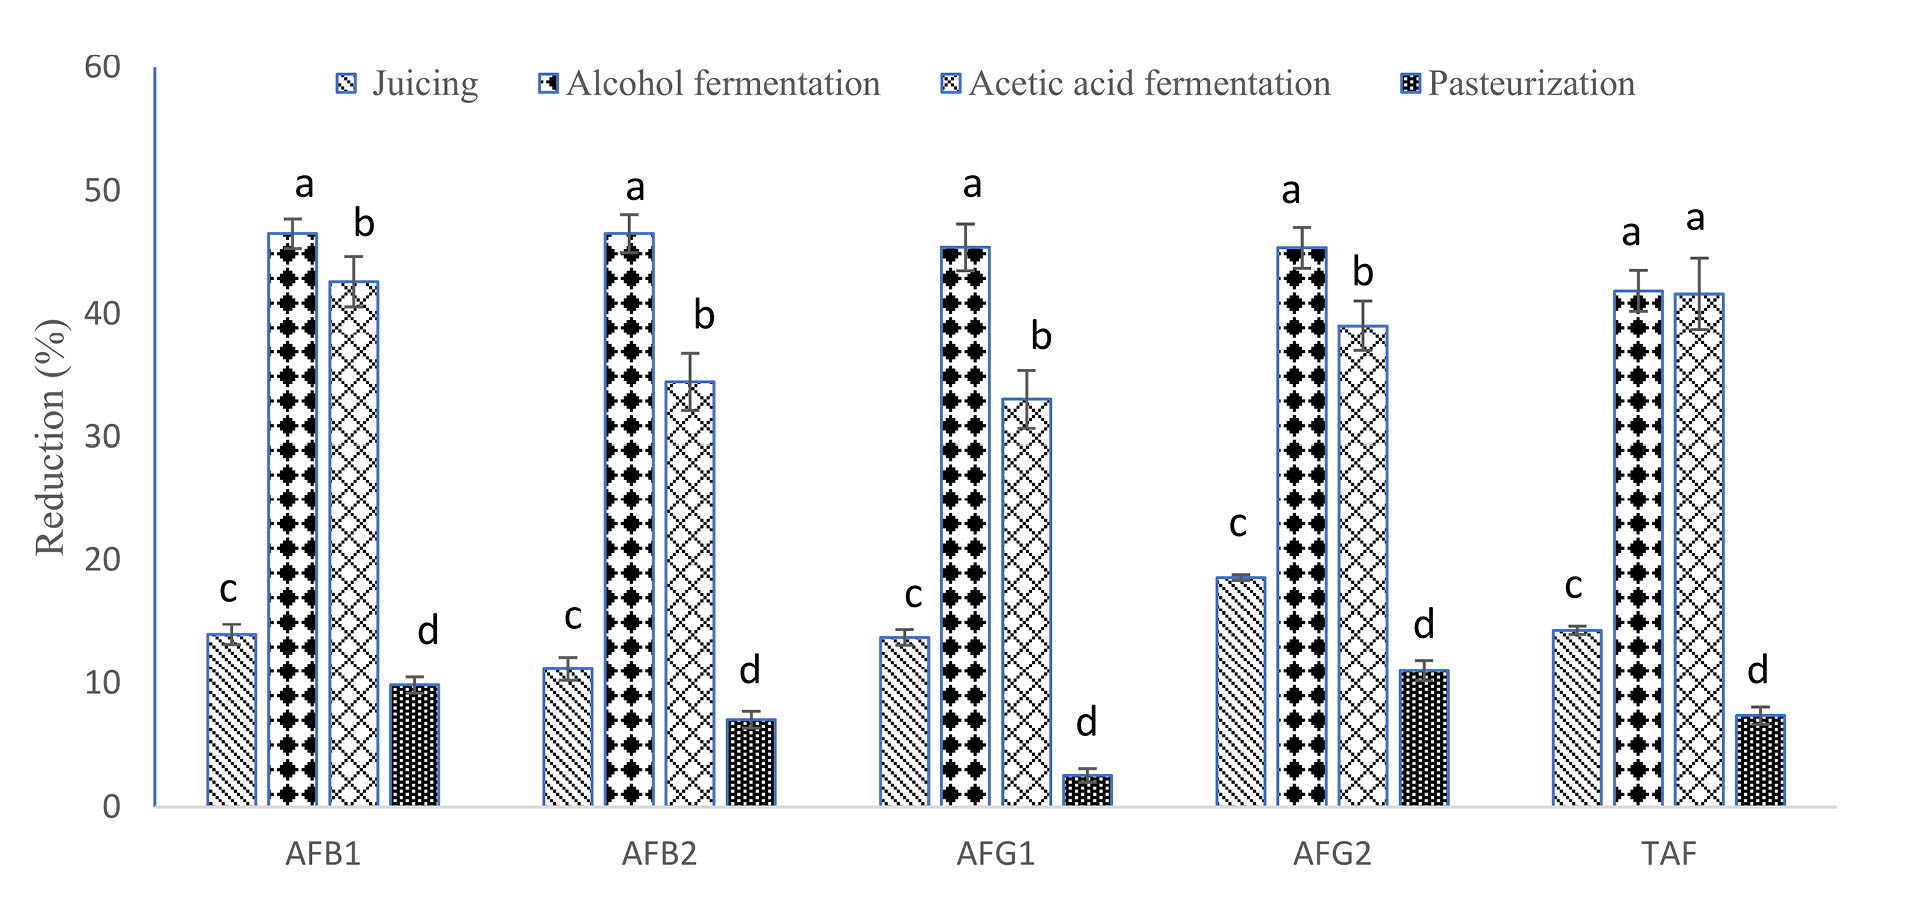
Figure 1.
Aflatoxins reduction after different steps of vinegar processing Different letters on the column show a significant difference ( P < 0.05).
.
Aflatoxins reduction after different steps of vinegar processing Different letters on the column show a significant difference ( P < 0.05).
According to the findings from the present study, alcoholic fermentation had the best decreasing effect on the aflatoxins during vinegar processing. As shown in Figure 1, alcoholic fermentation stage reduced AFB1, AFB2, AFG1, and AFG2 levels 46.51%, 46.52%, 45.37% and 45.34%, respectively, during vinegar processing. There is no published research on the role of alcoholic fermentation on aflatoxin reduction during vinegar production. However, effect of alcoholic fermentation on the aflatoxins reduction has been investigated in other food products. A study performed by Inoue et al, for example, indicated that the process of alcoholic fermentation could reduce 30% of aflatoxins concentration during wine production, which was less than our results (10). Moreover, the effect of alcoholic fermentation on the removal of other mycotoxins, including ochratoxin, has already been reported (12,24,25). The physical interaction of mycotoxins with the yeast structure can be one of the most effective factors in mycotoxins reduction mechanism in other food products. Several studies have shown that mycotoxins attach to the yeast wall and are removed during the yeast removal from the mycotoxin products.
The reduction value during acetic fermentation stage for AFB1, AFB2, AFG1, and AFG2 was 42.16%, 34.45, 33.05%, and 39.01%, respectively (Figure 1). According to previous studies, cell wall of acetic acid bacteria such as Acetobacter, Gluconacetobacter, Acidomonas, Asaia, Kozakia, Swaminathania, and Saccharibacter is bonded to the mycotoxin and can decrease them (12,26). The effect of these bacteria on mycotoxin levels and the removal of these compounds have been reported in other products such as wine (12). Abrunhosa et al showed that acetic acid fermentation reduced mycotoxin levels in grapes (27). The acetic bacteria could convert mycotoxins to inactive toxic species (13).
Pasteurization had the least effect on aflatoxin reduction during the vinegar production process. The reduction value for AFB1, AFB2, AFG1 and AFG2 during pasteurization stage was reported as 9.85%, 7.05%, 2.53%, and 11.03%, respectively. Contrary to these results, higher reduction was reported for these mycotoxins during heating of pekmez. Heshmati et al (18) found that mean reduction of AFB1, AFB2, AFG1 and AFG2 of pekmez boiling were 14.8%, 34.6%, 15.1%, and 42.9%, respectively. The discrepancy was associated with different temperature and heating time.
4. Conclusion
The present study examined the effect of different stages of vinegar production on aflatoxin concentrations. The study results showed that each of the different stages could significantly reduce the concentration of aflatoxin. Among the different processing steps, the highest and lowest of aflatoxins reduction was obtained after pasteurization and alcoholic fermentation, respectively. The reduction value of AFB1, AFB2, AFG1, and AFG2 during vinegar was 76.20, 71.06, 69.26, and 75.85%, respectively. These findings indicated that the process concerning the transformation of grape into vinegar could have a significant effect on aflatoxin level.
Conflict of Interests
The authors declare that they have no conflict of interests.
Acknowledgments
This study was financially supported by Vice-Chancellor of Research and Technology of Hamadan University of Medical Sciences (Grant number: 9808216016).
References
- Koshteh K, Abbas A. Strategy & limitations to improve grapes marketing efficiency (a case study of S & B, Iran). Acta Hortic 2004; 655:347-55. doi: 10.17660/ActaHortic.2004.655.42 [Crossref] [ Google Scholar]
- Tavakolipour H, Kalbasi Ashtari A. Determination of rheological properties of grape molasses. Iran J Food Sci Technol 2013; 10(40):129-37. [ Google Scholar]
- Budak NH, Aykin E, Seydim AC, Greene AK, Guzel-Seydim ZB. Functional properties of vinegar. J Food Sci 2014; 79(5):R757-64. doi: 10.1111/1750-3841.12434 [Crossref] [ Google Scholar]
- Tosun İ, Şule Üstün N. Nonenzymic browning during storage of white hard grape pekmez (Zile pekmezi). Food Chem 2003; 80(4):441-3. doi: 10.1016/s0308-8146(02)00196-6 [Crossref] [ Google Scholar]
- Şule Üstün N, Tosun İ. Pekmezlerin bileşimi. Gıda 1997; 22(6):417-23. [ Google Scholar]
- Tesfaye W, Morales ML, Garcı́a-Parrilla MC, Troncoso AM. Wine vinegar: technology, authenticity and quality evaluation. Trends Food Sci Technol 2002; 13(1):12-21. doi: 10.1016/s0924-2244(02)00023-7 [Crossref] [ Google Scholar]
- Samad A, Azlan A, Ismail A. Therapeutic effects of vinegar: a review. Curr Opin Food Sci 2016; 8:56-61. doi: 10.1016/j.cofs.2016.03.001 [Crossref] [ Google Scholar]
- Asadi S, Maram ZR, Kooshk F. Evaluation of microbial contamination of pastry cream in Arak city of Iran. J Food Safe Hyg 2015; 1(1):26-9. [ Google Scholar]
- Wu W, Zhu Z, Li B, Liu Z, Jia L, Zuo L. A direct determination of AFBs in vinegar by aptamer-based surface plasmon resonance biosensor. Toxicon 2018; 146:24-30. doi: 10.1016/j.toxicon.2018.03.006 [Crossref] [ Google Scholar]
- Inoue T, Nagatomi Y, Uyama A, Mochizuki N. Fate of mycotoxins during beer brewing and fermentation. Biosci Biotechnol Biochem 2013; 77(7):1410-5. doi: 10.1271/bbb.130027 [Crossref] [ Google Scholar]
- Mehri F, Esfahani M, Heshmati A, Jenabi E, Khazaei S. The prevalence of ochratoxin A in dried grapes and grape-derived products: a systematic review and meta-analysis. Toxin Rev. 2020:1-10. 10.1080/15569543.2020.1845739.
- Grazioli B, Fumi MD, Silva A. The role of processing on ochratoxin A content in Italian must and wine: a study on naturally contaminated grapes. Int J Food Microbiol 2006; 111 Suppl 1:S93-6. doi: 10.1016/j.ijfoodmicro.2006.01.045 [Crossref] [ Google Scholar]
- Bolechová M, Benešová K, Běláková S, Čáslavský J, Pospíchalová M, Mikulíková R. Determination of seventeen mycotoxins in barley and malt in the Czech Republic. Food Control 2015; 47:108-13. doi: 10.1016/j.foodcont.2014.06.045 [Crossref] [ Google Scholar]
- Eaton DL, Ramsdell S, Neal GE, Groopman JD. Biotransformation of aflatoxins. In: Eaton DL, Groopman JD, eds. The Toxicology of Aflatoxins: Human Health, Veterinary and Agricultural Significance. Academic Press; 1993. p. 45-72.
- Kumar S, Kocher GS, Bakshi DK. Fermentative production of vinegar from grapes and guava using adsorbed cells of Acetobacter aceti. Int J Curr Microbiol Appl Sci 2017; 6(5):2005-12. doi: 10.20546/ijcmas.2017.605.224 [Crossref] [ Google Scholar]
- Monaci L, Tantillo G, Palmisano F. Determination of ochratoxin A in pig tissues by liquid-liquid extraction and clean-up and high-performance liquid chromatography. Anal Bioanal Chem 2004; 378(7):1777-82. doi: 10.1007/s00216-004-2497-1 [Crossref] [ Google Scholar]
- Koirala P, Kumar S, Yadav BK, Premarajan KC. Occurrence of aflatoxin in some of the food and feed in Nepal. Indian J Med Sci 2005; 59(8):331-6. doi: 10.4103/0019-5359.16649 [Crossref] [ Google Scholar]
- Heshmati A, Ghadimi S, Ranjbar A, Mousavi Khaneghah A. Changes in aflatoxins content during processing of pekmez as a traditional product of grape. LWT 2019; 103:178-85. doi: 10.1016/j.lwt.2019.01.001 [Crossref] [ Google Scholar]
- Ward M, Smith G, Tran Q. This Report Contains Assessments of Commodity and Trade Issues Made by USDA Staff and Not Necessarily Statements of Official US Government Policy. Washington, DC: USDA Foreign Agricultural Service; 2016. p. 11.
- ISIRI. Institute of Standards and Industrial Research of Iran. Food & feed - mycotoxins- maximum tolerated level. Standard No. 5925. 2010.
- Heshmati A, Zohrevand T, Mousavi Khaneghah A, Mozaffari Nejad AS, Sant’Ana AS. Co-occurrence of aflatoxins and ochratoxin A in dried fruits in Iran: dietary exposure risk assessment. Food Chem Toxicol 2017; 106(Pt A):202-8. doi: 10.1016/j.fct.2017.05.046 [Crossref] [ Google Scholar]
- AOAC International. AOAC Guidelines for Single Laboratory Validation of Chemical Methods for Dietary Supplements and Botanicals. Gaithersburg, MD: AOAC International; 2002.
- Heshmati A, Ghadimi S, Ranjbar A, Mousavi Khaneghah A. Assessment of processing impacts and type of clarifier on the concentration of ochratoxin A in pekmez as a conventional grape-based product. LWT 2020; 119:108882. doi: 10.1016/j.lwt.2019.108882 [Crossref] [ Google Scholar]
- Leong SL, Hocking AD, Pitt JI, Kazi BA, Emmett RW, Scott ES. Australian research on ochratoxigenic fungi and ochratoxin A. Int J Food Microbiol 2006; 111 Suppl 1:S10-7. doi: 10.1016/j.ijfoodmicro.2006.02.005 [Crossref] [ Google Scholar]
- Anli RE, Vural N, Bayram M. Removal of ochratoxin A (OTA) from naturally contaminated wines during the vinification process. J Inst Brew 2011; 117(3):456-61. doi: 10.1002/j.2050-0416.2011.tb00493.x [Crossref] [ Google Scholar]
- Cleenwerck I, Vandemeulebroecke K, Janssens D, Swings J. Re-examination of the genus Acetobacter, with descriptions of Acetobacter cerevisiae sp nov and Acetobacter malorum sp. nov. Int J Syst Evol Microbiol 2002; 52(Pt 5):1551-8. doi: 10.1099/00207713-52-5-1551 [Crossref] [ Google Scholar]
- Abrunhosa L, Fernandes A, Venâncio A. Ochratoxin A Removal During the Main Steps of Wine Making. Viseu: Instituto Superior Politécnico; 2005.