Avicenna J Environ Health Eng. 6(2):106-112.
doi: 10.34172/ajehe.2019.14
Original Article
Application of Chitosan and Activated Carbon Nano-composite in Removal of Nitrite, Phosphate, and Ammonia From Aquaculture Wastewater
Hassan Rezaei *  , Saeedeh Rastegar , Sanaz Naseri
Author information:
Department of Environmental Sciences, Faculty of Fisheries and Environmental Sciences, Gorgan University of Agricultural Sciences and Natural Recourses, Environmental Sciences,Gorgan, Iran.
*Correspondence to Hasan Rezaei, Department of Environment, Faculty of Fisheries and Environmental Sciences, Gorgan University of Agricultural Sciences and Natural Recourses, Gorgan, Iran, Tel/Fax: +981732427040 Email:
hassanrezaei@gau.ac.ir
Abstract
Developing an adsorbent with natural components is one of the effective methods to reduce the amount of wastewater pollutants. Wastewater reuse can improve the quality of water prior to entering the natural environment. The aim of this study was to evaluate the efficiency of chitosan nano-composite and activated carbon adsorbent in the removal of nitrite, phosphate, and ammonia pollutants from fish farms of Aq-Qala. To prepare the adsorbents, the shrimp shells were converted to nano-chitosan. The date palm kernel was prepared and activated with oxalic acid in pyrolysis furnace by injecting nitrogen gas into activated carbon, then, the nano-composite was prepared from nanochitosan and activated carbon. A field-laboratory study was conducted during the winter of 2018, and then, batches of synthesized nano-composite were investigated and the effects of pH, initial effluent concentration, and adsorption time were investigated. The experiments were performed in the pH range of 5-8, effluent concentration of 25-100 mg/L, and contact time of 15-90 minutes. The results showed that at optimum conditions (pH of 7, effluent concentration of 50 mg/L, and contact time of 60 minutes), the highest removal percentage and adsorption capacity for nitrite, phosphate, and ammonia contaminants were 99.98%, 99.77%, and 65.65%, and 6.65, 6.14, and 7.32 mg/g, respectively. Due to the high removal percentage (99.98%) of the chitosan and activated carbon nano-composite, the adsorbent was highly capable of removing pollutants (nitrite, phosphate, and ammonia).
Keywords: Adsorbent, Activated carbon, Nano-composite, Wastewater, Chitosan
Copyright and License Information
© 2019 The Author(s); Published by Hamadan University of Medical Sciences.
This is an open-access article distributed under the terms of the Creative Commons Attribution License (
http://creativecommons.org/licenses/by/4.0), which permits unrestricted use, distribution, and reproduction in any medium provided the original work is properly cited.
1. Introduction
Due to the increasing water requirement, determination of its pollutants and optimum use of available water resources is essential. Wastewater is the result of human activities in various urban, agricultural, or industrial areas. Nowadays, there is a great emphasis on collecting and removing contaminants from different types of effluents due to the high ability of effluents to contaminate food sources and water and create favorable conditions for the growth of various pathogenic microorganisms (1). The effluent from fish farming activities is associated with the use of different fertilizers, foods with different compounds, types of drugs and toxins, each having a different impact on aquatic ecosystem, human life, and environment (2). Phosphates and nitrogenous compounds, especially ammonia and nitrite, can be harmful. Phosphate and ammonia in small amounts cause physiological and morphological changes as well as aquatic losses (3). Nitrite is also produced in aquaculture ponds by the nitrification process of ammonia and causes problems such as brown blood disease in fish and gastric and colon cancer in humans (4). Phosphate and nitrate, on the other hand, cause eutrophication in aquatic environments (5). Therefore, optimal management of pond effluents and fisheries requires information on the quantitative and qualitative characteristics of river water and its efficacy.
Different systems and methods have been designed to treat wastewater, each with its own advantages and disadvantages (6). One way to overcome the disadvantages of these methods is to use the biological process of adsorption in the efficient treatment of effluents. This adsorption is classified into physical and chemical adsorption according to the nature of the bonds between the adsorbed cations and the adsorbent cation (7).
One of the best techniques for the adsorption process is the use of natural adsorbents. Date kernels are natural organic sorbents that can be used as low-cost agricultural waste and can be used to remove various pollutants (4). Other natural adsorbents include chitin and chitosan, which are among the natural minerals. Chitosan is a copolymer produced by N-deacetylation of chitin from crab and shrimp shells (7). It is discarded as an outer shell of molluscs and crustaceans and is used in various ways to eliminate pollutants (8). A composite is made from the combination of two adsorbents to form a chemical bond. In recent years, the use of nano-composite as adsorbents has received much attention. In a study by Rajeswari and Pius on nitrate removal using chitosan/PEG and chitosan/PVA polymer composites, it was shown that polyethylene glycol/chitosan and polyethyl alcohol/chitosan are useful in removing nitrate from aqueous solution (9). In a study by Park et al on phosphate removal using a chitosan titanium dioxide composite from aqueous solution, it was shown that this adsorbent composite was useful in the removal of phosphate was from aqueous solution (4). Using chitosan composite to remove nitrate and phosphate from aqueous solution, it was indicated that this nano-composite had high efficiency in the removal of some pollutants such as nitrate and phosphate (7). The main reasons for using different materials for waste treatments were their efficiency, non-use of traditional adsorbents, and the discovery of better material properties. The results of this study indicated that chitosan can be used as an economical adsorbent for the absorption of heavy metals. However, the high cost is a very important limiting factor. Many researchers around the world are working to make the use of chitosan affordable in the absorption of heavy metals, which can be achieved if the scale of industrial production is reached.
Therefore, according to previous studies, chitosan nano-composite is one of the most effective adsorbents in removing pollutants from aquatic environments. In this study, chitosan and activated carbon nano-composite were prepared to remove nitrite, phosphate, and ammonia. Physical and structural properties of the synthesized adsorbent were characterized using field emission scanning electron microscopy (FESEM) and Fourier-transform infrared spectroscopy (FTIR) techniques. The effect of pH, initial concentration, and time were investigated on the uptake of nitrite, phosphate, and ammonia pollutants from real wastewater samples.
2. Materials and Methods
2.1. Materials
Chitosan nano-composite extracted from shrimp shells with activated carbon derived from date kernels was studied in a batch scale to improve the effluent treatment of fish farms. In order to study the qualitative parameters of effluent from fish farms of Aq-Qala, effluent samples were taken and transferred to water and wastewater organization of Golestan province. To prepare solutions containing nitrite, phosphate, and ammonia, 25%, 50%, 75%, 100% effluent concentrations were poured into a 1000 mL volumetric flask, diluted with deionized distilled water and brought to volume. To adjust the pH, 0.1 M NaOH and HNO3 solutions were used, which were purchased from Merck, Germany.
2.2. Adsorbent Preparation
Three percent nano-chitosan gel with chemical formula of (C6H11NO4)n, average diameter of 40 nm, de-acetylated degree of 80 to 85 nm, and molecular weight of 5000-100 000 was prepared by Nano Novin Polymer Co, Iran. To prepare activated carbon from palm kernel, 200 g of palm kernels was dried at ambient temperature and ground by grinding mill. Then, 20 g of palm kernel was dissolved in 0.2 mM oxalic acid and activated to convert carbon to nitrogen gas in a pyrolysis furnace for 4 hours. Finally, it was washed several times with distilled water and incubated at 70°C for 12 hours.
2.3. Preparation of Nano-composite
In order to form chitosan nano-composite, first, 20 g of date palm kernel ash was dissolved in 0.2 mM oxalic acid for 4 hours. Then, it was washed several times with distilled water to reach a neutral pH. Afterwards, it was placed in an oven at 70°C and dried for 12 hours to obtain treated ash. Then, a certain amount of nano-chitosan was dissolved in a solution of 0.2 mM oxalic acid solution at 45-50°C. Then, 20 g of activated carbon from the palm kernel with oxalic acid was gently added to the nano-chitosan gel. Then, it was placed on a hot plate at 40°C for 12 hours. The composite was immersed in 0.7 M NaOH solution and finally, it was washed several times with distilled water to neutralize (10).
2.4. Methods
Experiments were carried out in batch system under the same conditions. To do so, one of the parameters (pH, contact time, and effluent concentration) and other parameters (adsorbent dose) were kept constant at each stage. At least three replicates were performed for each experiment. Experiments were performed in the pH range of 5 to 8, contaminant concentration of 25 to 100 mg/L, contact time of 15 to 90 minutes. First, the optimum pH with the optimum adsorption efficiency was determined, and then, all experiments were performed at the pH obtained. The optimum effluent concentration was then determined after reaching the equilibrium state. After obtaining the optimum values of the expressed parameters, the parameter of the contact duration was also investigated by adjusting the conditions based on them. The experiment was performed by pouring 100 mg/L of the desired concentration into 300 mL, adjusting the pH of the solution, adding a certain amount of nano-composite to the effluent at ambient temperature. The stirrer was subjected to stirring for a specified period of time. The solution was then centrifuged for 5 minutes at 4000 rpm. Finally, the residual effluent concentration in the solution was read using a photometer 7100. The effect of each parameter was evaluated by changing the desired parameter and taking into account the other parameters mentioned. The amount of nitrite, phosphate, and ammonia in equilibrium state was calculated through equations 1 and 2 (11).
In this formula, qe is the amount of metal ions adsorbed per unit mass of adsorbent in mg/g, Co is initial concentration of metal before adsorption in mg/L, Ce is concentration of metal remaining in solution after equilibrium adsorption in mg/g, v is the volume of soluble volume in liters, and M is the absorbent mass in g (10).
FESEM was used for imaging nanoparticle morphology, appearance, particle shape determination, porosity and particle size distribution. FESEM (MIRA 3) was used to determine the characteristics and size distribution of nano-composite. FT-IR (WQF-520) was applied for obtaining spectra and identifying molecules and functional groups.
3. Results and Discussion
3.1. Examination of the Structural Properties of Prepared Nanoparticles
3.1.1. Field Emission Scanning Electron Microscopy (FESEM)
Figs. 1a and 1b show the nanoparticle dimensions of about 20 to 25 nm. Pores and voids (nitrite, ammonia, and phosphate) are easily visible. As shown in Fig. 1, deep and irregular cavities are created which reflect the increase of the specific adsorbent level, the heterogeneous energy distribution on the adsorbent surface and the better absorption of the pollutants. Scanning electron microscopy was used to observe the physical shape of the surface of nano-absorbent samples. The obtained images show the pre- and post-absorption phases, respectively. The pores and pores in the pre-adsorbed form of the nano-composite indicate vacancies that can absorb phosphate, nitrate, and ammonia ions. According to the images, nano-chitosan composites can absorb more pollutants due to their specific surface area. As can be seen in the pictures after the adsorption, many active sites are still available which are not yet filled, which means that the adsorbent can be reused several times in the continuous adsorption system without reduction of absorption efficiency.
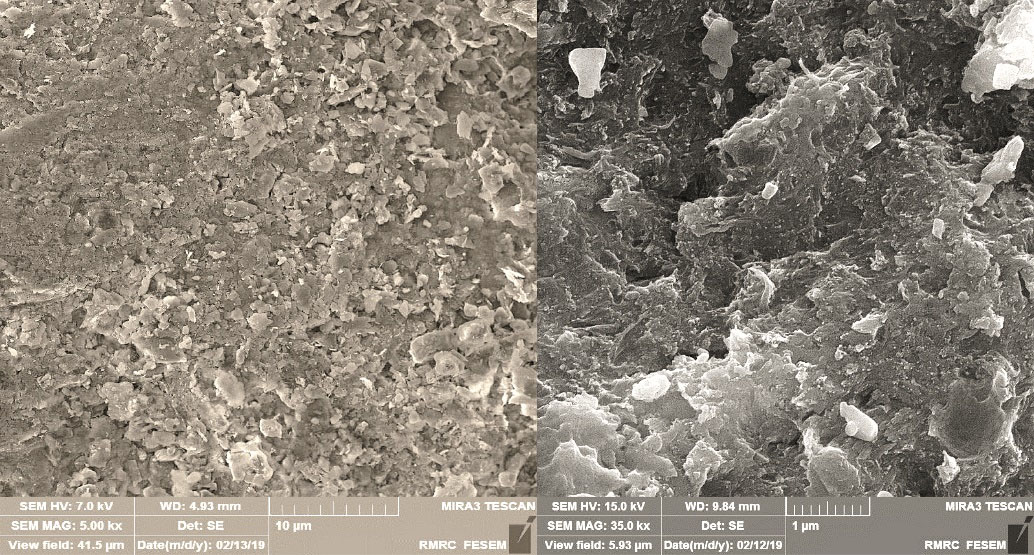
Figure 1.
FE-SEM Images of (a) Chitosan-activated Carbon Nano-composite Before Adsorption, (b) After Adsorption
.
FE-SEM Images of (a) Chitosan-activated Carbon Nano-composite Before Adsorption, (b) After Adsorption
3.1.2. Fourier-Transform Infrared Spectroscopy
FTIR spectra of chitosan nano-composite before and after pollutant adsorption were prepared. Table 1 shows the peaks of the nano-composite before and after the adsorption. In the FTIR spectrum before contaminant adsorption, from the left, the broad and wide peak in the 3000-3600 cm-1 (3431.40 cm-1) region of the OH- (hydroxyl) functional group or NH-. The peak of the 1584.77 cm-1 region belongs to the C = O functional group. The next weak band in the region of 1377.29 cm-1 probably belongs to the c-o functional group (Table 1).
Table 1.
FTIR Spectra of Nano-composite
|
Wave number (cm-1)
|
| 3431.4 |
1584.77 |
1377.29 |
1188.23 |
1080.39 |
3.1.3. Effect of pH
The pH changes may affect the adsorption sites present on the adsorbent surface (Figs. 2 and 3). The effect of pH in the range of 5 to 8 on nitrite, phosphate and ammonia uptake by chitosan nano-composite and date kernel was investigated under initial concentration of 100 mg/L, adsorbent dosage of 1 g and contact time of 60 minutes. In this adsorbent, the highest percentage at pH 7 for phosphate, ammonia, and nitrite were about 99.77%, 99.98%, and 99.98%, and adsorption capacity values were 4.75, 6.14, and 5.97 mg/g,respectively. pH is one of the important factors affecting the absorption of pollutants. This parameter can change the adsorbent and adsorbent properties and affect the adsorbent load in the adsorption process (11). In fact, the purpose of investigating the effects of different pH values is to determine the optimum pH and it is one of the most important parameters for the removal of pollutants by the adsorbent. Physicochemical interactions affect the adsorption process and the electrostatic effect of ion binding is similar to the functional groups which are crucial in the presence of contaminant removal reactions (12).
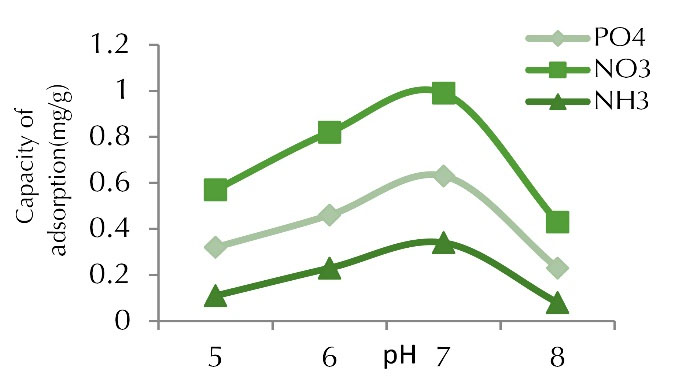
Figure 2.
Adsorption Capacity for Phosphate, Nitrite, and Ammonia at Various pH Values (concentration of 100 mg /L, adsorbent dose of 1 g, and contact time of 60 min).
.
Adsorption Capacity for Phosphate, Nitrite, and Ammonia at Various pH Values (concentration of 100 mg /L, adsorbent dose of 1 g, and contact time of 60 min).
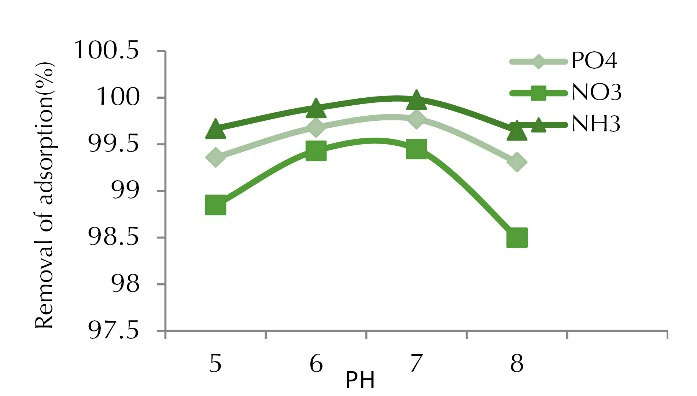
Figure 3.
Adsorption Percentage of Phosphate, Nitrite, and Ammonia at Various pH Values (concentration of 100 mg/L, adsorbent dose of 1 g, and contact time of 60 min).
.
Adsorption Percentage of Phosphate, Nitrite, and Ammonia at Various pH Values (concentration of 100 mg/L, adsorbent dose of 1 g, and contact time of 60 min).
According to the results obtained, the highest removal and adsorption capacity occurred at pH 7 and they decreased by increasing pH up to 8. The reason is that at pH values below 6, the H+ ions and pollutant ions were formed to bind to the adsorbent surface, resulting in a lower adsorption rate at pH below 6. The adsorption rate increased with increasing pH and reached its maximum value at pH 7 because negative charge was found in the carboxylate functional groups which increased the adsorption of the pollutant.
Carboxylate groups are negative charge groups which created a strong center for the adsorption of pollutants in the adsorbent structure. As the pH of the solution increased and the alkalinity of the medium increased, the number of OH- ions in solution increased, which resulted in the deposition of pollutants and a decrease in adsorption. In fact, the adsorption rate increased by approaching the neutral pH due to the release of OH ions and the carbon surface charge, and with functional groups such as -COOH, chemical adsorption was formed and finally, a surface complex formed due to the presence of contaminants in the porous space, which increased the adsorption rate (13). In a study by Zhang and Gao on the removal of arsenic, methylene blue, and phosphate using coal/alum nano-composite, the optimum phosphate uptake was observed in the pH range of 6 to 8 and the uptake of phosphate increased with increasing pH up to 8. The adsorption rate decreased due to the repulsive force between the phosphate and the graphene surface having a negative charge. The highest adsorption efficiency was 99.1% at pH 7. As mentioned, the adsorption was better at alkaline pH but it decreased at acidic pH, which is consistent with our research findings (14).
In a study by Mor et al on the removal of phosphate from wastewater using nano-alumina and activated carbon, pH was found to be highly effective in adsorption and the adsorption was at its lowest value at pH 2. The highest uptake rate occurred at pH 7, which is consistent with the present study (15). In a study by Rajeswari and Pius on the removal of nitrate using chitosan/PEG and chitosan/PVA polymer composites, the highest removal percentage was obtained at pH 7 and it is stated that the highest adsorption of cadmium was observed at neutral pH (9), which is consistent with the findings of our study.
3.1.4. Effect of Initial Concentration
Experiments were performed at pH value of 7, contact time of 60 minutes, adsorbent dose of 1 g in the concentration range of 25-100 mg/L. The percentages of adsorption reduced with increasing metal concentration. The adsorption capacities initially increased rapidly but it reduced at 50 mg/L concentration. Figs 4 and 5 illustrate the effect of initial concentration on removal percentage and adsorption capacity.In our study, the removal efficiency reduces with increasing initial concentration of pollutant; however, the adsorption capacity increased.
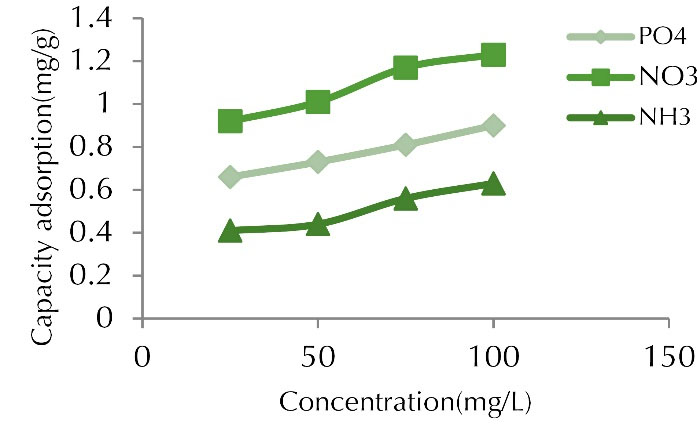
Figure 4.
Adsorption Capacity for Phosphate, Nitrite, and Ammonia at Various Initial Concentrations (time of 60 min, adsorbent dose of 1 g, and pH of 7).
.
Adsorption Capacity for Phosphate, Nitrite, and Ammonia at Various Initial Concentrations (time of 60 min, adsorbent dose of 1 g, and pH of 7).
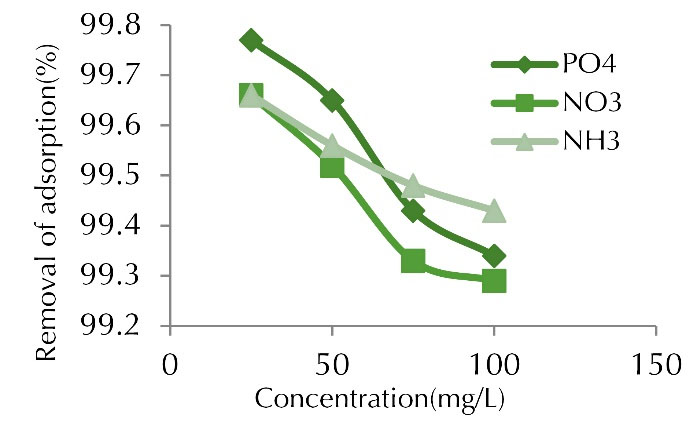
Figure 5.
Adsorption Percentage of Phosphate, Nitrite and Ammonia at Various Initial Concentrations (time of 60 min, adsorbent dose of 1 g, and pH of 7).
.
Adsorption Percentage of Phosphate, Nitrite and Ammonia at Various Initial Concentrations (time of 60 min, adsorbent dose of 1 g, and pH of 7).
The initial concentration changes were directly proportional to the adsorption capacity. Increasing the initial concentration had a negative effect on removal efficiency, it means, with increasing initial concentration of the pollutant, the adsorption efficiency decreased, which is normal. Although the adsorption of these ions decreased with increasing initial concentration, the adsorption capacity of the adsorbent increased. As the initial concentration increased, the number of ions competing for the reaction with the adsorbent surface functional groups increased, resulting in the saturation of the active sites (15).
The adsorption capacity increased as the concentration of contaminants in the solution increased. In addition, increasing the concentrations of contaminants increased the number of collisions between nitrite, phosphate, ammonia, and adsorbents, which in turn accelerated the adsorption process. It means that the adsorption capacity enhanced with increasing concentration of the contaminant in the solution. In fact, in an adsorption process, the initial concentration of pollutant ions in the solution played a key role as the driving force to overcome the mass transfer resistance between the liquid and solid phase. The uptake increases with increasing initial concentration (16,17).
Similar studies have been conducted by researchers to investigate the effect of initial concentration on removal rate. In a study performed on the removal of nitrate and phosphate using chitosan/Al2O3/Fe3O4 nano-composite compared to chitosan/Al2O3/Fe3O4 nano-composite, the results showed that pH, heavy metal concentration, time, and adsorbent dose were effective parameters. The highest removal occurred at pH 6, metal concentration of 2 mg/L, time of 360 minutes, and adsorbent content of 3 g/L (18).
3.1.5. Effect of Contact Time
The effective contact time ranged from 15 to 90 minutes at pH 7, initial concentration of 100 mg/L, and adsorbent dose of 1 g. Figs. 6 and 7 show removal and adsorption capacity. The results showed that with increasing temperature, the removal percentage and adsorption capacity increased. In this adsorbent, the highest percentage and adsorption capacity at 60 minutes for phosphate, ammonia, and nitrite were about 98.54%, 98.54%, and 98.51% and 7.32, 5.85, and 6.65%, respectively. The absorption was almost constant at 120 minutes. Therefore, contact time of 60 minutes was considered as the balance time. The shape of the adsorption capacity and the percentage of adsorption were similar and both increased with increasing contact time. The experiment was performed in the time range of 15 to 90 minutes. As observed in the previous sections, the absorption rate was very high in the early times, and the absorption efficiency and capacity increased with time but the intensity of absorption decreased.
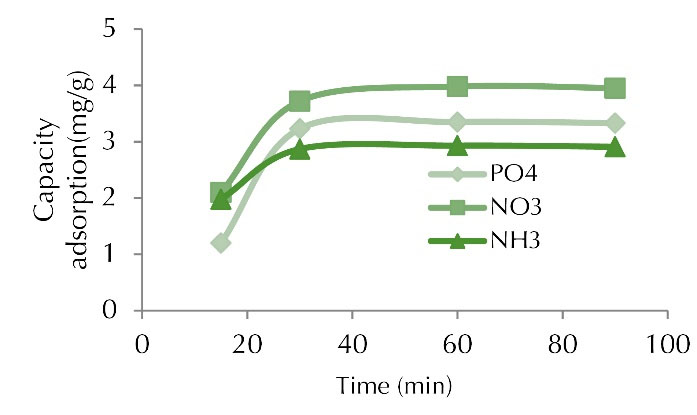
Figure 6.
Adsorption Capacity for Phosphate, Nitrite, and Ammonia at Various Contact Time (concentration of 100 mg/L, adsorbent dose of 1 g, and pH of 7).
.
Adsorption Capacity for Phosphate, Nitrite, and Ammonia at Various Contact Time (concentration of 100 mg/L, adsorbent dose of 1 g, and pH of 7).
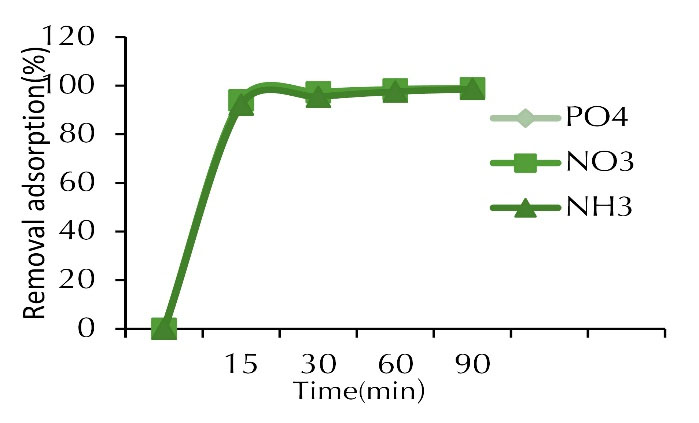
Figure 7.
Adsorption Percentage of Phosphate, Nitrite and Ammonia at Various Contact Time (concentration of 100 mg/L, adsorbent dose of 1 g, and pH of 7).
.
Adsorption Percentage of Phosphate, Nitrite and Ammonia at Various Contact Time (concentration of 100 mg/L, adsorbent dose of 1 g, and pH of 7).
The absorption rate during the first 60 minutes was much faster compared to subsequent contact times. As shown in the results, the curve had a steep slope for the first 30 minutes, and then it got steady by increasing the contact time; however, no significant changes were observed in the amount of pollutants absorbed after 60 minutes. The reason for this is the presence of high active sites on the adsorbent surfaces at the beginning of the adsorption process, which, approached the saturation limit after about 60 minutes and the adsorption rate decreased (19,20). On the other hand, the constancy of adsorption after a certain period of time can be attributed to the absorption capacity of both adsorbents due to the existence of vacancies available for adsorption which were initially more and the sites were occupied over time. The residual vacancy became problematic due to the repulsive force between the solid phase and the solution (13).
Additionally, the rapid uptake of nitrite, phosphate, and ammonia in early times can be attributed to the high surface area of the adsorbent and the high number of active functional groups to complex the adsorbent ions, which are easily accessible to contaminant ions (21,22). In fact, the first stage is the rapid adsorption phase on the adsorbent surface and the second is the slow phase of internal mass transfer. In the first case, most of the adsorbent pores were empty and the adsorption occurred rapidly. However, with the passage of time and the gradual filling of the pores, the penetration of the contaminant ions through the adsorbed ions and the bonding to the vacant surfaces slowed the adsorption process (23,24). Similar studies have been conducted by researchers to investigate the effect of time on the removal rates of nitrite, phosphate, and ammonia. The effect of contact time on the adsorption was studied on the adsorption for nitrate removal using chitosan/PEG and chitosan/PVA polymer composites, and it was found that the elevation of duration increased nitrate uptake (9). The removal of nitrate and phosphate was investigated using chitosan/Al2O3/Fe3O4nano-composite compared with chitosan/Al2O3/Fe3O4 nanoparticles, as well as the effect of contact time parameters, heavy metal concentration, and pH on adsorption. The highest amount of pollutant removal occurred within 60 minutes (18).
4. Conclusion
The purpose of this study was to evaluate and compare the adsorption efficiency and optimize the conditions governing the adsorption process for the use of available adsorbents. According to the present study, the use of nano-composite (chitosan and activated carbon) had a significant role in the treatment of wastewater in fish farms (R2=99.98%). The determination of adsorbent dose is one of the important parameters in the adsorption test. This will reduce the operating costs of the treatment as well as the pollution and sludge produced. In this study, the adsorption efficiency increased with increasing pH; however, it decreased at pH above 7. Moreover, the best adsorption occurred at pH 7. It was also observed that increasing the initial concentration of the contaminant resulted in a decrease in the efficiency of the removal process. The effect of contact time on adsorption efficiency was investigated and it was shown that the adsorption efficiency increased with increasing contact time. Finally, due to the high removal percentage (R2=99.98%), the chitosan and activated carbon nano-composite had great potential for removal of pollutants (nitrite, phosphate, and ammonia).
Conflict of Interest disclosure
The authors declare that they have no conflict of interest.
Acknowledgments
The authors thank the Iran National Science Foundation (INSF) and Gorgan University of Agricultural Sciences and Natural Resources for their financial support and facilities.
Ethical Statement
This research was financially supported by the Iran National Science Foundation (INSF) [grant number 96007146].
Authors Contribution
All authors were involved in data collection, analysis, and interpretation. All authors reviewed, refined, and approved the manuscript.
References
- Haider S, Park SY. Preparation of the electrospun chitosan nanofibers and their applications to the adsorption of Cu(II) and Pb(II) ions from an aqueous solution. J Memb Sci 2009; 328(1-2):90-6. doi: 10.1016/j.memsci.2008.11.046 [Crossref] [ Google Scholar]
- Avcu E, Avcu YY, Baştan FE, Rehman MAU, Üstel F, Boccaccini AR. Tailoring the surface characteristics of electrophoretically deposited chitosan-based bioactive glass composite coatings on titanium implants via grit blasting. Prog Org Coat 2018; 123:362-73. doi: 10.1016/j.porgcoat.2018.07.021 [Crossref] [ Google Scholar]
- Joshi S, Garg VK, Kataria N, Kadirvelu K. Applications of Fe3O4@AC nanoparticles for dye removal from simulated wastewater. Chemosphere 2019; 236:124280. doi: 10.1016/j.chemosphere.2019.07.011 [Crossref] [ Google Scholar]
- Park KH, Kim SJ, Jeong YH, Moon HJ, Song HJ, Park Park, YJ YJ. Fabrication and biological properties of calcium phosphate/chitosan composite coating on titanium in modified SBF. Mater Sci Eng C Mater Biol Appl 2018; 90:113-8. doi: 10.1016/j.msec.2018.04.060 [Crossref] [ Google Scholar]
- Hameed BH, Salman JM, Ahmad AL. Adsorption isotherm and kinetic modeling of 2,4-D pesticide on activated carbon derived from date stones. J Hazard Mater 2009; 163(1):121-6. doi: 10.1016/j.jhazmat.2008.06.069 [Crossref] [ Google Scholar]
- Zheng L, Wang C, Shu Y, Yan X, Li L. Utilization of diatomite/chitosan–Fe (III) composite for the removal of anionic azo dyes from wastewater: equilibrium, kinetics and thermodynamics. Colloids Surf A Physicochem Eng Asp 2015; 468:129-39. doi: 10.1016/j.colsurfa.2014.12.015 [Crossref] [ Google Scholar]
- Ravi Kumar MNV. A review of chitin and chitosan applications. React Funct Polym 2000; 46(1):1-27. doi: 10.1016/S1381-5148(00)00038-9 [Crossref] [ Google Scholar]
- Parhizgar F, Alishahi A, Varasteh H, Rezaee H. Removing sodium dodecyl benzene sulfonate (SDBS) from aqueous solutions using chitosan. J Polym Environ 2017; 25(3):836-43. doi: 10.1007/s10924-016-0855-7 [Crossref] [ Google Scholar]
- Rajeswari AA, Pius A. Adsorption studies for the removal of nitrate using chitosan/PEG and chitosan/PVA polymer composites. J Water Process Eng 2016; 9:123-134. doi: 10.1016/j.jwpe.2015.12.002 [Crossref] [ Google Scholar]
- Heidari A, Younesi H, Mehraban Z. Removal of Ni(II), Cd(II), and Pb(II) from a ternary aqueous solution by amino functionalized mesoporous and nano mesoporous silica. Chem Eng J 2009; 153(1-3):70-9. doi: 10.1016/j.cej.2009.06.016 [Crossref] [ Google Scholar]
- Shaheen TI, Montaser AS, Li S. Effect of cellulose nanocrystals on scaffolds comprising chitosan, alginate and hydroxyapatite for bone tissue engineering. Int J Biol Macromol 2019; 121:814-21. doi: 10.1016/j.ijbiomac.2018.10.081 [Crossref] [ Google Scholar]
- Sirajudheen P, Meenakshi S. Facile synthesis of chitosan-La3+-graphite composite and its influence in photocatalytic degradation of methylene blue. Int J Biol Macromol 2019; 133:253-61. doi: 10.1016/j.ijbiomac.2019.04.073 [Crossref] [ Google Scholar]
- Karthikeyan P, Banu HAT, Meenakshi S. Synthesis and characterization of metal loaded chitosan-alginate biopolymeric hybrid beads for the efficient removal of phosphate and nitrate ions from aqueous solution. Int J Biol Macromol 2019; 130:407-18. doi: 10.1016/j.ijbiomac.2019.02.059 [Crossref] [ Google Scholar]
- Zhang M, Gao B. Removal of arsenic, methylene blue, and phosphate by biochar/AlOOH nanocomposite. Chem Eng J 2013; 226:286-92. doi: 10.1016/j.cej.2013.04.077 [Crossref] [ Google Scholar]
- Mor S, Chhoden K, Negi P, Ravindra K. Utilization of nano-alumina and activated charcoal for phosphate removal from wastewater. Environ Nanotechnol Monit Manag 2017; 7:15-23. doi: 10.1016/j.enmm.2016.11.006 [Crossref] [ Google Scholar]
- Nasiri J, Motamedi E, Naghavi MR, Ghafoori M. Removal of crystal violet from water using beta-cyclodextrin functionalized biogenic zero-valent iron nanoadsorbents synthesized via aqueous root extracts of Ferula persica. J Hazard Mater 2019; 367:325-38. doi: 10.1016/j.jhazmat.2018.12.079 [Crossref] [ Google Scholar]
- Cadogan EI, Lee CH, Popuri SR, Lin HY. Efficiencies of chitosan nanoparticles and crab shell particles in europium uptake from aqueous solutions through biosorption: synthesis and characterization. Int Biodeterior Biodegradation 2014; 95(Pt A):232-40. doi: 10.1016/j.ibiod.2014.06.003 [Crossref] [ Google Scholar]
- Bozorgpour F, Ramandi HF, Jafari P, Samadi S, Sharif Yazd S, Aliabadi M. Removal of nitrate and phosphate using chitosan/Al2O3/Fe3O4 composite nanofibrous adsorbent: comparison with chitosan/Al2O3/Fe3O4 beads. Int J Biol Macromol 2016; 93(Pt A):557-65. doi: 10.1016/j.ijbiomac.2016.09.015 [Crossref] [ Google Scholar]
- Dong C, Chen W, Liu C. Preparation of novel magnetic chitosan nanoparticle and its application for removal of humic acid from aqueous solution. Appl Surf Sci 2014; 292:1067-76. doi: 10.1016/j.apsusc.2013.12.125 [Crossref] [ Google Scholar]
- Tyagi S, Rawtani D, Khatri N, Tharmavaram M. Strategies for nitrate removal from aqueous environment using nanotechnology: a review. J Water Process Eng 2018; 21:84-95. doi: 10.1016/j.jwpe.2017.12.005 [Crossref] [ Google Scholar]
- Oroujzadeh N. Removal of Cd(II) ions from contaminated water by a new modified magnetic chitosan nano composite. Adv Environ Technol 2018; 4(4):187-95. doi: 10.22104/aet.2019.3258.1159 [Crossref] [ Google Scholar]
- Masilompane TM, Chaukura N, Mishra SB, Mishra AK. Chitosan-lignin-titania nanocomposites for the removal of brilliant black dye from aqueous solution. Int J Biol Macromol 2018; 120(Pt B):1659-66. doi: 10.1016/j.ijbiomac.2018.09.129 [Crossref] [ Google Scholar]
- Luo W, Huang Q, Zhang X, Antwi P, Mu Y, Zhang M. Lanthanum/Gemini surfactant-modified montmorillonite for simultaneous removal of phosphate and nitrate from aqueous solution. J Water Process Eng 2020; 33:101036. doi: 10.1016/j.jwpe.2019.101036 [Crossref] [ Google Scholar]
- Banu HT, Karthikeyan P, Meenakshi S. Zr(4+) ions embedded chitosan-soya bean husk activated bio-char composite beads for the recovery of nitrate and phosphate ions from aqueous solution. Int J Biol Macromol 2019; 130:573-83. doi: 10.1016/j.ijbiomac.2019.02.100 [Crossref] [ Google Scholar]