Avicenna J Environ Health Eng. 6(2):92-99.
doi: 10.34172/ajehe.2019.12
Original Article
Predicting the Performance of Gorgan Wastewater Treatment Plant Using ANN-GA, CANFIS, and ANN Models
Maryam Bayat Varkeshi 1  , Kazem Godini 2 , Mohammad ParsiMehr 3, * , Maryam Vafaee 1
Author information:
1Department of Water Engineering, Faculty of Agriculture, Malayer University, Hamedan, Iran.
2Environmental Health Research Center, Research Institute for Health Development, Kurdistan University of Medical Sciences, Sanandaj, Iran.
3Department of Environmental Science, Faculty of Natural Resources and Environment, Malayer University, Malayer, Hamedan, Iran.
*Correspondence to Mohammad ParsiMehr, Department of Environmental Science, Faculty of Natural Resources and Environment, Malayer University, Malayer, Hamedan, Iran, Tel: +989182251004, Email: parsimehr.mohamad@ gmail.com,
mohamad.parsimehr@stu.malayeru.ac.ir
Abstract
A reliable model for any wastewater treatment plant (WWTP) is essential to predict its performance and form a basis for controlling the operation of the process. This would minimize the operation costs and assess the stability of environmental balance. This study applied artificial neural network-genetic algorithm (ANN-GA) and co-active neuro-fuzzy logic inference system (CANFIS) in comparison with ANN for predicting the performance of WWTP. The result indicated that the GA produces more accurate results than fuzzy logic technique. It was found that GA components increased the ANN ability in predicting WWTP performance. The normalized root mean square error (NRMSE) for ANN-GA in predicting chemical oxygen demand (COD), total suspended solids (TSS) and biochemical oxygen demand (BOD) were 0.15, 0.19 and 0.15, respectively. The corresponding correlation coefficients were 0.891, 0.930 and 0.890, respectively. Comparing these results with other studies showed that despite the slightly lower performance of the current model, its requirement for a lower number of input parameters can save the extra cost of sampling.
Keywords: Artificial neural network, Wastewater, Fuzzy logic, Genetic algorithm
Copyright and License Information
© 2019 The Author(s); Published by Hamadan University of Medical Sciences.
This is an open-access article distributed under the terms of the Creative Commons Attribution License (
http://creativecommons.org/licenses/by/4.0), which permits unrestricted use, distribution, and reproduction in any medium provided the original work is properly cited.
1. Introduction
Minimizing the adverse impacts of wastewater discharged into the surface water bodies on the environment has always been a challenge. Wastewater treatment plants (WWTPs) are designed to convert the wastewater into more environmentally friendly water and return it to the environment. Therefore, it is important for the managers and plant operators to know how the performances of the plants are and how efficiently they work.
At any WWTP, there is an incoming wastewater flow; this flow is treated before it is allowed to be returned to the environment, lakes, or streams (1). A standard wastewater treatment process consists of a primary treatment including physical removal of floatable and settleable solids and secondary treatment which is mainly the biological removal of dissolved solids. Some other treatment plants have a tertiary treatment option. These stages create a complex system in which it is hard to predict the output quality of the effluent. Physical, chemical, and biological processes are involved which are highly nonlinear and dynamic (2).
Models are tools that can help managers and decision-makers to predict the effluent quality in advance and operate the plant more efficiently. The main challenge in a good modeling practice is firstly to find a suitable and practical model, secondly to measure the minimum number of input parameters for the model, and thirdly to predict with enough accuracy. Most of the plants are operated based on experience and some small scale experimental results (2). Most of the pollutants, such as total suspended solids (TSS) and biochemical oxygen demand (BOD) are correlated to the inflow (3). An online system for generating short-term sewer flow forecasts was developed by Hernebring et al (4). Gernaey et al presented a more complex approach for phenomenological modeling of WWTP influent disturbance scenarios (5). Physically-based deterministic models are the industry standards for wastewater processing modeling. Some researchers used simpler models such as regression models (6–8) to reduce the complexity of the modeling process. In recent years, using intelligent models such as artificial neural network (ANN), machine learning, and fuzzy logic are more popular due to their simplicity in modeling process. They are data-driven model types; therefore, they need historical data to accurately predict the output. Selecting the right topology and model construction are the main challenges for these models especially when the short historical data are available.
Dogan et al studied the abilities of ANN model to improve the accuracy of BOD estimation. In this study, the potential of an ANN technique in BOD estimation in Melen River was examined by comparing the results with observed BOD. From the obtained results, an ANN model appears to be a useful tool for prediction of the BOD in Melen River (9). In the study by Güçlü and Dursun, three independent ANN models trained with backpropagation algorithm were developed to predict effluent chemical oxygen demand (COD), suspended solids (SS) and aeration tank mixed liquor SS concentrations of Ankara central WWTP (10). Elmolla et al examined the implementation of ANN for the prediction and simulation of COD removal from antibiotic aqueous solution by the Fenton process and is very close to the experimental results with correlation coefficient (R2) of 0.997 and mean square error (MSE) of 0.000376 (11). Estimation of oxygen demand levels using ultraviolet–visible (UV-Vis) spectroscopy and results showed that in most cases, the proposed technique (UV-ANN) has the best performance. The predicted values of BOD and COD using UV-ANN model were very close to values obtained using the standard models (12).
WWTP of Gorgan, with the capacity of 686 L/s to service more than 500 000 people per day, is of great importance. Considering numerous problems in the registration and measurement of wastewater quality such as BOD, COD and TSS, the main aim of the present study was: 1) to find the optimized topology of the ANN and new regression models for prediction of complex wastewater quality data, 2) to select the best model in prediction of the wastewater quality data, and 3) to evaluate the results of the ANN, artificial neural network-genetic algorithm (ANN-GA), and co-active neuro-fuzzy logic inference system (CANFIS) in the prediction of BOD, COD and TSS removals and selection of the optimized topology. Using this model can reduce the cost of the experiment. It was also more efficient in wastewater treatment by predicting the parameters output based on wastewater input parameters.
2. Materials and Methods
2.1. Study Area
The data set used in this study was gathered through continuous monitoring of samples from Gorgan WWTP, Golestan, Iran (36°52’40”N 54°26’12”E). This WWTP was constructed and came into operation in 2014. Fig. 1 shows the location of the WWTP. The wastewater quality parameters were measured in Gorgan Wastewater Treatment Laboratory from April 2014 to October 2015. Based on measured values of different variables, input factors (variables) of the treatment including pH, TSS, charge (Q), BOD, and COD were selected for the model development. The output parameters of treatment were BOD, COD, and TSS. The weekly measuring of seven wastewater quality parameters was conducted during 2 years (2014–2015).
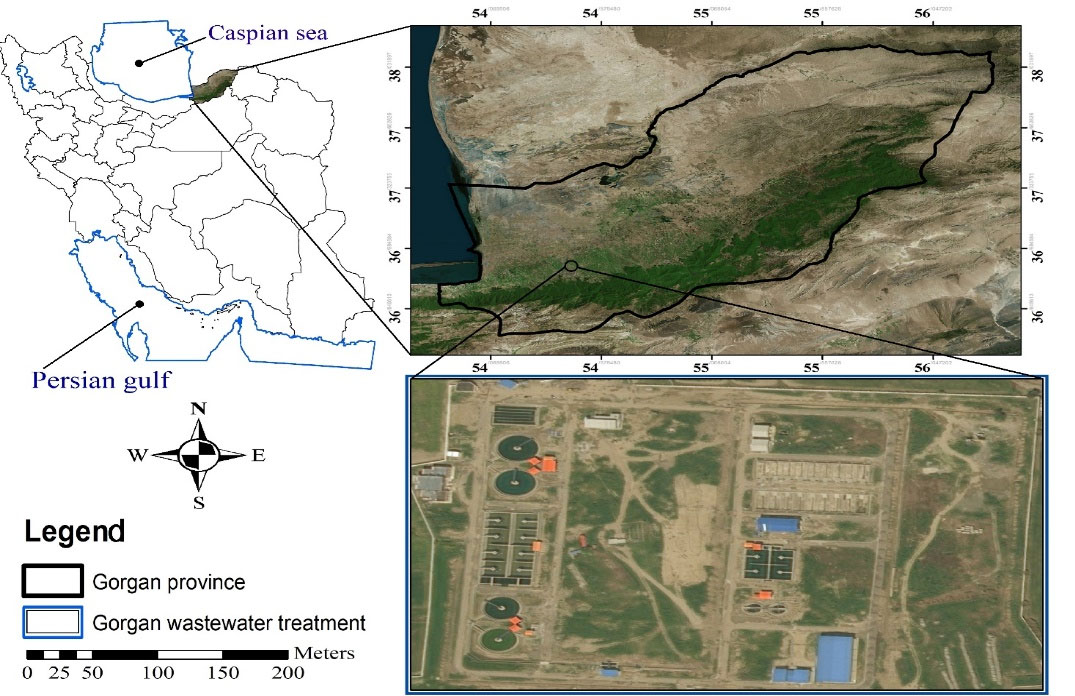
Figure 1.
Location of Gorgan WWTP.
.
Location of Gorgan WWTP.
Statistical values of the wastewater quality parameters are presented in Table 1. In this table, Xmean, Xmax, Xmin, SDx, and CV indicate the mean, maximum, minimum, standard deviation, and coefficient of variation of the data set, respectively.
Table 1.
Wastewater Quality Parameters Measured During 2014-2015 in Gorgan WWTP
|
CV
|
SD
x
|
X
min
|
X
max
|
X
mean
|
Unit
|
Data Set
|
| 0.41 |
48.63 |
83 |
320 |
117.38 |
mgL-1 |
BOD |
| 0.28 |
50.83 |
101 |
343 |
179.57 |
mgL-1 |
TSS |
| 0.17 |
1269.56 |
5284 |
11519 |
7631.62 |
m3h-1 |
Q |
| 0.03 |
0.24 |
7.04 |
7.94 |
7.46 |
-- |
pH |
| 0.017 |
93.16 |
171 |
628 |
555.193 |
mgL-1 |
COD |
Abbreviations: COD, chemical oxygen demand; TSS, total suspended solids; BOD, biochemical oxygen demand. CV: coefficient of variation SD: standard deviation Q: charge
Fig. 2 shows simple structure of the used ANN in this study with 5 neurons in the input layer and 3 neurons in the output layer.
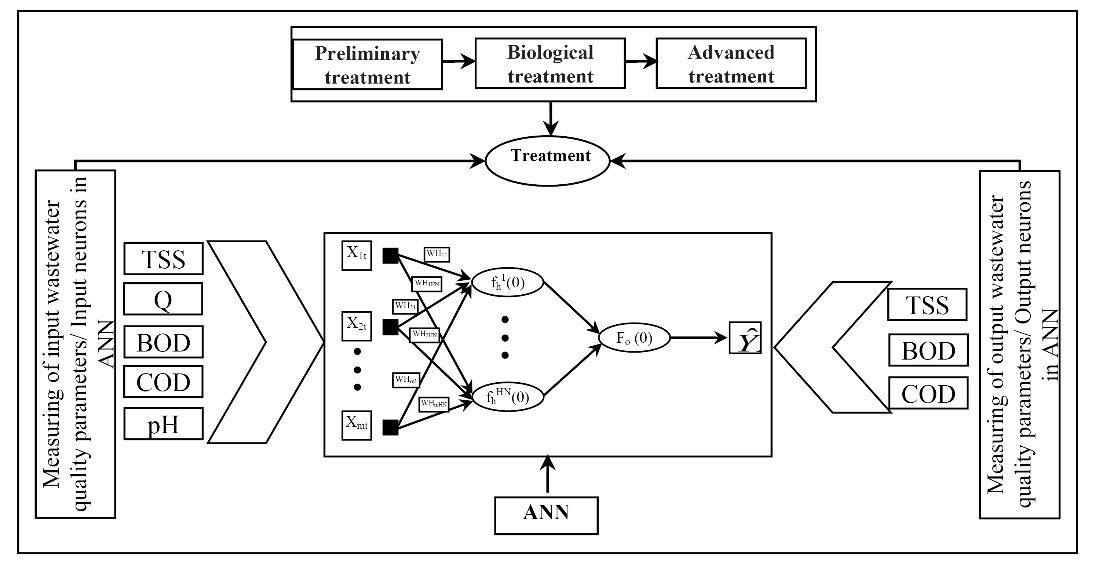
Figure 2.
Developed ANN Structure in WWTP.
.
Developed ANN Structure in WWTP.
Tangent hyperbolic (Tan.) activation function and learning rules of Levenberg Marquardt (LM) algorithm were used in this study. The LM algorithm is one of the most appropriate higher-order adaptive algorithms known for minimizing the error of a neural network. It is a member of a class of learning algorithms called “pseudo-second-order methods” (13). Finally, the best structure with different number of neurons in hidden layers was determined using trial and error procedure.
2.1.1. Adaptive GA-ANN
Principles of GA were presented by Holland (14) at the University of Michigan, USA. GA, as a particular class of evolutionary methods that use techniques inspired by Darwin’s theory of evolution and evolutionary biology, is a search technique used to find exact or approximate solutions to optimization and search problems (15). Techniques inspired by evolutionary biology used in GA are inheritance, mutation, selection, and crossover. GA is implemented in a computer simulation in which a population of abstract representations (chromosomes or the genotype of the genome) of candidate solutions (individuals, creatures, or phenotypes) to an optimization problem evolves toward better solutions. GA can be a learning algorithm for training ANNs to adjust the weights of the connections. In this study, the learning rate, momentum rate, and the number of neurons in the hidden layer were considered as genes in the chromosome (16). The goodness or fitness which is inversely related to the mean square error of the ANNs outputs was used to test the selected topologies in each trial.
The training performance of ANNs using GA starts by initializing the connection weights and the input layer nodes. After estimating the output values at the output layer, the global error is then calculated as the fitness value of the objective function. The procedure is repeated and when the global optimal solution is reached after a sufficient number of generations, the procedure stops. It is notable that a generation in GA is highly analogous to iteration in the backpropagation algorithm, and the goal in both algorithms is to update the connection weights. Once the connection weights are updated at the end of a generation, the fitness value of the objective function can be calculated. In this way, a fitter population of chromosomes is created. This procedure is repeated to reach a population of chromosomes with an acceptable fitness 17).
The training performance of the ANN using the GA has two parts. The first part uses training data to train the ANN. The second part uses the developed ANN in the first part to test the entire range of the smoothing factor for the optimal operation over the testing data. The GA can produce the ANN which can be operated best over the testing data. However, when the ANN is trained using the GA, it requires much more time than when the backpropagation algorithm is used as a search technique (17).
2.1.2. Co-active Neuro-fuzzy Inference System
Among the new techniques of modeling, fuzzy systems have a special place. The fuzzy expert system consists of linguistic rules relating the membership functions of the input variables to the membership function of the output variable. A series of IF-THEN statements relate the input to the output variables. In this study, fuzzy logic was used as CANFIS model. The CANFIS model integrates adaptable fuzzy inputs with a modular neural network to rapidly and accurately approximate complex functions. Fuzzy inference systems (FISs) are also valuable, as they combine the explanatory nature of rules (membership functions) with the power of ANNs. These types of networks solve problems more efficiently than ANNs when the underlying function to model is highly variable or locally extreme (18). The characteristics of CANFIS were emphasized by the advantages of integrating ANNs with FIS in the same topology (19). Takagi–Sugeno fuzzy structure (20) was preferred in this article. In addition, the membership function used in this study was the Gaussian fuzzy axon type which uses a Gaussian-shaped curve as its membership function to each input neuron.
For modeling, the experimental data sets were divided into a training set (80% of the data) and validation set (20% of the data set). NeuroSolutions version 5 was used for training and testing of the network. In NeuroSolutions, the criteria used to evaluate the fitness of each potential solution are the lowest cost achieved during the training run (13). To avoid overtraining, the early stopping technique was used in training (21).
2.2. Evaluation Criteria for ANN, CANFIS and ANN-GA Predictions
Various structures were tried to find the optimal ANN models. The normalized root mean square error (NRMSE), mean absolute error (MAE) and average absolute error (AAE) were used for evaluating the models. NRMSE, MAE and AAE values close to 0 indicate an optimal model. The NRMSE, MAE, and AAE are defined as:
(1)
Correlation coefficient (r) is a common criterion for goodness of fit for regression models (22). It is calculated as follow:
(4)
Where Xi and Yi are the observed and estimated values of ith, respectively,
and
are the average of Xi and Yi, and n is the total numbers of data.
3. Results and Discussion
For evaluation of WWTP performance, the values of BOD, COD, and TSS in input and output of treatment were compared. Fig. 3 shows wastewater treatment performance.
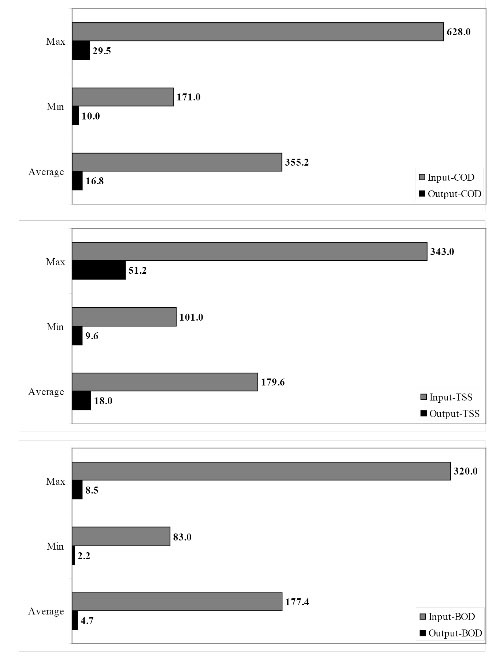
Figure 3.
Evaluation of WWTP Performance.
.
Evaluation of WWTP Performance.
As Fig. 3 shows, the values of BOD, COD and TSS in output treatment have decreased greatly. The performance evaluation indicated that 95.3% COD removal, 90.0% TSS removal and 97.3% BOD removal efficiencies were achieved. These values are in line with other studies (23).
To find the interactions between different variables, correlation coefficient values were estimated as shown in Fig. 4. shows that the maximum correlation exists between input TSS and output TSS (0.476).
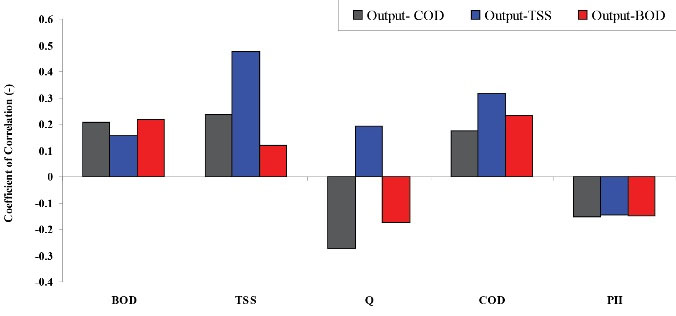
Figure 4.
Correlation Coefficient Between Input and Output Data of Treatment.
.
Correlation Coefficient Between Input and Output Data of Treatment.
The statistical criteria of NRMSE, MAE, and AAE for optimized structure of ANN, ANN-GA, and CANFIS in prediction of each parameter are given in Table 2.
Table 2.
Performance Results for COD, BOD and TSS Prediction by ANN, ANN-GA, and CANFIS Models
|
Model
|
MF
|
AF
|
LA
|
Structure
|
Parameter
|
NRMSE (-)
|
MAE (mg/L)
|
AAE (-)
|
| ANN |
-- |
Tan |
LM |
5,10,3 |
COD |
0.16 |
2.04 |
0.120 |
| -- |
Tan |
LM |
5,10,3 |
TSS |
0.25 |
5.41 |
0.234 |
| -- |
Tan |
LM |
5,10,3 |
BOD |
0.19 |
0.69 |
0.140 |
| ANN-GA |
-- |
Tan |
LM |
5,10,3 |
COD |
0.15 |
1.46 |
0.072 |
| -- |
Tan |
LM |
5,10,3 |
TSS |
0.19 |
1.82 |
0.106 |
| -- |
Tan |
LM |
5,10,3 |
BOD |
0.15 |
0.49 |
0.088 |
| CANFIS |
Bell |
Tan |
LM |
2,2,2,2,2 |
COD |
0.23 |
2.68 |
0.132 |
| Bell |
Tan |
LM |
2,2,2,2,2 |
TSS |
0.34 |
5.42 |
0.242 |
| Bell |
Tan |
LM |
2,2,2,2,2 |
BOD |
0.25 |
0.94 |
0.199 |
Abbreviations: ANN, artificial neural network; GA, genetic algorithm; COD, chemical oxygen demand; TSS, total suspended solids; BOD, biochemical oxygen demand; NRMSE, normalized root mean square error; MAE, mean absolute error; AAE, average absolute error; CANFIS, co-active neuro-fuzzy logic inference system; Tan, Tangent; LM, Levenberg Marquardt; MF, Membership Function; AF, Activation Function; LA, Learning Algorithm.
Table 2 indicates that the structure of Tanh transfer function with LM learning algorithm and 10 neurons in hidden layer is the best ANN structure and it has the lowest errors.
The best ANN results in the prediction of COD were as follows: NRMSE = 0.16, MAE = 2.04 mg/L, and AAE = 0.120. Optimizing the ANN results using AAN-GA improved the results and reduced the error values. As can be seen in Table 2, the NRMSE, MAE and AAE values of COD parameter are 0.15, 1.46, and 0.072, respectively. The same results were obtained for the prediction of TSS and BOD. The NRMSE, MAE and AAE values of ANN in the prediction of TSS were 0.25, 5.41, and 0.234, respectively. However, the use of ANN-GA model decreased NRMSE, MAE and AAE values to 0.19, 1.82, and 0.106. Regarding BOD, ANN-GA results were better than ANN. The values of NRMSE, MAE, and AAE were 0.19, 0.69, and 0.140, respectively. In contrast, ANN-GA results were 0.15, 0.49, and 0.088. However, the use of fuzzy logic did not cause any improvement in any of the parameters. The error values in the prediction of all three parameters by CANFIS model were higher compared to ANN results. These results are consistent with the results of a previous study (17) in which better performance was observed using ANN-GA compared to CANFIS to improve the prediction of evapotranspiration. Moreover, another study showed that using GA-ANN model is better than ANN model for runoff prediction (24).
Moreover, the statistical criteria presented in Table 2 showed that the developed model was more accurate in predicting COD compared to BOD and TSS. The average value of NRMSE for COD was 0.18, while the average NRMSE values for TSS and BOD were 0.26 and 0.20, respectively.
With regard to the optimized ANN, ANN-GA, and CANFIS structures, estimated and observed values of COD, TSS, and BOD as well as time series and linear model fitted the data were presented in Figs. 5, 6, and 7, respectively.
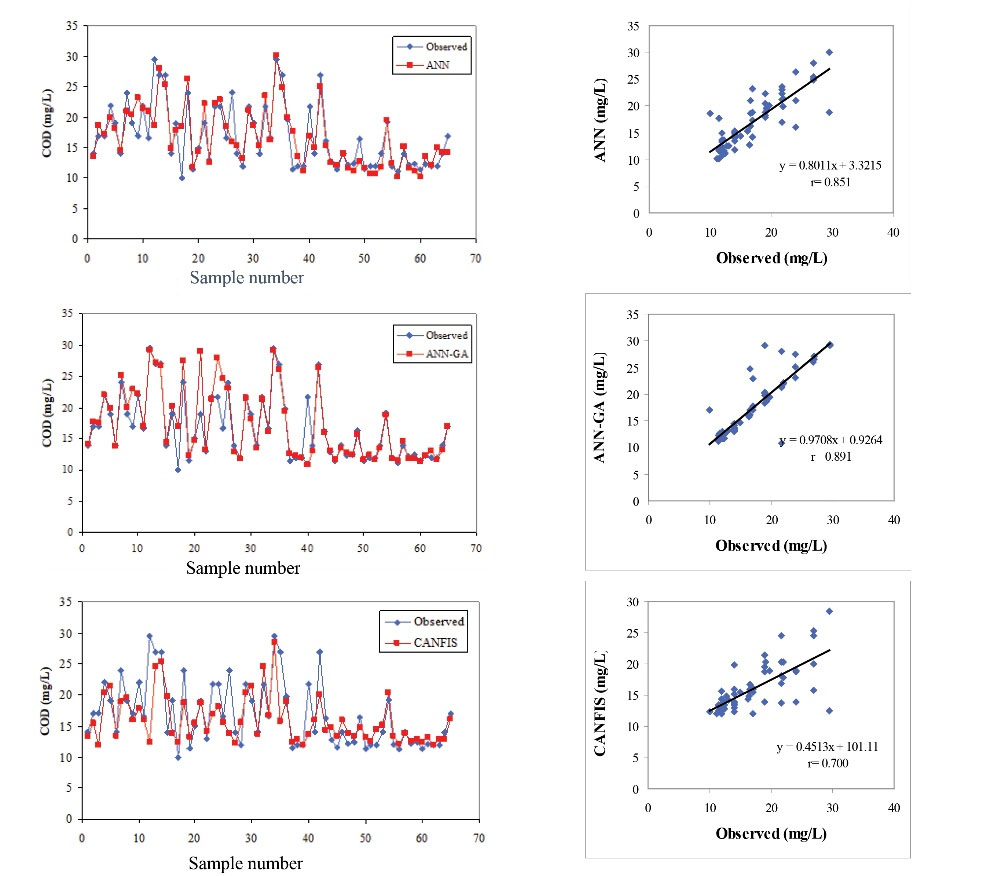
Figure 5.
COD Predictions of the ANN, ANN-GA, and CANFIS Models.
.
COD Predictions of the ANN, ANN-GA, and CANFIS Models.
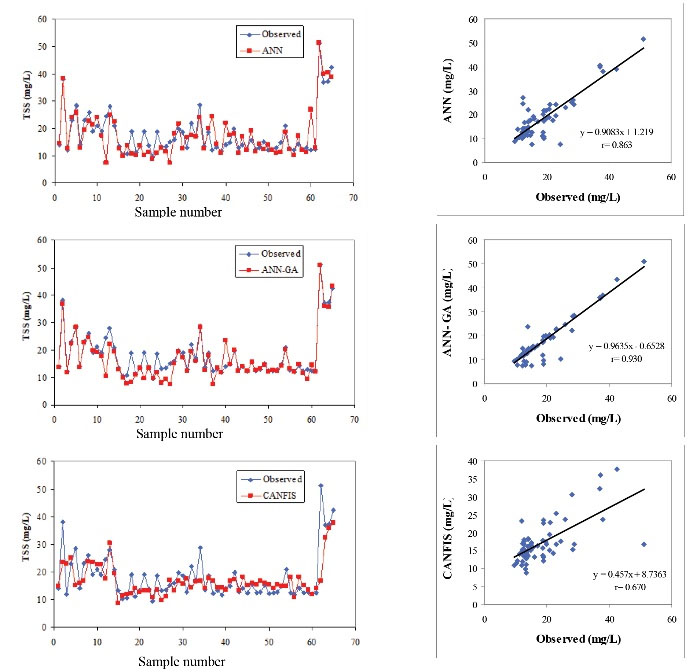
Figure 6.
TSS Predictions of the ANN, ANN-GA, CANFIS Models.
.
TSS Predictions of the ANN, ANN-GA, CANFIS Models.
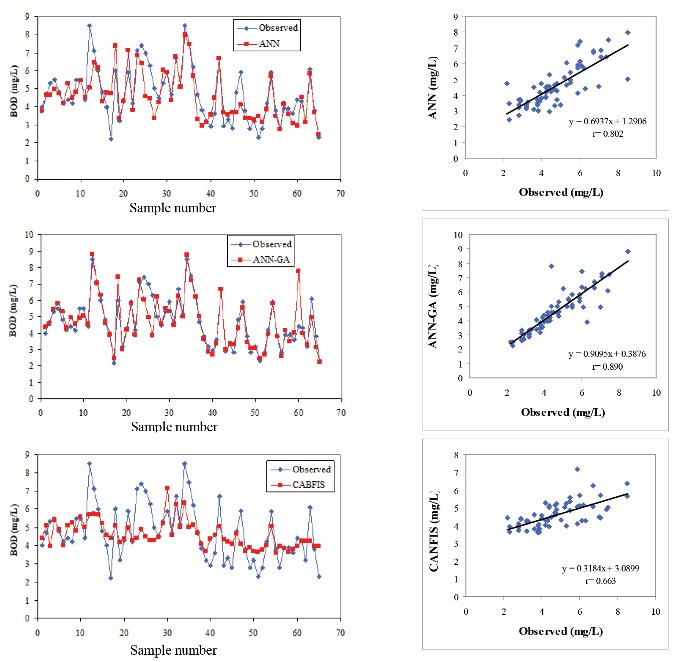
Figure 7.
BOD Predictions of the ANN, ANN-GA, and CANFIS Models
.
BOD Predictions of the ANN, ANN-GA, and CANFIS Models
A comparison of the observed and estimated COD concentrations is shown in Fig. 5 in time series and scatter plot with regression line. It can be seen from the graphs that the ANN-GA model for COD closely follow the observed values. The scatter plot also confirms this (Fig. 5). It can be clearly seen from the scatter plots that the ANN-GA COD has a higher r value (0.891) compared to ANN COD (0.851) and CANFIS COD (0.700). The difference between the measured and calculated values in some parts is due to the influence of factors other than 5 factors chosen as input parameters on the output of the models. Parameters such as climate, inflow rate, and temperature could also impact the results. Some of these parameters were not available for this research and could not be used in the models. On the other hand, using more input parameters would make the models more complex which is in contradiction with the ANN concept which uses simple structure. Therefore, although the use of more parameters can reduce the difference between the estimated values and observations, it would increase the cost of input data collection. In a study by Güçlü and Dursun in 2010 (10), the correlation coefficient was calculated as 0.85 for COD modeling. They used 8 input parameters which include flow rate, return activated sludge, waste activated sludge, DO, COD, SS, total Kjeldahl nitrogen, and COD load in modeling process but in the present study, five parameters were used. There is no significant improvement in their model using extra input parameters. In a study, Pai et al found a prediction accuracy of 48.22 % for COD (25).
The scatter plots of observed and simulated TSS using ANN, ANN-GA, and CANFIS are presented in Fig. 6. The results indicate that ANN, ANN-GA, and CANFIS models could produce satisfactory results. The best results for the ANN, ANN-GA, and CANFIS models were r = 0.863, r = 0.93, and r = 0.670 for total data, respectively.
As Fig. 6 shows, approximately 93% of the data estimated with high accuracy and the low accuracy for the remaining 7% could be affected by unaccounted parameters. This low accuracy can be seen with higher degree in CANFIS model. The results of a study by Tümer and Edebali in 2015 (7) indicated that ANN model was more applicable for predicting TSS with r=0.96; however, they used more parameters as input for predicting TSS. These additional input parameters increased the accuracy. On the other hand, they increased the cost of sampling and analysis. In addition, the developed model in this study can simultaneously predict 3 output parameters.
Fig. 7 illustrates the scatter plots for the ANN, ANN-GA, and CANFIS models for BOD. The proposed ANN and ANN-GA models have well learned the nonlinear relationship between the input and the output variables with r values of 0.802 and 0.890, respectively. Fig. 7 illustrates that the simulated and observed BOD values were closely clustered along the line for both models. Therefore, both ANN and ANN-GA models were capable of accurately predicting BOD using the minimum input parameters.
In this study, the correlation coefficient (r) values ranged from 0.663 to 0.890 for BOD. Another study showed that the correlation coefficient value of the selected ANN nodes in the input layer including water pH, total alkalinity, total hardness, total solids, COD, ammoniacal nitrogen, nitrate nitrogen, Cl, PO4, K, and Na for predicting BOD was 0.87 (26). In the present study, only 5 input parameters which are easy to measure were successfully used for COD, TSS, and BOD estimation at the same time.
4. Conclusions
The results indicated that the use of GA technique can improve the ANN predicted results. However, the fuzzy logic technique showed the lowest performance. The study indicated that the ANN-GA can predict the plant performance with correlation coefficient (r) between the observed and predicted output variables reached up to 0.90. Moreover, ANN-GA provides an effective analyzing and diagnosing tool to understand and simulate the non-linear behavior of the plant, which can be used as a valuable performance assessment tool for plant operators and decision-makers. The selected model structure had the highest correlation value and the least error for prediction of COD, TSS, and BOD within one single model. Therefore, the model developed in this work has an acceptable generalization capability and accuracy. As a result, the neural network modeling could effectively simulate and predict the performance of WWTP.
Conflict of Interest Disclosures
The authors declared that they had no conflict of interest.
Acknowledgements
The authors are grateful to Malayer University for financial support.
Authors Contribution
MBV Investigation, Methodology, Software. KG: Methodology, Writing - review & editing. MP: Methodology, Supervision, Writing - review & editing. MV: Methodology, Writing - review & editing.
References
- Al-Dosary S, Galal MM, Abdel-Halim H. Environmental impact assessment of wastewater treatment plants—(Zenien and 6th of October WWTP). Int J Curr Microbiol Appl Sci 2015; 4(1):953-64. [ Google Scholar]
- Wei X. Modeling and Optimization of Wastewater Treatment Process with a Data-Driven Approach [theses]. Iowa City, Iowa: University of Iowa; 2013.
- Belanche LsA, Valdés JJ, Comas J, Roda IR, Poch M. Towards a model of input–output behaviour of wastewater treatment plants using soft computing techniques. Environ Model Softw 1999; 14(5):409-19. doi: 10.1016/S1364-8152(98)00102-9 [Crossref] [ Google Scholar]
- Hernebring C, Jönsson LE, Thorén UB, Møller A. Dynamic online sewer modelling in Helsingborg. Water Sci Technol 2002; 45(4-5):429-36. [ Google Scholar]
- Gernaey K, Rosen C, Benedetti L, Jeppsson U. Phenomenological Modeling of Wastewater Treatment Plant Influent Disturbance Scenarios. Copenhagen, Denmark: 10th International Conference on Urban Drainage; 2005.
- Carstensen J, Harremoës P, Strube R. Software sensors based on the grey-box modelling approach. Water Sci Technol 1996; 33(1):117-26. doi: 10.1016/0273-1223(96)00164-3 [Crossref] [ Google Scholar]
- Tümer AE, Edebali S. An artificial neural network model for wastewater treatment plant of Konya. Int J Intell Syst Appl Eng 2015; 3(4):131-5. doi: 10.18201/ijisae.65358 [Crossref] [ Google Scholar]
- Atanasova N, Kompare B. Modelling of wastewater treatment plant with decision and regression trees. Southampton; WIT Press; 2002.
- Dogan E, Ates A, Yilmaz EC, Eren B. Application of artificial neural networks to estimate wastewater treatment plant inlet biochemical oxygen demand. Environ Prog 2008; 27(4):439-46. doi: 10.1002/ep.10295 [Crossref] [ Google Scholar]
- Güçlü D, Dursun Ş. Artificial neural network modelling of a large-scale wastewater treatment plant operation. Bioprocess Biosyst Eng 2010; 33(9):1051-8. doi: 10.1007/s00449-010-0430-x [Crossref] [ Google Scholar]
- Elmolla ES, Chaudhuri M, Eltoukhy MM. The use of artificial neural network (ANN) for modeling of COD removal from antibiotic aqueous solution by the Fenton process. J Hazard Mater 2010; 179(1):127-34. doi: 10.1016/j.jhazmat.2010.02.068 [Crossref] [ Google Scholar]
- Fogelman S, Zhao H, Myer Blumenstein M, Zhang S. Estimation of Oxygen Demand Levels Using UV-Vis Spectroscopy and Artificial Neural Networks as an Effective Tool for Real-Time, Wastewater Treatment Control. Proceedings of the 1st Australian Young Water Professionals Conference; 15-17 February, 2006; Sydney, Australia.
- Tabari H, Marofi S, Abyaneh HZ, Sharifi MR. Comparison of artificial neural network and combined models in estimating spatial distribution of snow depth and snow water equivalent in Samsami basin of Iran. Neural Comput Appl 2010; 19(4):625-35. doi: 10.1007/s00521-009-0320-9 [Crossref] [ Google Scholar]
- Holland JH. Outline for a logical theory of adaptive systems. J ACM 1962; 9(3):297-314. doi: 10.1145/321127.321128 [Crossref] [ Google Scholar]
- Goldberg DE. Genetic Algorithms in Search, Optimization and Machine Learning. Boston, MA: Addison-Wesley; 1989.
- Nasseh S, Mohebbi A, Sarrafi A, Taheri M. Estimation of pressure drop in venturi scrubbers based on annular two-phase flow model, artificial neural networks and genetic algorithm. Chem Eng J 2009; 150(1):131-8. doi: 10.1016/j.cej.2008.12.011 [Crossref] [ Google Scholar]
- Kim S, Kim HS. Neural networks and genetic algorithm approach for nonlinear evaporation and evapotranspiration modeling. J Hydrol 2008; 351(3-4):299-317. doi: 10.1016/j.jhydrol.2007.12.014 [Crossref] [ Google Scholar]
- Parthiban L, Subramanian R. Intelligent heart disease prediction system using CANFIS and genetic algorithm. Int J Biol Life Sci 2007; 3:157-160. [ Google Scholar]
- Aytek A. Co-active neurofuzzy inference system for evapotranspiration modeling. Soft comput 2008; 13(7):691. doi: 10.1007/s00500-008-0342-8 [Crossref] [ Google Scholar]
- Takagi T, Sugeno M. Fuzzy identification of systems and its applications to modeling and control. IEEE Trans Syst Man Cybern 1985; SMC-15(1):116-32. doi: 10.1109/TSMC.1985.6313399 [Crossref] [ Google Scholar]
- Erenturk S, Erenturk K. Comparison of genetic algorithm and neural network approaches for the drying process of carrot. J Food Eng 2007; 78(3):905-12. doi: 10.1016/j.jfoodeng.2005.11.031 [Crossref] [ Google Scholar]
- Razi MA, Athappilly K. A comparative predictive analysis of neural networks (NNs), nonlinear regression and classification and regression tree (CART) models. Expert Syst Appl 2005; 29(1):65-74. doi: 10.1016/j.eswa.2005.01.006 [Crossref] [ Google Scholar]
- Sharda AK, Sharma MP, Kumar S. Performance evaluation of brewery waste water treatment plant. International Journal of Engineering Practical Research (IJEPR) 2013; 2(3):105-11. [ Google Scholar]
- Sedki A, Ouazar D, El Mazoudi E. Evolving neural network using real coded genetic algorithm for daily rainfall–runoff forecasting. Expert Syst Appl 2009; 36(3 Pt 1):4523-7. doi: 10.1016/j.eswa.2008.05.024 [Crossref] [ Google Scholar]
- Pai TY, Tsai YP, Lo HM, Tsai CH, Lin CY. Grey and neural network prediction of suspended solids and chemical oxygen demand in hospital wastewater treatment plant effluent. Comput Chem Eng 2007; 31(10):1272-81. doi: 10.1016/j.compchemeng.2006.10.012 [Crossref] [ Google Scholar]
- Singh KP, Basant A, Malik A, Jain G. Artificial neural network modeling of the river water quality--a case study. Ecol Modell 2009; 220(6):888-95. doi: 10.1016/j.ecolmodel.2009.01.004 [Crossref] [ Google Scholar]