Avicenna J Environ Health Eng. 6(2):75-82.
doi: 10.34172/ajehe.2019.10
Research Article
Evaluation of Temporal and Spatial Variations of Water Quality Parameters in Zohreh River, Iran
Maryam Ravanbakhsh 1, 2  , Yaser Tahmasebi Birgani 1, 3, * , Maryam Dastoorpoor 4, Kambiz Ahmadi Angali 5
Author information:
1Department of Environmental Health Engineering, School of Public Health, Ahvaz Jundishapur University of Medical Sciences, Ahvaz, Iran.
2Student Research Committee, Ahvaz Jundishapur University of Medical Sciences, Ahvaz, Iran.
3Environmental Technologies Research Center, Ahvaz Jundishapur University of Medical Sciences, Ahvaz, Iran.
4Department of Biostatistics and Epidemiology, Air Pollution and Respiratory Diseases Research Center, Ahvaz Jundishapur University of Medical Sciences, Ahvaz, Iran.
5Department of Biostatistics, Ahvaz Jundishapur University of Medical Sciences, Ahvaz, Iran.
Abstract
Discriminant analysis (DA) and principal component analysis (PCA), as multivariate statistical techniques, are used to interpret large complex water quality data and assess their temporal and spatial variation in the basin of the Zohreh river. In this study, data sets of 16 water quality parameters collected from 1966 to 2013) in 4 stations (1554 observations for each parameter) were analyzed. PCA for data sets of Kheirabad, Poleflour, Chambostan and Dehmolla stations resulted in 4, 4, 4, and 3 latent factors accounting for 88.985%, 93.828%, 88.648%, and 88.68% of the total variance in water quality parameters, respectively. It is indicated that total dissolved solids (TDS), electrical conductivity (EC), chlorides (Cl−), sodium (Na), sodium absorption ratio (SAR), and %Na were responsible for water quality variations which are mainly related to natural and anthropogenic pollution sources including climate effects, gypsum, and salt crystals in the supratidal of Zohreh river delta, fault zones of Chamshir I and II, drainage of sugarcane fields, and domestic and industrial wastewaters discharge into the river. DA reduced the data set to only seven parameters (discharge, temperature, electrical conductivity, HCO3-, Cl-, %Na, and T-Hardness), affording more than 58.5% correct assignations in temporal evaluations and describing responsible parameters for large variations in the quality of the Zohreh river.
Keywords: Zohreh River, Water quality, Principal component analysis, Discriminant analysis, Iran
Copyright and License Information
© 2019 The Author(s); Published by Hamadan University of Medical Sciences.
This is an open-access article distributed under the terms of the Creative Commons Attribution License (
http://creativecommons.org/licenses/by/4.0), which permits unrestricted use, distribution, and reproduction in any medium provided the original work is properly cited.
1. Introduction
A river system is considered as a complex of course and branches that receive a considerable amount of dissolved and particulate matters from natural and anthropogenic sources. The river quality may be impacted by several factors including the atmospheric and anthropogenic sources, basin lithology, and climatic conditions (1). Moreover, rivers can collect, transport and get directly impacted by municipal and industrial wastewaters (as constant pollution source), surface runoff (as seasonal pollution events) (2,3), seasonal variations in precipitation, interflow, and groundwater flow (4). Therefore, proper and precise information about the hydro-morphological, chemical, and biological characteristics is essential to conduct comprehensive river management plans. Moreover, the monitoring plans can provide valuable data on spatial and temporal variations of water quality parameters (5) that can be used to evaluate the river water quality (6-8).
Several multivariate statistical techniques are used to evaluate the spatial and temporal variations of rivers quality (9-14), among which principal component analysis (PCA) and discriminant analysis (DA) are frequently used for interpretation of complicated data matrices about water quality parameters. PCA and DA can evaluate the quality and ecological status of river systems and determine the possible impact factors or sources on water systems. This method would be a valuable approach for river water management which provide instant solutions to its pollution problems (4,8,9,15-17). Simeonov et al evaluated the surface water quality in Northern Greece and showed the requisite and utility of multivariate statistical analysis to assess large and complex databases, to plan sampling and analytical protocols and to control/manage the surface waters pollution sources (18). In another study, Singh et al studied the water quality of river Yamuna as the main river of India using statistical, trend, and time series analysis (19). Similarly, Razmkhah et al evaluated the spatial and temporal variation in water quality of Jajrood River in Tehran, Iran, and showed that PCA plots demonstrated temporal and spatial variations clearly (20).
In the present study, the data obtained from the stations in Zohreh river basin for the period of 1967-2013 were evaluated by PCA and DA. The results can be used to 1) study the variations of water quality parameters among 4 sampling stations and seasons in Zohreh river 2) recognize responsible parameters in deteriorations of river water during the studied years and 3) determine the effects of possible sources (natural and anthropogenic) of pollutions affecting water quality parameters at the Zohreh river.
2. Materials and Methods
2.1. Study Area
Zohreh river basin area drained by Zohreh river is located in the southwest of Iran (Fig. 1). This basin with a surface area of 13012 km2 is located between the latitude of 29°59′–30°15′ and the longitude of 49°25′–49°50′. Zohreh river is one of the longest watercourses in Iran, originating from southwest of Bushehr province in Mamasany and flows into Khuzestan province. The Zohreh river is limited to Maroon and Jarrahie watershed basin from the north and to Karoon, Kor and Genaveh watershed basin from the south. Finally, it impounds into the Persian Gulf. The catchment region with 16 033 km2 area is divided into 3 parts including mountainous (10 789 km2), lowland (5244 km2), and coastal areas (13). The average and annual discharges of Zohreh river are reported to be 87 m3/s and 2729 million m3/y, respectively. Additionally, the average sediment discharge, evaporation, and rainfall rates of Zohreh river are found to be 8 million tons, 3471 and 200 mm in a year, respectively (21). It is indicated as the main sources of surface water for agriculture and industrial activities are located in the region. The major drainages of river water for agricultural and industrial activities, human drinking and cattle breeding in Khuzestan province were estimated to be 2300.97, 78.108, and 11.2 million m3.y-1, respectively. The mainstream length of this river is 490 km, which is impacted by several pollution sources including both point and non-point sources (13).
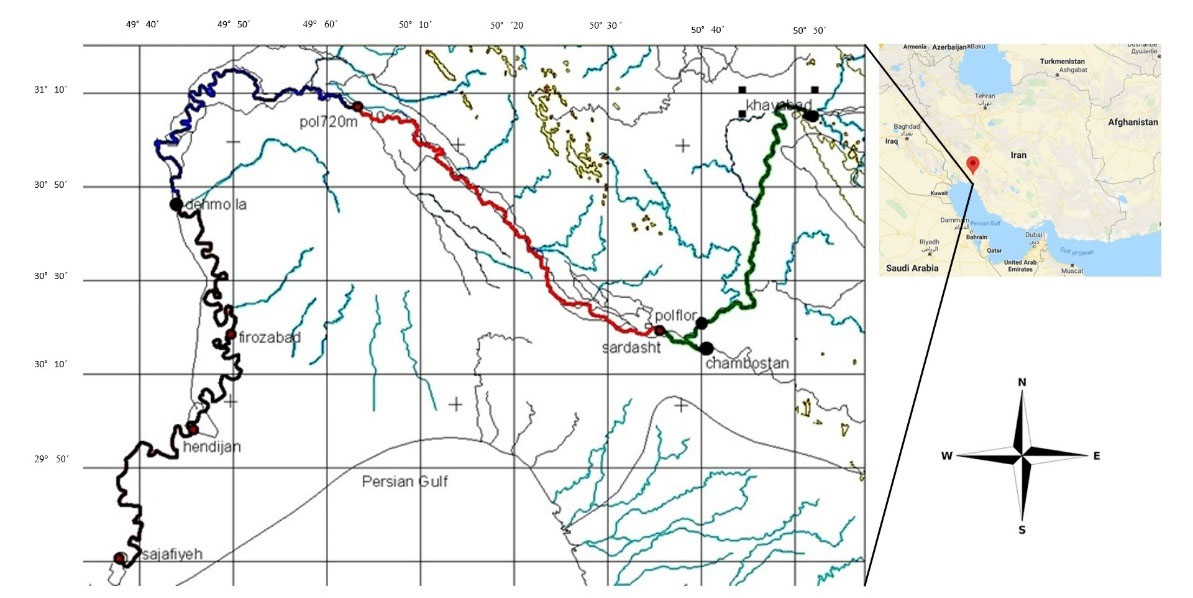
Figure 1.
Zohreh River Basin and Monitoring Stations.
.
Zohreh River Basin and Monitoring Stations.
2.2. Water Quality Parameters
These data sets were obtained from Khuzestan Water and Power Organization under the authority of the Ministry of Power of Iran, which controls and monitors water quality at streamflow gauging stations. Various water quality parameters from several water quality stations were monitored routinely. However, only 16 parameters were measured continuously in 4 stations including Kheirabad (Station 1), Poleflour (Station 2), Chambostan (Station 3), and Dehmolla (Station 4). The parameters were river water discharge (Q), water temperature (T), total dissolved solids (TDS), electrical conductivity (EC), bicarbonates (HCO3-), sulfates (SO4-2), chlorides (Cl−), sodium (Na), magnesium (Mg), potassium (K), calcium (Ca), Ca hardness (Ca-Hard), total hardness (T-Hard), pH, sodium absorption ratio (SAR), and sodium percentage.
2.3. Multivariate Statistical Analysis Methods
In this study, the variations of water quality parameters at the Zohreh river were assessed by correlation analysis. The data sets were grouped into 4 seasons: spring (March-May), summer (June-August), autumn (September-November), and winter (December-February). The temporal and spatial variations were assessed among the selected stations and seasons. The DA and PCA were selected for multivariate statistical analysis using SPSS version 16.0 software.
DA specifies the discriminant variables between 2 or more groups. The raw data used in DA create a discriminant function for each group as the following equation (22,23):
where i represents the number of groups (G), n is the number of parameters used to classify a data set into groups, ki is the constant inherent to each group, wj is the weight coefficient, assigned by DA to a given parameter (pj).
In the current study, the temporal (spring, summer, autumn, and winter) variations in the Zohreh river were evaluated by DA. The seasons were treated as dependent variables, and all the measured physical water quality parameters were used as the independent variables.
PCA technique was used to evaluate the spatial variations of water quality among the selected 4 sampling stations. PCA technique derives the eigenvectors and eigenvalues from the covariance matrix of the original variables. The uncorrelated (orthogonal) variable calculated by multiplying eigenvector by original correlated variables is called principal component. Therefore, the weighted linear values of the original variables are the PCs. Accordingly, valuable information about the most significant parameters is known by PCs. This information explains the whole data set with data reduction and the lowest loss of initial information (4,20,24). This technique is quite strong for pattern recognition which is used to show the variance of a vast set of inter-correlated variables. The principal component (PC) can be demonstrated as equation 2 (25):
(2)
where z, a, and i represent the component score, loading, and number, respectively, x and m are the measured value and the total number of variables, and j is the sample number.
3. Results and Discussion
3.1. Water Characterization of Zohreh River
Table 1 provides a summary of the 16 measured water quality parameters at 4 stations and the guideline values set by the European Economic Community (EEC) Drinking Water Directive (80/778/EEC) for water quality intended for human consumption. It was found that the mean concentration of some parameters such as T, TDS, EC, and T-Hard was higher than the recommended standard levels at all stations. The pH values of water ranged from 7.58 to 7.89 in all stations during the sampling periods. These results demonstrated that the pH value of the Zohreh river was mostly neutral in nature. The mean value of EC ranged from 1700 to 3064 µS/cm which was higher than that of Loudias river in Greece (18) and Jajrood river in Iran (20). The higher values were generally noticed in stations 1 and 4. Similarly, EC and TDS values ranged from 982 to 1958 mg/L which were significantly higher in stations 1 and 4. Total hardness was significantly higher than the standard level at all stations. The abundance of the major ions in river water was in the following order: Cl > Na > SO4-2> Ca >> Mg > HCO-3 > K.
Table 1.
The Mean ± SDValues of Water Quality Parameters in the Studied Stations at the Zohreh River
|
Parameters
|
Abbreviation
|
Unit
|
Station 1
|
Station 2
|
Station 3
|
Station 4
|
Guideline Levels for Human Consumption (28)
|
| Discharge |
Q |
m3/s |
26.8± 51.63 |
50.37 ± 154.81 |
30.08 ± 49.41 |
86.07 ± 130.46 |
- |
| Temperature |
WT |
°C |
22.78 ± 16.05 |
21.52 ± 4.68 |
20.35 ± 4.62 |
22.16 ± 5.67 |
12 |
| pH |
pH |
unitless |
7.89 ± 0.29 |
7.89 ±0.26 |
7.85 ± 0.24 |
7.58 ± 0.27 |
6.5-8.5 |
| Total dissolved solids |
TDS |
mg/L |
1912.85 ± 523.77 |
1176 ± 297.04 |
982.61 ± 735.15 |
1958.17 ± 685.66 |
500 |
| Electrical conductivity |
EC |
µS/cm |
3000.38 ± 825.67 |
1701.36 ± 456.74 |
1389.59 ± 364.97 |
3064.25 ± 1099.02 |
400 (at 20°C) |
| Alkalinity |
HCO3- |
mg/L |
2.42 ± 0.47 |
2.193 ±0.45 |
2.42 ± 0.45 |
2.41 ± 0.49 |
30 |
| chloride ion |
Cl - |
mg/L |
20.20 ± 8.06 |
5.56 ± 3.28 |
5.00 ± 2.69 |
20.184 ± 11.42 |
25 |
| Sulfate ion |
SO4-2 |
mg/L |
7.56 ± 2.95 |
10.27 ± 3.55 |
7.04 ± 2.79 |
8.74 ± 3.55 |
25 |
| Calcium |
Ca |
mg/L |
7.35 ± 2.43 |
9.50 ± 3.4 |
7.09 ± 2.59 |
8.01 ± 2.53 |
100 |
| Magnesium |
Mg |
mg/L |
2.96 ± 1.01 |
3.20 ± 1.05 |
2.57 ± 0.81 |
3.51 ± 1.79 |
30 |
| Sodium |
Na |
mg/L |
19.96 ± 8.21 |
5.34 ± 3.22 |
4.78 ± 2.1 |
19.48 ± 9.72 |
20 |
| Potassium |
K |
mg/L |
0.10 ± 0.13 |
0.07 ± 0.02 |
0.6 ± 0.42 |
0.10 ± 0.78 |
10 |
| Total hardness |
T-Hard |
mg/L CaCO3 |
515.63 ± 134.73 |
635.84 ± 187.48 |
483.72 ± 145.01 |
576.32 ± 176.26 |
60 |
| Ca-hardness |
Ca- Hard |
mg/L CaCO3 |
121.417 ± 23.38 |
109.96 ± 187.48 |
121.70 ± 22.88 |
120.47 ± 24.81 |
- |
| Sodium absorption rate |
SAR |
- |
9.06 ± 3.83 |
2.22 ± 1.44 |
2.20 ± 1.11 |
8.17 ± 3.61 |
< 18(26) |
| Sodium percentage |
Na% |
% |
62.65 ± 14.37 |
28.79 ± 10.47 |
31.59 ± 9.31 |
59.18 ± 13.28 |
< 60(26) |
Electrical conductivity, sodium percentage, and SAR were used to assess the river water quality for agricultural activities. Sodium percentage is a good measure of hazard to crops since it decreases the osmotic activity of plants. SAR measures the alkali/sodium hazard to crops. The high concentration of sodium increases the adsorption of sodium ions by clay particles and dislocation by Mg2+ and Ca2+ ions which led to low soil permeability and poor internal drainage of soil (26). The results showed that sodium percentage was higher than permissible limits at station 1.
3.2. Temporal Variations in Water Quality of Zohreh River
Temporal variations of water quality parameters in Zohreh river were assessed by correlation analysis (Table 2). The major source of temporal variations can be attributed to the season-correlated parameters. The results showed that all the 16 studied parameters were significantly correlated with the season (P<0.01), except for EC, pH, Cl, and Na. It could be suggested that natural and anthropogenic pollution sources in the Zohreh river basin may be the main reason for variation in this water quality parameters.
Table 2.
Correlation of Physicochemical Parameters of Water, Season, Water Discharge, and Temperature
|
|
Season
|
Q
|
WT
|
TDS
|
EC
|
pH
|
HCO
3
-
|
Cl
|
SO
4
-2
|
Ca
|
Mg
|
Na
|
K
|
SAR
|
%Na
|
Ca-Hard
|
T-Hard
|
| Season |
1 |
|
|
|
|
|
|
|
|
|
|
|
|
|
|
|
|
| Q |
0.07** |
1 |
|
|
|
|
|
|
|
|
|
|
|
|
|
|
|
| WT |
-0.66** |
-0.25** |
1 |
|
|
|
|
|
|
|
|
|
|
|
|
|
|
| TDS |
0.067** |
0.09** |
0.21** |
1 |
|
|
|
|
|
|
|
|
|
|
|
|
|
| EC |
0.05 |
0.09** |
0.22** |
0.97** |
1 |
|
|
|
|
|
|
|
|
|
|
|
|
| pH |
0.001 |
0.03 |
0.023 |
-0.07** |
-0.059* |
1 |
|
|
|
|
|
|
|
|
|
|
|
| HCO3- |
0.14** |
-0.036 |
-0.18** |
0.042 |
0.048 |
-0.265** |
1 |
|
|
|
|
|
|
|
|
|
|
| Cl |
-0.03 |
0.062* |
0.29** |
0.87** |
0.913** |
0.036 |
0.068** |
1 |
|
|
|
|
|
|
|
|
|
| SO4-2 |
0.25** |
0.002 |
-0.09** |
0.39** |
0.344** |
-0.179** |
-0.144** |
0.053* |
1 |
|
|
|
|
|
|
|
|
| Ca |
0.29** |
0.03 |
-0.19** |
0.36** |
0.308** |
-0.247** |
-0.01 |
0.015 |
0.890** |
1 |
|
|
|
|
|
|
|
| Mg |
0.11** |
-0.19** |
0.19** |
0.52** |
0.518** |
-0.119** |
0.015 |
0.421** |
0.510** |
0.332** |
1 |
|
|
|
|
|
|
| Na |
-0.03 |
0.08** |
0.28** |
0.86** |
0.905** |
0.054* |
.068** |
0.992** |
0.051* |
-0.002 |
0.404** |
1 |
|
|
|
|
|
| K |
0.08** |
0.04 |
0.15** |
0.710** |
0.696** |
-0.044 |
0.015 |
0.586** |
0.450** |
0.423** |
0.452** |
0.581** |
1 |
|
|
|
|
| SAR |
-0.08** |
0.1** |
0.3** |
0.794** |
0.841** |
0.094** |
0.065* |
0.972** |
-0.103** |
-0.158** |
0.300** |
0.981** |
0.498** |
1 |
|
|
|
| %Na |
-0.12** |
0.14** |
0.3** |
0.716** |
0.770** |
0.118** |
0.065** |
0.928** |
-0.232** |
-0.286** |
0.200** |
0.940** |
0.418** |
0.983** |
1 |
|
|
| Ca-Hard |
0.13** |
-0.043 |
-0.17** |
0.042 |
0.048 |
-0.254** |
0.997** |
0.069** |
-0.145** |
-0.011 |
0.017 |
0.069** |
0.015 |
0.066** |
0.066** |
1 |
|
| T-Hard |
0.28** |
-0.03 |
-0.1** |
0.462** |
0.411** |
-0.263** |
-0.008 |
0.119** |
0.929** |
0.942** |
0.579** |
0.100** |
0.493** |
-0.065* |
-0.203** |
-0.008 |
1 |
** Correlation is significant at the 0.01 level (2-tailed), * and 0.05 level (2-tailed).
According to the results, the highest correlation coefficient belonged to the temperature (Spearman’s R = - 0.66) followed by Ca (Spearman’s R= 0.29). The vast seasonal differences in temperature can be assigned to the notable climate differences in the region (27). The basin area is located in arid and semi-arid zones of Iran characterized by long hot summer (52°C) and short moderate winter (1°C) (13).
The average water discharge (Table 1) was the highest in the station 4 as received discharges of domestic wastewaters and drainage of agricultural lands located in this area. Similarly, the highest river water temperature and EC values belonged to station 1, followed by station 4 (Table 2). They may result from high loading of dissolved organic matter due to the discharge of raw and treated domestic wastewater at the upstream areas of the monitoring stations. The concentrations of Na, Cl, and TDS were similarly high in stations 1 and 4, which confirm the high load of water withdrawals for irrigation located in the Zohreh basin.
To evaluate temporal variations in water quality, the DA was applied. Discriminant functions and classification matrices are shown in Tables 3 and 4, including 7 discriminant functions which yielded classification matrices allocating 58.5% of the cases correctly. According to the results of DA, the parameters responsible for the most expected temporal variations in the water quality of the Zohreh river were Q, T, EC, HCO3-, Cl, %Na, and T-Hard, which discriminate between the 4 selected seasons.
Table 3.
Discriminant Functions for Discriminant Analysis of Temporal Variations in Water Quality of the Zohre River Basin
|
|
Season
|
|
Spring
|
Summer
|
Autumn
|
Winter
|
| Q |
0.007 |
0.004 |
0.004 |
0.007 |
| WT |
0.603 |
0.632 |
0.496 |
0.391 |
| EC |
-0.017 |
-0.016 |
-0.016 |
-0.016 |
| HCO3- |
10.350 |
9.938 |
10.679 |
10.700 |
| Cl |
-0.481 |
-0.430 |
-0.471 |
-0.492 |
| %Na |
1.197 |
1.134 |
1.169 |
1.180 |
| T-Hard |
0.086 |
0.084 |
0.087 |
0.089 |
| (Constant) |
-50.065 |
-48.511 |
-49.012 |
-48.287 |
Table 4.
Classification Functions (Equation 3) for Discriminant Analysis of Temporal Variations in Water Quality of the Zohre River Basin
|
Monitoring Seasons
|
% Correct Assignations
|
Season Assigned by DA
|
Total
|
|
Spring
|
Summer
|
Autumn
|
Winter
|
| Spring |
56.5 |
222 |
90 |
44 |
37 |
393 |
| Summer |
50.1 |
153 |
191 |
37 |
0 |
381 |
| Autumn |
47.9 |
69 |
61 |
186 |
72 |
388 |
| Winter |
79.1 |
11 |
5 |
66 |
310 |
392 |
| Total |
58.5 |
|
|
|
|
|
The plots of the parameters resulted from DA are illustrated in Fig. 2. The average water discharge of the Zohreh river was higher in seasons with more precipitation; springs and winters compared with autumn and summer (Fig. 2A). The highest and lowest average temperatures were observed in summers and winters (Fig. 2B). Moreover, a reverse correlation was obtained between river temperature and water discharge (Fig. 2C, Table 3), which may represent high seasonality effects. Naturally, high temperature led to high evaporation that cause less water discharge. The annual mean rainfall and evaporation rates in Zohreh river basin are 200 mm and 3471 mm (27). The maximum temperature of the basin in summers reached 52°C, whereas the minimum temperature was 1°C in winters (13). The EC values followed a reverse trend with discharge, which indicated the dilution effects of the seasons (Fig. 2D, Table 3). Similar temporal variations in the values of EC and water discharge were also reported by Shrestha (18). The dissolution of salts in summers may lead to an elevation in the values of EC. Moreover, the dilution effects in spring resulted from seasonal precipitations in the basin. Cl concentration (Fig. 2E) showed the same increasing trend in summers and declining trend in springs due to excessive dilution and high precipitation effects. The alkalinity of river water was higher in winter and spring in comparison with summer and autumn. The natural weathering pathway including the reaction of the carbonic acid with minerals may lead to produce dissolved inorganic carbons, mainly HCO3- (29). The average sodium percentages followed a similar trend to discharge (Fig. 2F). This study demonstrated a high amount of sodium at the upstream point of the Zohreh river may result from important faults located in Chamshir zones which led to intrusion of sulfate and chloride brackish water in station 1. This phenomenon caused an increase in the salinity of the Zohre River water (13,27). Finally, there was an increasing trend for total hardness (Fig. 2G) that was the highest in winter and lowest in spring seasons. Dissolved metals mainly originated from domestic sewage discharges to the river and industrial and agricultural drainages especially sugarcane cultivation drainage (27) that led to high water hardness. Sugarcane cultivation started in 12000 hectares in 1985 in Khuzestan province and continued up to now that led to intensive land use with severe ecological impacts. Therefore, the water quality of the Zohreh river basin was impacted significantly by anthropogenic pollution during the studied time.
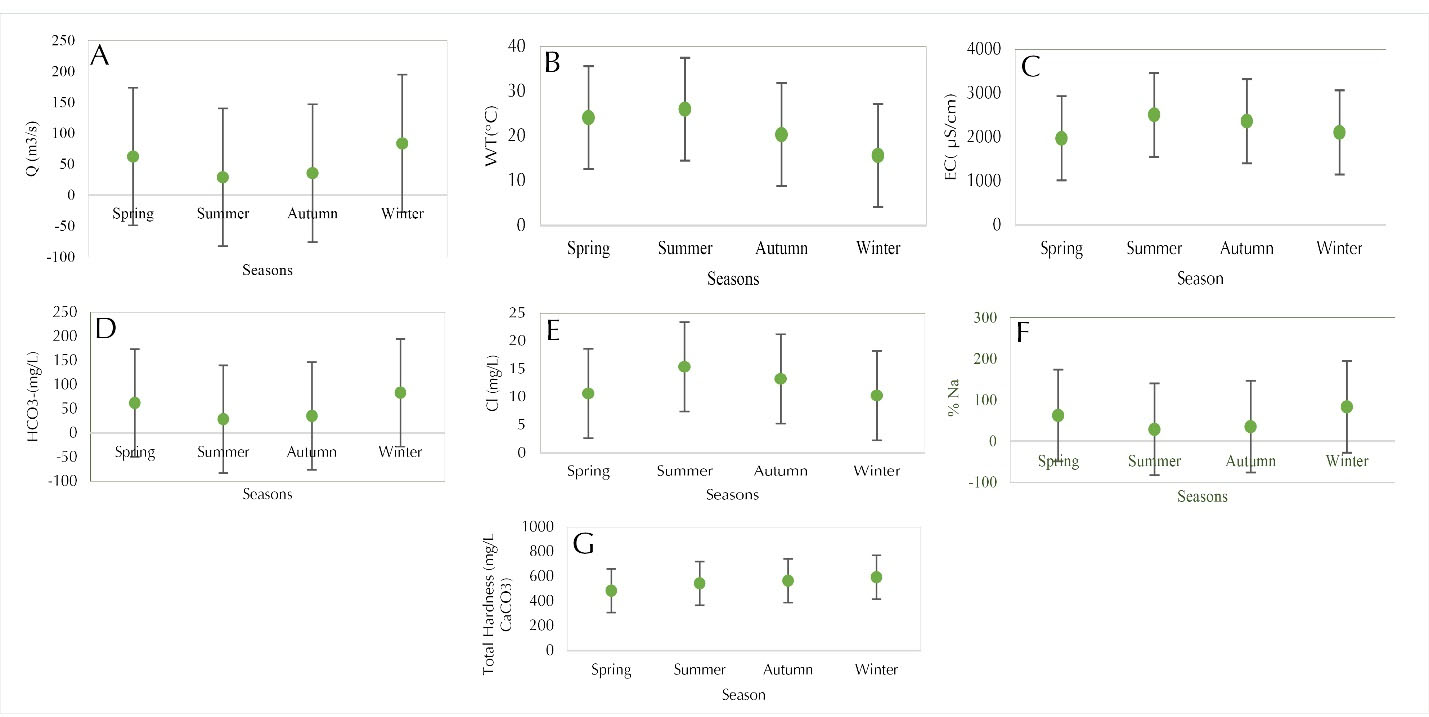
Figure 2.
Temporal Variations of Water Quality Parameters; (A) Discharge, (B) Water Temperature, (C) EC, (D) HCO3-, (E) Cl, (F) %Na, and (G) T-Hard in the Zohreh River.
.
Temporal Variations of Water Quality Parameters; (A) Discharge, (B) Water Temperature, (C) EC, (D) HCO3-, (E) Cl, (F) %Na, and (G) T-Hard in the Zohreh River.
The PCA was applied to compare the compositional patterns among the water quality parameters and identify the factors that influence each other (30). The input data matrices (variables-cases) for PCA were [16-203] for station 1, [16-277] for station 2, [16-533] for station 3 and [16-541] for station 4. PCA resulted in 4 PCs for the stations 1, 2, and 3 and 3 PCs for station 4 with Eigenvalues >1, showing 78.985%, 83.828%, 77.648%, and 77.68% of the total variance in respective data sets. The significance of the factors was evaluated by Eigenvalue. Eigenvalues of 1.0 or greater are considered significant (31). The most significant factors were obtained by the highest Eigenvalues. Table 5 demonstrates the corresponding PCs, variable loadings, and explained variance. Based on the classification represented by Liu et al (32), the factors of “strong”, “‘moderate” and “weak”, corresponded to the values of >0.75, 0.75- 0.50, and 0.50-0.30, respectively.
Table 5.
Loadings of Experimental Variables (
16) on Significant Principal Components for Data Sets of 4 Studied Stations
|
Variables
|
PC1
|
PC2
|
PC3
|
PC4
|
| Kheirabad; Station 1 (4 significant principal components) |
| Q |
-0.084 |
0.171 |
-0.076 |
0.47 |
| WT |
0.095 |
-0.094 |
-0.058 |
-0.49 |
| pH |
0.085 |
-0.282 |
-0.237 |
0.585 |
| TDS |
0.936
|
0.111 |
0.04 |
-0.028 |
| EC |
0.987
|
0.038 |
0.042 |
-0.043 |
| HCO3- |
0.055 |
-0.027 |
0.97
|
-0.124 |
| Cl |
0.972
|
-0.188 |
0.041 |
-0.058 |
| SO4-2 |
-0.01 |
0.941
|
-0.116 |
0.071 |
| Ca |
-0.108 |
0.917
|
0.031 |
0.159 |
| mg |
0.101 |
0.409 |
0.097 |
-0.452 |
| Na |
0.977
|
-0.172 |
0.025 |
-0.037 |
| K |
0.174 |
0.121 |
0.413 |
0.407 |
| T-Hard |
-0.06 |
0.984
|
0.064 |
-0.026 |
| Ca- Hard |
0.054 |
-0.035 |
0.968
|
-0.112 |
| SAR |
0.932
|
-0.332 |
0.001 |
0.001 |
| %Na |
0.771
|
-0.575 |
0.041 |
-0.017 |
| Eigenvalue |
8.015 |
3.571 |
2.168 |
1.253 |
| % Total variance |
52.185 |
18.795 |
11.413 |
6.592 |
| % Cumulative variance |
52.185 |
70.98 |
82.393 |
88.985 |
| Poleflour; Station 2 (4 significant principal components) |
| Q |
0.058 |
-0.002 |
-0.08 |
-0.709 |
| WT |
-0.193 |
0.128 |
-0.083 |
0.638 |
| pH |
-0.574 |
0.111 |
-0.198 |
0.031 |
| TDS |
0.811 |
0.507 |
0.093 |
0.059 |
| EC |
0.738 |
0.639 |
0.089 |
0.059 |
| HCO3 |
0.162 |
0.043 |
0.982
|
0.005 |
| Cl |
0.114 |
0.978
|
0.03 |
0.096 |
| So4 |
0.975
|
-0.172 |
-0.024 |
-0.027 |
| Ca |
0.92
|
-0.188 |
0.093 |
-0.23 |
| mg |
0.507 |
0.067 |
0.003 |
0.641 |
| Na |
0.067 |
0.985
|
0.038 |
0.093 |
| K |
0.607 |
0.22 |
0.11 |
-0.022 |
| T-Hard |
0.977
|
-0.152 |
0.086 |
-0.029 |
| Ca- Hard |
0.156 |
0.048 |
0.982
|
0.008 |
| SAR |
-0.103 |
0.984 |
0.012 |
0.062 |
| %Na |
-0.441 |
0.849 |
-0.024 |
0.161 |
| Eigenvalue |
6.736 |
5.699 |
2.049 |
1.443 |
| % Total variance |
45.452 |
29.996 |
10.784 |
7.597 |
| % Cumulative variance |
45.452 |
75.448 |
86.232 |
93.828 |
| Chambostan; Station 3 (4 significant principal components) |
| Q |
0.018 |
-0.009 |
-0.1 |
-0.718 |
| WT |
-0.067 |
0.076 |
-0.183 |
0.654 |
| pH |
-0.282 |
0.104 |
-0.449 |
0.045 |
| TDS |
0.447 |
0.175 |
0.12 |
0.272 |
| Ec |
0.68 |
0.704 |
0.042 |
-0.008 |
| HCO3 |
-0.072 |
0.042 |
0.977
|
0 |
| Cl |
0.135 |
0.977
|
0.008 |
0.096 |
| So4 |
0.964
|
-0.053 |
-0.059 |
-0.143 |
| Ca |
0.582 |
0.136 |
0.103 |
0.423 |
| Mg |
0.1 |
0.985
|
-0.002 |
0.086 |
| Na |
0.422 |
0.092 |
-0.065 |
0.154 |
| T-Hard |
0.977
|
-0.049 |
0.07 |
-0.122 |
| Ca- Hard |
-0.073 |
0.046 |
0.972
|
0.002 |
| SAR |
-0.106 |
0.981
|
-0.024 |
0.126 |
| %Na |
-0.517 |
0.757 |
-0.051 |
0.256 |
| Eigenvalue |
5.559 |
5.557 |
2.199 |
1.438 |
| % Total variance |
39.261 |
29.245 |
11.574 |
7.569 |
| % Cumulative variance |
39.261 |
68.505 |
80.079 |
88.648 |
| Dehmolla; Station 4 (3 significant principal components) |
| Q |
-0.527 |
0.092 |
-0.105 |
|
| WT |
0.581 |
-0.064 |
-0.304 |
|
| pH |
-0.009 |
-0.184 |
-0.336 |
|
| TDS |
0.792
|
0.549 |
0.107 |
|
| Ec |
0.846
|
0.483 |
0.101 |
|
| HCO3 |
0.071 |
0.042 |
0.977
|
|
| Cl |
0.849
|
0.297 |
0.041 |
|
| So4 |
0.019 |
0.937
|
0.028 |
|
| Ca |
-0.225 |
0.855
|
0.201 |
|
| Mg |
0.436 |
0.672 |
0.132 |
|
| Na |
0.929
|
0.313 |
0.068 |
|
| K |
0.348 |
0.559 |
-0.041 |
|
| T-Hard |
0.061 |
0.958
|
0.212 |
|
| Ca- Hard |
0.072 |
0.042 |
0.976
|
|
| SAR |
0.975
|
0.007 |
-0.018 |
|
| %Na |
0.915
|
-0.289 |
-0.03 |
|
| Eigenvalue |
7.738 |
4.738 |
2.284 |
|
| % Total variance |
50.727 |
24.935 |
12.019 |
|
| % Cumulative variance |
50.727 |
75.662 |
88.68 |
|
For station 1, among 4 PCs, PC1, representing 52.185% of the total variance, had the moderate positive loading on TDS, EC, Cl, Na, SAR, and %Na. PC2, accounting for 18.795% of the total variance, had weak positive loadings on SO4, Ca, and total hardness. PC3, accounting for 11.413% of the total variance, had weak positive loading on HCO3 and Ca hardness. PC1 explains the mineral component of the river water that contributed to water salinity. This classification of parameters pointed out the common origin from the dissolution of limestone and gypsum soils (13). The Zohreh river delta is known as one of the largest deltaic plains along the northern coast of the Persian Gulf. Due to the fact that Zohreh river basin has dominantly arid climate, in supratidal and intertidal zones of Zohreh delta, gypsum and salt crystal are frequently grown (21). Moreover, some literature indicated that there is an increasing trend in the salinity of the Zohreh river because of the huge drainage of sugarcane fields, discharge of industrial and domestic wastewaters, heavy evaporation due to the hot weather in the region, and infiltration of brine water of Persian Gulf into the Zohreh river (13,21,27,33). Electrical conductivity, SAR, and % NA serve as useful and reliable measures of water salinity (34). For the data set representing the station 2, among total 4 significant PCs (93.82%), PC1, accounting for 55.452% of the total variance, showed moderate positive effects on TDS, SO4, Ca, and total hardness. This factor represents the contribution of non-point source pollution caused by Chamshir faults I and II zone which is the main cause of the salinity of Zohreh river, resulting in the intrusion of sulfate brackish and chloride brine waters to Zohreh river (13,35). PC2, accounting for 29.96% of the total variance, has weak positive loading on Na, Cl, and SAR, which similarly showed the hazard of salinity in this river. PC3, explaining about 10.784 % of the total variance, had weak positive loadings on HCLO3 and Ca-Hard. This varifactor showed that hydrolysis of Ca, Na, Cl, and SO4 can cause an increase in water Ca hardness and alkalinity. PC4, explaining 7.59 % of the total variance, had weak positive loadings on Mg, water discharge, and temperature. This factor represents the erosion effect and increase of water discharge due to the drainage of rural, agricultural, urban and industrial areas along the river and discharge into the Zohreh river (13) which led to the increase of water discharge and temperature. PC1 for station 3 explained 49.26% of the variance and moderately contributed to SO4, total hardness, EC, and Ca. PC2 explained 29.245% of the variance and positively contributed to Cl, Mg, and SAR. PC3 explained 11.574% of variance that positively contributed to HCO3- and Ca hardness. PPC (7.569% of variance) had weak negative loading on water discharge and positive loading on water temperature. This factor can be explained taking into account the effect of huge evaporation on decreasing river water dischargein this station. Finally, for the data set pertaining to water quality in station 4, which explained 88.68% of total variance, PC1 explaining 50.727% of variance moderately contributed to TDS, EC, Cl, and Na. These factors can be interpreted as representing influences from nonpoint sources mentioned before. PC2, explaining 24.93% of the total variance, had weak positive loadings on SO4, Ca, and total hardness and PC3, explaining 12.01% of the total variance, had weak positive loadings on HCO3-and Ca hardness.
4. Conclusion
There are numerous complicated data sets in any monitoring programs that require multivariate statistical treatment for analyzing and interpreting the information. DA, for 4 stations of the basin, reduced largely in data sets, as it used only seven parameters (water discharge, water temperature, electrical conductivity, alkalinity, total hardness, Cl concentration, and % Na) affording more than 58.5% correct assignations in temporal analysis. Therefore, DA was applied successfully in statistical analyzing to reduce the dimension of the huge data set and describe fewer parameters responsible for large variations in water quality. Moreover, 4 PCs obtained from PCA indicate that the parameters responsible for the deterioration of the water quality of Zohre river are mainly related to soluble salts (anthropogenic) and salinity pollution load (natural). Accordingly, it is suggested that effective management of river water quality may be achieved by using multivariate statistical techniques, which are useful tools for the analysis and interpretation of complex data sets, Moreover, these techniques are useful in evaluating water quality, distinguishing pollution sources and investigating temporal and spatial variations in water quality parameters.
Conflict of interests
The authors declare no conflict of interests.
Funding
The authors declare that this study received no funding by any organization.
References
- Bricker OP, Jones BF. Main factors affecting the composition of natural waters. In: Salbu B, Steinnes E, eds. Trace Elements in Natural Waters. Boca Raton: CRC Press; 1995. p. 1-20.
- Singh KP, Basant A, Malik A, Jain G. Artificial neural network modeling of the river water quality—a case study. Ecol Modell 2009; 220(6):888-95. doi: 10.1016/j.ecolmodel.2009.01.004 [Crossref] [ Google Scholar]
- Xie M, Liao J, Wang T, Zhu K, Zhuang B, Han Y. Modeling of the anthropogenic heat flux and its effect on regional meteorology and air quality over the Yangtze River Delta region, China. Atmos Chem Phys 2016; 16(10):6071-89. doi: 10.5194/acp-16-6071-2016 [Crossref] [ Google Scholar]
- Vega M, Pardo R, Barrado E, Debán L. Assessment of seasonal and polluting effects on the quality of river water by exploratory data analysis. Water Res 1998; 32(12):3581-92. doi: 10.1016/s0043-1354(98)00138-9 [Crossref] [ Google Scholar]
- Dixon W, Chiswell B. Review of aquatic monitoring program design. Water Res 1996; 30(9):1935-48. doi: 10.1016/0043-1354(96)00087-5 [Crossref] [ Google Scholar]
- Bu H, Tan X, Li S, Zhang Q. Temporal and spatial variations of water quality in the Jinshui River of the South Qinling Mts, China. Ecotoxicol Environ Saf 2010; 73(5):907-13. doi: 10.1016/j.ecoenv.2009.11.007 [Crossref] [ Google Scholar]
- Chang H. Spatial analysis of water quality trends in the Han River basin, South Korea. Water Res 2008; 42(13):3285-304. doi: 10.1016/j.watres.2008.04.006 [Crossref] [ Google Scholar]
- Fan X, Cui B, Zhao H, Zhang Z, Zhang H. Assessment of river water quality in Pearl River Delta using multivariate statistical techniques. Procedia Environ Sci 2010; 2:1220-34. doi: 10.1016/j.proenv.2010.10.133 [Crossref] [ Google Scholar]
- Wang J, Liu G, Liu H, Lam PKS. Multivariate statistical evaluation of dissolved trace elements and a water quality assessment in the middle reaches of Huaihe River, Anhui, China. Sci Total Environ 2017; 583:421-31. doi: 10.1016/j.scitotenv.2017.01.088 [Crossref] [ Google Scholar]
- Wang X, Cai Q, Ye L, Qu X. Evaluation of spatial and temporal variation in stream water quality by multivariate statistical techniques: a case study of the Xiangxi River basin, China. Quat Int 2012; 282:137-44. doi: 10.1016/j.quaint.2012.05.015 [Crossref] [ Google Scholar]
- Wang Y, Wang P, Bai Y, Tian Z, Li J, Shao X. Assessment of surface water quality via multivariate statistical techniques: a case study of the Songhua River Harbin region, China. J Hydro-Environ Res 2013; 7(1):30-40. doi: 10.1016/j.jher.2012.10.003 [Crossref] [ Google Scholar]
- Zhang Q, Li Z, Zeng G, Li J, Fang Y, Yuan Q. Assessment of surface water quality using multivariate statistical techniques in red soil hilly region: a case study of Xiangjiang watershed, China. Environ Monit Assess 2009; 152(1-4):123-31. doi: 10.1007/s10661-008-0301-y [Crossref] [ Google Scholar]
- Ahmadi M, Ravanbakhsh M, Ahmadi K, Ramavandi B. Trend analysis of long-term water quality for Zohre river water, Iran. Pollut Res 2015; 34(3):489-96. [ Google Scholar]
- Parsimehr M, Shayesteh K, Godini K, Bayat Varkeshi M. Using multilayer perceptron artificial neural network for predicting and modeling the chemical oxygen demand of the Gamasiab River. Avicenna J Environ Health Eng 2018; 5(1):15-20. doi: 10.15171/ajehe.2018.03 [Crossref] [ Google Scholar]
- Magyar N, Hatvani IG, Székely IK, Herzig A, Dinka M, Kovács J. Application of multivariate statistical methods in determining spatial changes in water quality in the Austrian part of Neusiedler See. Ecol Eng 2013; 55:82-92. doi: 10.1016/j.ecoleng.2013.02.005 [Crossref] [ Google Scholar]
- Filik Iscen C, Emiroglu O, Ilhan S, Arslan N, Yilmaz V, Ahiska S. Application of multivariate statistical techniques in the assessment of surface water quality in Uluabat Lake, Turkey. Environ Monit Assess 2008; 144(1-3):269-76. doi: 10.1007/s10661-007-9989-3 [Crossref] [ Google Scholar]
- Barakat A, El Baghdadi M, Rais J, Aghezzaf B, Slassi M. Assessment of spatial and seasonal water quality variation of Oum Er Rbia River (Morocco) using multivariate statistical techniques. Int Soil Water Conserv Res 2016; 4(4):284-92. doi: 10.1016/j.iswcr.2016.11.002 [Crossref] [ Google Scholar]
- Simeonov V, Stratis JA, Samara C, Zachariadis G, Voutsa D, Anthemidis A. Assessment of the surface water quality in Northern Greece. Water Res 2003; 37(17):4119-24. doi: 10.1016/S0043-1354(03)00398-1 [Crossref] [ Google Scholar]
- Parmar KS, Bhardwaj R. Statistical, time series, and fractal analysis of full stretch of river Yamuna (India) for water quality management. Environ Sci Pollut Res Int 2015; 22(1):397-414. doi: 10.1007/s11356-014-3346-1 [Crossref] [ Google Scholar]
- Razmkhah H, Abrishamchi A, Torkian A. Evaluation of spatial and temporal variation in water quality by pattern recognition techniques: a case study on Jajrood River (Tehran, Iran). J Environ Manage 2010; 91(4):852-60. doi: 10.1016/j.jenvman.2009.11.001 [Crossref] [ Google Scholar]
- Gharibreza M, Habibi A, Imamjomeh SR, Ashraf MA. Coastal processes and sedimentary facies in the Zohreh River Delta (Northern Persian Gulf). Catena 2014; 122:150-8. doi: 10.1016/j.catena.2014.06.010 [Crossref] [ Google Scholar]
- Alberto WD, del Pilar DM, Valeria AM, Fabiana PS, Cecilia HA, de los Ángeles BM. Pattern recognition techniques for the evaluation of spatial and temporal variations in water quality A Case Study: Suquı́a River Basin (Córdoba–Argentina). Water Res 2001; 35(12):2881-94. doi: 10.1016/s0043-1354(00)00592-3 [Crossref] [ Google Scholar]
- Singh KP, Malik A, Mohan D, Sinha S. Multivariate statistical techniques for the evaluation of spatial and temporal variations in water quality of Gomti River (India)—a case study. Water Res 2004; 38(18):3980-92. doi: 10.1016/j.watres.2004.06.011 [Crossref] [ Google Scholar]
- Helena B, Pardo R, Vega M, Barrado E, Fernandez JM, Fernandez L. Temporal evolution of groundwater composition in an alluvial aquifer (Pisuerga River, Spain) by principal component analysis. Water Res 2000; 34(3):807-16. doi: 10.1016/s0043-1354(99)00225-0 [Crossref] [ Google Scholar]
- Varol M, Gökot B, Bekleyen A, Şen B. Spatial and temporal variations in surface water quality of the dam reservoirs in the Tigris River basin, Turkey. Catena 2012; 92:11-21. doi: 10.1016/j.catena.2011.11.013 [Crossref] [ Google Scholar]
- Subramani T, Elango L, Damodarasamy SR. Groundwater quality and its suitability for drinking and agricultural use in Chithar River Basin, Tamil Nadu, India. Environ Geol 2005; 47(8):1099-110. doi: 10.1007/s00254-005-1243-0 [Crossref] [ Google Scholar]
- Ghraib Reza M, Masoumi H. Zohreh River Morphology and its variation in Hendijan Delta. Proceedings of the 7th International River Engineering Conference; 2007; Shahid Chamran University, Ahvaz.
- Directive C. 80/778/EEC of 15 July 1980 relating to the quality of water intended for human consumption as amended by Council Directives 81/858/EEC and 91/692. EEC (further amended by Council Regulation 1882/2003/EC).
- Mortatti J, Probst J-L. Silicate rock weathering and atmospheric/soil CO2 uptake in the Amazon basin estimated from river water geochemistry: seasonal and spatial variations. Chem Geol 2003; 197(1-4):177-96. doi: 10.1016/s0009-2541(02)00349-2 [Crossref] [ Google Scholar]
- Singh S, Raju NJ, Gossel W, Wycisk P. Assessment of pollution potential of leachate from the municipal solid waste disposal site and its impact on groundwater quality, Varanasi environs, India. Arab J Geosci 2016; 9(2):131. doi: 10.1007/s12517-015-2131-x [Crossref] [ Google Scholar]
- Kim JO, Mueller CW. Introduction to Factor Analysis: What it is and How to do it (Quantitative Applications in the Social Sciences). Newbury Park: Sage University Press; 1987.
- Liu CW, Lin KH, Kuo YM. Application of factor analysis in the assessment of groundwater quality in a blackfoot disease area in Taiwan. Sci Total Environ 2003; 313(1-3):77-89. doi: 10.1016/s0048-9697(02)00683-6 [Crossref] [ Google Scholar]
- Karami Khaniki A, Goudarzi M, Dehghani M, Mousavi S. Application of MIKE21 software in flood routing of tidal rivers: a case study of the Zohre River. Water and Wastewater 2007; 17(60):89-96. [ Google Scholar]
- Ogunfowokan AO, Obisanya JF, Ogunkoya OO. Salinity and sodium hazards of three streams of different agricultural land use systems in Ile-Ife, Nigeria. Appl Water Sci 2013; 3(1):19-28. doi: 10.1007/s13201-012-0053-2 [Crossref] [ Google Scholar]
- Attari J, Mojahedi SA. Water Sustainability Index: Application of CWSI for Ahwaz County. World Environmental and Water Resources Congress; Great Rivers; 2009. p. 1-7. 10.1061/41036(342)164.