Avicenna J Environ Health Eng. 6(1):16-23.
doi: 10.34172/ajehe.2019.03
Original Article
Investigation of the Efficiency of Phosphorus Removal Using Anionic Resins From the Continuous Flow in the Waste Stabilization Pond Outlet: A Case Study of Kaboodrahang Wastewater Treatment Plant
Ali Akbar Rahmani Sarmazdeh 1  , Mostafa Leili 2, *
Author information:
1Department of Environmental Engineering, West Tehran Branch, Islamic Azad University, Tehran, Iran
2Associate Professor, Department of Environmental Health Engineering, School of Public Health, Hamadan University of Medical Sciences, Hamadan, Iran
Abstract
This research mainly aimed to investigate phosphorus removal from stabilization pond effluent by using anionic resins in the continuous flow mode of operation due to high amounts of phosphorus in the wastewater treatment plant effluent of Kaboodrahang, western Iran, as well as the violation from a prescribed effluent standard to discharge receiving the surface waters. For this purpose, the pilot was made of a plexiglass cylinder and other equipment such as pump and other accessories, as well as Purolite A-100 resin. The reactor effects on the desired study parameters were assessed in two warm and cold seasons. The results showed that the phosphorus concentrations reduced from 7-10 mg/L to 4-7 mg/L and the rate of phosphorus removal was higher in the hot season compared to the cold season. Moreover, the optimum temperature and pH were obtained 21ºC and 8.5, respectively. The mean inlet biological oxygen demand (BOD) was 150 mg/L for both warm and cold seasons, where the highest removal rate of 17% was obtained in the cold season. The mean chemical oxygen demand concentration of the pilot was 250 mg/L for both seasons, and the highest removal rate was observed in the cold season with an efficiency of 18%. Regarding the total suspended solids with the mean inlet of 230 mg/L, the highest removal efficiency was obtained 6% in the warm season.
Keywords: Phosphorus, Stabilization pond, Continuous flow, Anionic resin
Copyright and License Information
© 2019 The Author(s); Published by Hamadan University of Medical Sciences.
This is an open-access article distributed under the terms of the Creative Commons Attribution License (
http://creativecommons.org/licenses/by/4.0), which permits unrestricted use, distribution, and reproduction in any medium provided the original work is properly cited.
1. Introduction
Phosphate (P) is considered as the main inorganic content of wastewater, which can be found in various concentrations in both urban and industrial wastewaters. Nowadays, phosphate concentration in lakes and seas increases rapidly due to the disposal of urban and industrial wastewater that is not treated efficiently (1). Phosphorus appears in wastewater in different forms including orthophosphate, polyphosphate, and organic phosphorus and its concentration in urban wastewater and the outlet of urban wastewater treatment plants reaches 4-16 and 2-5 mg/L, respectively (2).
Phosphate and nitrates are considered as essential micronutrients for the growth of photosynthetic algae and cyanobacteria. However, the exorbitance presence of these elements leads to the excessive growth of algae, and subsequently the occurrence of eutrophication or hypertrophication phenomenon (3). In addition, it is believed that among these two pollutants, phosphate is considered as the controlling factor in the occurrence of the eutrophication phenomenon. Therefore, the phosphate removal from urban and industrial wastewater using appropriate methods is essential and its amount needs to reach a particular or standard level to prevent the occurrence of this dangerous phenomenon. In order to control the eutrophication, the U.S. Environmental Protection Agency (U.S. EPA) (4) has established a recommended limit of 0.05 mg/L for total phosphates (TP) in streams that enter lakes and 0.1 mg/L for TP in flowing waters.
Many methods are used for phosphorus removal from urban effluent and wastewater, including biological ones that are now considered as the most commonly used methods for phosphorus removal. However, biological methods have some disadvantages such as the need for long retention time and relatively skilled operator, as well as relatively low efficiency compared to chemical methods (5).
Aluminum and ferric (iron) salts are used to deposit phosphate in chemical precipitation methods. Further, many researchers use other methods such as adsorption or ion exchange in order to remove nutrients and other minor pollutants from wastewater treatment plants due to high sludge production and relatively low efficiency of conventional chemical precipitation techniques (6). Absorption can be defined as a process in which the material (adsorbate) travels from a gas or liquid phase to an interface with another phase (solid or solution) and thus the adsorption refers to a phenomenon that occurs at the material surface. Furthermore, an absorption process is required to connect the two phases in order to transfer the component or components from one phase to another (7). Moreover, the absorption process requires connecting two phases in order to transfer the component(s) from one phase to another (6).
Recently, different materials such as chitosan, activated carbon, agricultural wastes, and other natural and inexpensive substances have been used as natural adsorbents in order to remove nutrients and other pollutants from waste streams (7). It should be noted that such materials have no selective property to absorb specific pollutants such as phosphorus. The process of ion exchange is considered as one of the most attractive methods for absorbing water and wastewater pollutants, which is often used in advanced treatment methods. In this process, water and wastewater pollutants are exchanged with the ions on the adsorbent, and it can be utilized again when the adsorbent is saturated. Therefore, the present study addressed the possibility of using anion resins in phosphorus removal in urban wastewater using a stabilization pond method. The purpose of this study was to investigate the effect of various operating parameters such as temperature and pH on the efficiency of phosphorus removal, as well as the effect of resin on biological oxygen demand (BOD), chemical oxygen demand (COD), and total suspended solid (TSS) removal.
2. Materials and Methods
2.1. Type of Resin
The present study used Purolite A-100 (the UK.) with an average size of 0.04 mm to 0.45 mm. As shown in Fig. 1, the resin has a golden yellow color. In order to ensure resin saturation from OH-functional groups and the removal of other probable ions, the resin was placed in a 1-N solution of NaOH for 60 minutes. Next, it was washed several times with deionized water and then dried at 60°C for 60 minutes.
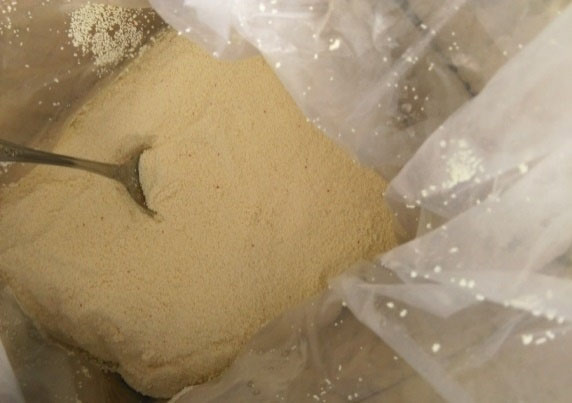
Figure 1.
Resin Purolite A-100.
.
Resin Purolite A-100.
2.2. Pilot Specifications
Fig. 2 displays the schematic of the reactor used in this study. The specifications of the reactor and components is shown in Table 1 as well.
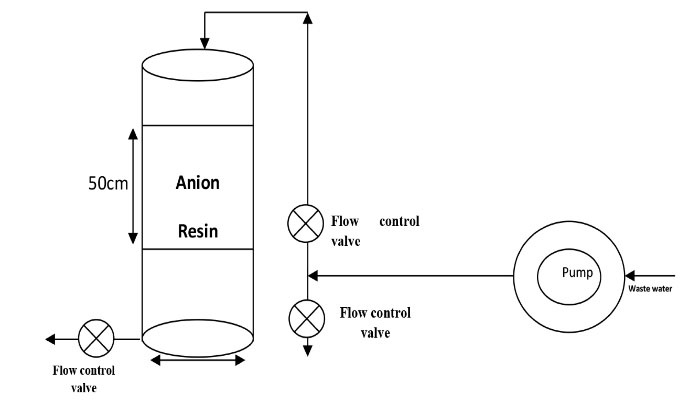
Figure 2.
Schematic of the Reactor Used in the Study.
.
Schematic of the Reactor Used in the Study.
Table 1.
Specifications of the Reactor and Components
|
Column Material
|
Corrosion and Pressure-Resistant Plexiglass Transparent
|
| Column height |
95 cm |
| Column diameter |
10 cm |
| Resin height in column |
50 cm |
| Column shape |
Circle |
| Resin type |
Purolite A-100 (the UK) with the following specifications |
| Alkaline property |
weak |
| Appearance |
Opaque spherical grains |
| Seed size |
0.2-0.3 mm |
| Effective size |
0.04-0.45 mm |
|
pH
|
With limitation |
| Temperature |
In the alkaline mode, maximum 100 degrees Celsius |
| Pump type |
Diaphragm pump of domestic water purification machine, Electro Coolmart® manufactured by Taiwan with the following specifications |
| Pump specifications |
Input volt: 24 VDC
Inlet pressure: 10 PSI
Working pressure: 70 PSI
Flow at 70PSI: 900 mL/min |
To control the inlet flow to the resin column, the flow was set by returning the flow after the pump outlet and installing the check valve. A mesh plate was installed at the inlet pipe of the pump in order to prevent entering soluble materials into the pump and clogging or damaging it. It was also used at the entry point of the wastewater into the column to distribute the wastewater uniformly on the resins and to prevent the formation of the cavity. Additionally, there was a latticed plate under the resin to prevent the resin from leaving the filter and a mesh was also used to separate the resin from the outlet.
The desired pilot pattern was derived from Standard Methods for the Examination of Water and Wastewater (8) and was based on the given dimensions showed schematically.
2.3. Study Variables and Testing Methods
Table 2 presents the desired variables. The sampling was done manually and testing methods were based on the standard methods (8). In addition, ammonium molybdate was used to measure the phosphorus at the inlet and outlet of the reactor. Likewise, Shimadzu UV-1700 spectrophotometer at 420 nm was used to measure the phosphate content and the ammonium molybdenum reagent based on the reference method (8). Further, pH-Meter E520, Metrohm was utilized to measure the pH. Other variables including temperature, BOD, COD, TSS, retention time, resin saturation time, and reduction time were also measured and adjusted through sampling at various intervals. To investigate the environmental conditions on the reactor performance, the reactor was operated for two cold (winter) and warm (spring) seasons. After the saturation of the resin, a 10% sodium hydroxide solution was used for its regeneration (9). All testing methods were based on wastewater testing standards, and in some cases, test kits were used to determine BOD, COD, and TSS. Furthermore, online devices were applied to measure parameters such as temperature, dissolved oxygen, and pH.
Table 2.
Variables of the Study
|
Variable Name
|
Variable Role
|
Measurement Method
|
Measurement Unit
|
| pH |
Independent |
pH Meter |
- |
| Temperature |
Dependent |
Thermometer |
℃ |
| TSS (input) |
Independent |
Test |
mg/L |
| TSS (output) |
Dependent |
Test |
mg/L |
| BOD (input) |
Independent |
Test/BOD Meter |
mg/L |
| BOD (output) |
Dependent |
Test/BOD Meter |
mg/L |
| COD (input) |
Independent |
Test/COD Meter |
mg/L |
| COD (output) |
Dependent |
Test/COD Meter |
mg/L |
Abbreviations:TSS, total suspended solids; BOD, biological oxygen demand; COD, chemical oxygen demand.
2.4. Reactor Startup and Operation
The location of the pilot site was selected before the chlorination unit in order to launch the reactor, to consider the strong winds of the area and the interferences of channel outflow bird, as well as avoiding chlorine interference in the samples. The reactor was then placed in the same place while making the necessary controls. The resin with a height of 50 cm was poured inside a mesh and placed inside the cylinder. As shown in Fig. 2, the inlet pipe of the pump (10 mm in diameter) was placed inside the outlet channel and the outlet pipe at the pilot entrance location (above the reactor). The maximum flow rate of 0.8 liters per minute was transmitted by the pump, which was high due to the volume of the pilot for storing the high effluent and the hydraulic retention time of 4-5 minutes, thus reducing and controlling the inlet flow by 0.5 L. In the minute, the inlet flow to the pilot was adjusted by dividing the thrust pipe.
Given that the reactor startup was done in the warm season, 16 samples were taken at the warmest hours (10-14) and the same hours were repeated in the cold season. The reactor was never shut down according to the type of flow (continuous). For this purpose, it was controlled by the operator of the treatment plant several times even during the night. In total, 16 samples were taken per season and the selected temperatures were limited to the sampling time of 1-2 hours since, according to temperature data, the probability of the frost at other times for the cold season and pond surface reduces due to water scarcity during the warm season.
3. Results and Discussion
To show the overall reactor performance in treating the effluents from the stabilization pond, its color before and after the treatment is illustrated in Fig. 3. As shown, there is a significant difference between the color of the resin inlet and outlet due to reactor performance on the removal of the color. However, our results could not be compared for all parameters because there were very studies have attempted to address all the assessed parameters.
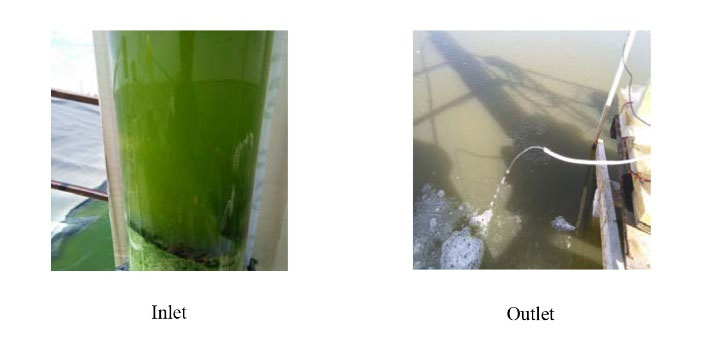
Figure 3.
Comparison of the Inlet and Outlet of the Reactor.
.
Comparison of the Inlet and Outlet of the Reactor.
3.1. Efficiency of the Reactor in the Removal of Phosphoru s
Figs. 4 and 5 depict the trend of changes in the inlet and outlet concentrations of the phosphorus during the study period at warm and cold seasons.
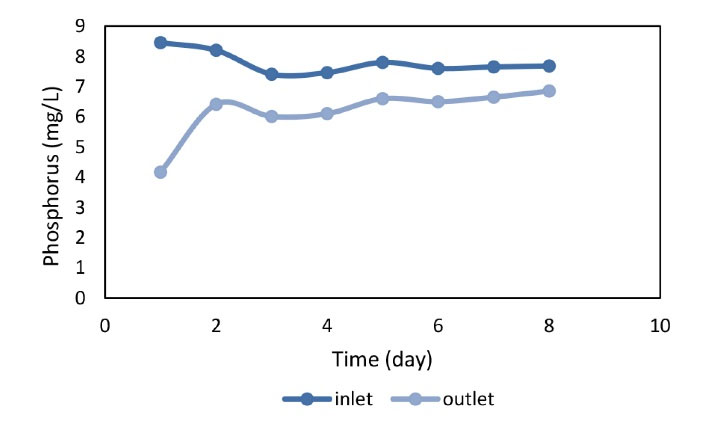
Figure 4.
The Efficiency of Reactor in the Removal of Phosphorus in the Warm Season.
.
The Efficiency of Reactor in the Removal of Phosphorus in the Warm Season.
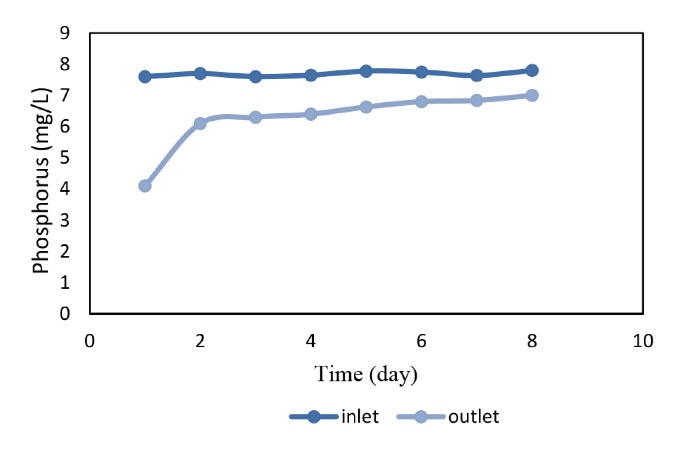
Figure 5.
The Efficiency of Reactor in the Removal of Phosphorus in the Cold Season.
.
The Efficiency of Reactor in the Removal of Phosphorus in the Cold Season.
As shown in Figs. 4 and 5 the reactor had better performance in the early days of the reactor start up in the warm and cold season because the resin was fresh, but the performance of the reactor decreased over the time. On the other hand, the average phosphorus concentration in the pilot inlet was 7.78 mg/L and the corresponding concentration at the pilot outlet was 6.76 mg/L with a mean removal efficiency of 20.4% for the warm season demonstrating the highest removal efficiency (Fig. 4). In the warm season, it was 50.65%. Fig. 5 shows that the average phosphorus input to the pilot was 7.69 mg/L in the cold season and the average phosphorus output from the pilot was 6.27 mg/L. Accordingly, the highest removal efficiency in the cold season was 46.05% and the average removal efficiency for the cold season was obtained 18.5% thus the average phosphorus removal efficiency of the reactor was calculated to be 20%. In a study by Mahvi et al (15) on iron resin nanoparticles as the medium for phosphorus removal, it was found that increasing phosphate concentration led to an increase in resin efficiency while the presence of other anions had no effect on resin performance. These results contradict the results of the present study since our results showed that the efficiency decreases by increasing phosphate concentration which may relate to resin or influent characteristics.
3.2. Investigation of Reactor Efficiency in Biological Oxygen Demand (BOD5) Removal
The efficiency of the reactor in BOD5 removal in warm and cold seasons for 16 days of operation is illustrated in Figs 6. and 7.
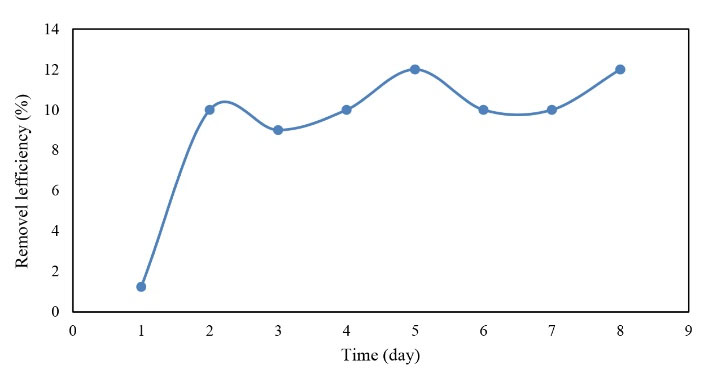
Figure 6.
The Efficiency of BOD5 Removal in the Warm Season.
.
The Efficiency of BOD5 Removal in the Warm Season.
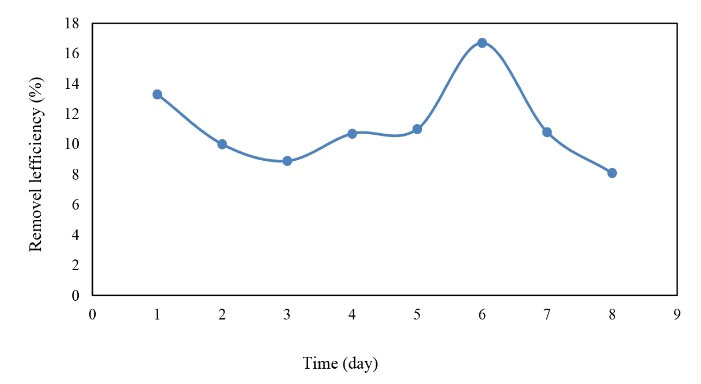
Figure 7.
The Efficiency of BOD5 Removal in the Cold Season.
.
The Efficiency of BOD5 Removal in the Cold Season.
By comparing Figs 6. and 7, it can be concluded that although BOD5 inlet decreased in the cold season, the removal rate increased as well, while the removal rate represented no significant change in the warm season. However, the highest efficiency of BOD5 removal (i.e., ≈17%) was observed in the cold season and the average removal efficiency of BOD5 (i.e., 11%) was observed in the cold season and 9.3% in the warm season. Finally, the mean BOD5 removal efficiency of the reactor was equal to 10% in the warm and cold seasons.
Similarly, Montalvo et al (16) evaluated the efficiency of a novel integrated system of natural zeolite and lime to remove NH4+, total phosphorus, BOD5, COD, TSS, and fecal coliforms. Based on their results, this integrated resin system could be very effective in removing these pollutants from the effluent from the primary settling step of the Chilean urban wastewater treatment with the corresponding removal efficiency of 98%, 100%, 71%, 79%, 99%, and 100%, respectively.
3.3. Investigation of Reactor Efficiency in COD Removal
The efficiency of the reactor in COD removal, similar to other studied parameters, was investigated for two warm and cold seasons. The results are shown in Figs. 8 and 9.
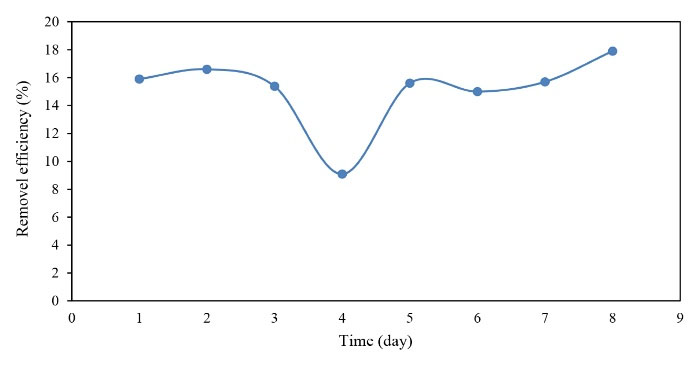
Figure 8.
The Efficiency of COD Removal in the Warm Season.
.
The Efficiency of COD Removal in the Warm Season.
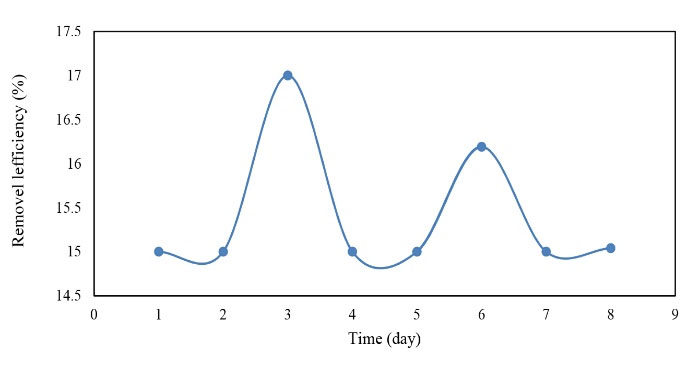
Figure 9.
The Efficiency of COD Removal in the Cold Season.
.
The Efficiency of COD Removal in the Cold Season.
As displayed in Figs. 8 to 9, the efficiency of the reactor in COD removal was acceptable. It should also be noted that the input COD values changed marginally in the ranges of 115-150 mg/L and 22-67 mg/L for warm and cold seasons, respectively, but the mean removal efficiency was almost the same for both seasons, indicating that the reactor was not affected by the inlet COD concentrations and was acceptable with a mean efficiency of 15% in both seasons.
3.4. Investigation of Reactor Efficiency in TSS Removal
The efficiency of the reactor was evaluated for two warm and cold seasons for 16 days in order to investigate the efficiency of the reactor in the TSS removal. The results are depicted in Figs. 10 to 11.
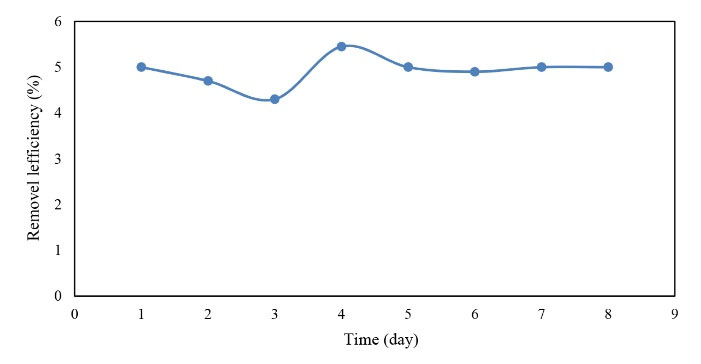
Figure 10.
The Efficiency of TSS Removal in the Warm Season.
.
The Efficiency of TSS Removal in the Warm Season.
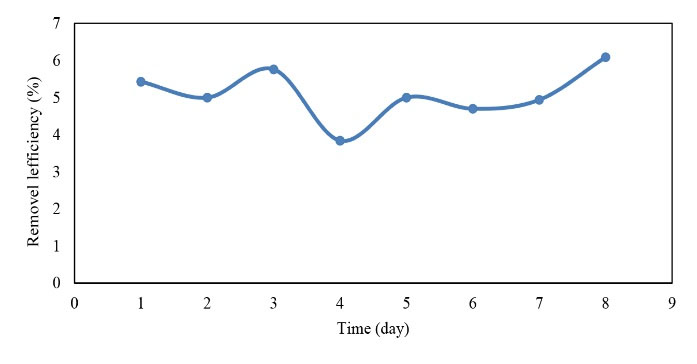
Figure 11.
The Efficiency of TSS Removal in the Cold Season.
.
The Efficiency of TSS Removal in the Cold Season.
Based on the data in Figs. 10 and 11, the efficiency of TSS removal in the cold season was higher than that of the warm season. However, by comparing the input and output TSS concentrations in both seasons, the reactor performance in the removal was better in the warm season due to higher values of the input TSS.
In general, the TSS was removed according to the pilot inlet and there were no significant changes in the two warm and cold seasons, which is proportional to the input. Therefore, the input value in the warm season was more than the cold season and more removal rate was obtained thus the reactor had a higher efficiency in the warm season.
3. 5. Investigation of Temperature Effects on Phosphorus Removal
The efficiency of the reactor in phosphorus removal was evaluated in cold and warm seasons in order to assess the effects of environmental conditions (i.e., temperature as the most important parameter). As shown in Fig. 12, the average efficiency changed between 10 and 50% in the warm season with a mean temperature of 21-28°C and the highest efficiency was reported for 21°C. In addition, the mean concentration of phosphorus enter the reactor was 8 mg/L and the mean concentration of phosphorus at the reactor outlet decreased to 4.17 mg/L.
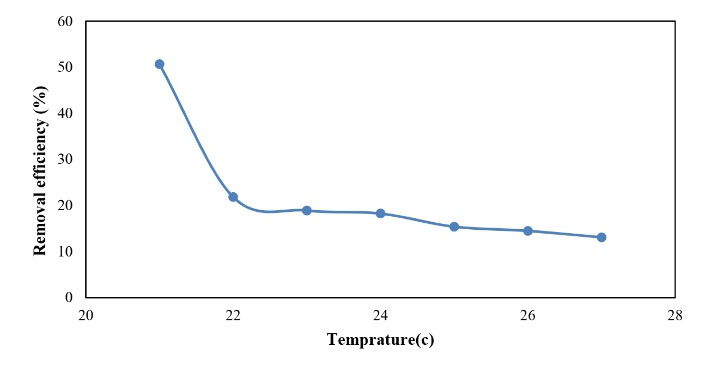
Figure 12.
Efficiency of Phosphorus Removal in the Warm Season.
.
Efficiency of Phosphorus Removal in the Warm Season.
As displayed in Fig. 13, the average removal efficiency fluctuated between 10% and 46% in the cold season with a mean temperature of 13-20°C and the highest efficiency was reported for 20°C, which is similar to the results of the warm season. Similarly, the mean concentration of phosphorus inlet to the reactor in the cold season was 7.6 mg/L while its mean concentration at the reactor outlet decreased to 4.1 mg/L.
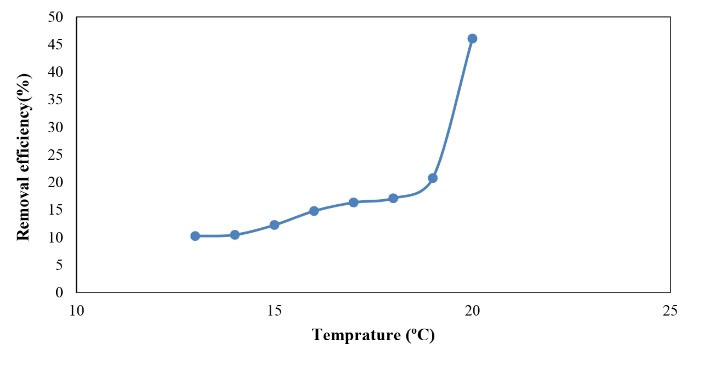
Figure 13.
Efficiency of Phosphorus Removal in the Cold Season.
.
Efficiency of Phosphorus Removal in the Cold Season.
As shown in Fig. 14, the best temperature range for achieving a higher efficiency was 22-20°C. In practice, the removal rate in the warm season was significantly higher than that of the cold season and the temperature of 21°C was reported as the best temperature with an average of 50% phosphorus removal. The removal efficiency was not significant beyond these temperature ranges, therefore, the removal rate failed to increase by increasing the temperature. In the cold season, the removal rate increased as the temperature increased, indicating a tendency for phosphorus removal to a higher temperature. Generally, the warm season is more suitable for phosphorus removal. Dargahi et al (10) also assessed the effect of temperature on the stabilization pond performance and showed that the stabilization ponds have higher efficiency in removing the organic compounds in the warm season compared to the cold season. Likewise, Fongsatikul et al (11) found that the biological systems are considered as low-cost technologies for removing the phosphorus from wastewater, but the fluctuation of wastewater temperature and its chemical contents make such process running unfeasible. However, seasonal temperature variations in wastewater did not have a detrimental effect on coagulation and flocculation processes (12).
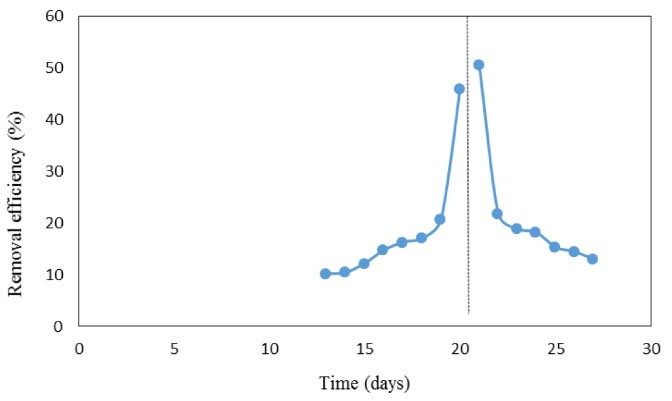
Figure 14.
Optimal Temperature for Phosphorus Removal.
.
Optimal Temperature for Phosphorus Removal.
3.6. Investigation of pH Effects on Phosphorus Removal
As mentioned earlier, the reactor efficiency in two warm and cold seasons was evaluated for a period of 16 days in order to evaluate the reactor efficiency in phosphorus removal. Fig. 15 shows the pH effects on removal efficiency.
Based on the data in Fig. 15, the highest percentage of phosphorus removal occurs at pH 8 and it is known as the optimal pH, but the pH range of 8-10 was common for the wastewater treatment plant. As mentioned earlier, the highest removal percentage was observed at the pH of 8-9, which indicates a tendency to a slightly alkaline condition for having more favorable phosphorus removal. Therefore, the optimal pH of ≈8 was selected as the best operating point for the studied resin.
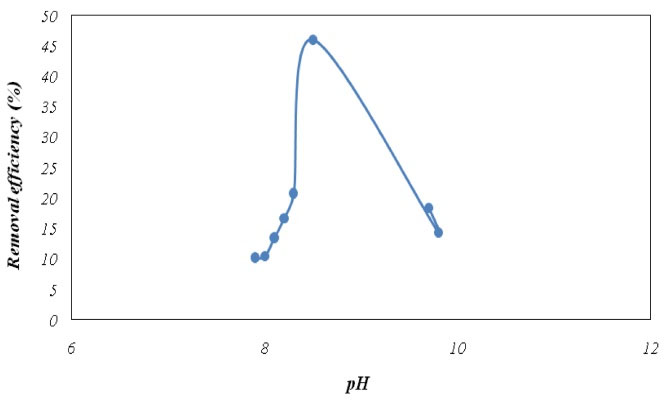
Figure 15.
Effect of pH on Phosphorus Removal Efficiency.
.
Effect of pH on Phosphorus Removal Efficiency.
According to the results of similar studies for batch systems in which another type of resin was also used, alkaline pH was reported more suitable (13,14), which is in accordance with our findings. However, it cannot be concluded that the removal rate increases more by increasing the pH level beyond the optimum ranges. Thus, the pH range of 8-9 was the suitable range for the studied resin. Awual and Jyo (14) assessed the phosphorus removal by polymeric anion exchangers. This batch study also clarified that weak-base resin preferred phosphorus to competing anions while the strong-base resin was strongly affected by competing anions. They concluded that weak-base resin could be an effective method for treating wastewater to prevent eutrophication in the receiving water bodies. On the other hand, Bahmani et al (13) investigated the adsorption kinetics of phosphorus from aqueous solutions using single-wall carbon nanotubes in a discontinuous or batch system and concluded that the removal efficiency significantly increased by increasing the pH up to 7 while thephosphorus removal efficiency decreased by increasing the pH from 7 to 10 (13). In another study, Samarghandi et al (17) used Varion Adam resin in a batch flow mode and found that the best resin removal efficiency was observed at the pH of 5, which is in contrast to our study results. These differences indicate that the parameters that are associated with each resin and affect its performance should be analyzed according to its properties.
4. Conclusion
In general, although wastewater treatment in pond systems plays a role in removing BOD and coliforms, it is not effective in producing the effluent with low content of TSS. This high TSS concentration relates to the growth of algae and vegetables in the ponds, which encourages the researcher to assess the methods to reduce or at least control the phosphorus levels in the wastewater since it plays a major role in the growth of algae and vegetables. Therefore, the high concentration of suspended solids in the effluent of the ponds where might reach more than 100 mg/L, is considered as one of the disadvantages of pond systems. In addition, the presence of such high TSS concentrations restricts its various re-use purposes including aquifers recharge, discharge to surface waters, and other recreational and industrial reuses.
Therefore, the current study assessed the efficiency of phosphorus removal using anion resins from the continuous flow in the waste stabilization pond effluent. The results showed that 50% phosphorus removal at 21°C could be obtained during the early operating days of the resin and optimum efficiency was observed in the warm season. On the other hand, the removal of other parameters such as BOD, COD, and TSS was also desirable and their removal rate was higher in the cold season compared to the warm season, which could be due to a decrease in their input concentrations in this season. Thus, Purolite A-100 resin can remove phosphorus and other parameters such as BOD, COD, and TSS; this is comparable with the results of other studies that are even more efficient but used in the batch operational mode which made it easier to control the operational factors. In this study, the results of the pilot setup and its operation were favorable. However, having favorable efficiency implies expensive equipment and appropriate retention time and requires precise operation and sophisticated personnel at the scale of a pond. These disadvantages doubt the removal of phosphorus from the pond effluent via this method. Moreover, the periodic operation of the resin reduces its uses because, as it is known, the resin becomes saturated after a specific service time and even the regeneration process cannot make it efficient in removing the pollutants from the waste streams or at least it is uneconomical.
Conflict of Interest Disclosures
The authors declare that they have no conflict of interests.
Acknowledgment
The authors would like to thank Islamic Azad University, Tehran West Branch and Hamedan Water and Wastewater Company for their support and collaboration in conducting this research.
References
- Mohammadyari N, Balador A. Performance of MBBR in the treatment of combined municipal and industrial wastewater, a case study: Mashhad sewage treatment plant of Parkandabad. Journal of Water and Wastewater 2008; 65:38-46. [ Google Scholar]
- Kavaklı PA, Kavaklı C, Güven O. Preparation of quaternized dimethylaminoethylmethacrylate grafted nonwoven fabric for the removal of phosphate. Radiation Physics and Chemistry 2010; 79(3):233-7. doi: 10.1016/j.radphyschem.2009.08.011 [Crossref] [ Google Scholar]
- Kermani M, Bina B, Movahedian Attar H, Amin MM, Nikaeen M. Performance and modeling of moving bed biofilm process for nutrient removal from wastewater. Journal of Water and Wastewater 2010; 19(3):9-19. [ Google Scholar]
- Litke DW. Review of phosphorus control measures in the United States and their effects on water quality. Water-Resources Investigations Report 1999; 99:4007. [ Google Scholar]
- Muryanto S, Bayuseno AP. Wastewater Treatment for a Sustainable Future: Overview of Phosphorus Recovery. Applied Mechanics and Materials 2012; 110-116:2043-8. doi: 10.4028/www.scientific.net/amm.110-116.2043 [Crossref] [ Google Scholar]
- Srivastava S, Srivastava AK. Biological phosphate removal by model based continuous cultivation of Acinetobacter calcoaceticus. Process Biochem 2006; 41(3):624-30. doi: 10.1016/j.procbio.2005.08.009 [Crossref] [ Google Scholar]
- Takdastan A, Azimi AA, Salari J. Removal of turbidity, COD, detergent and phosphate from carwash wastewater by electro coagulation. Journal of Water and Wastewater 2011; 79:19-25. [ Google Scholar]
- Eaton AD, Clesceri LS, Rice R, Greenberg A, Franson M. Standard Methods for the Examination of Water and Wastewater. Washington, DC: American Public Health Association (APHA), American Water Works Association (AWWA) and Water Environment Federation (WEF); 2005.
- Rahimi Y, Torabian A, Mehrdadi N, Shahmoradi B. Simultaneous nitrification–denitrification and phosphorus removal in a fixed bed sequencing batch reactor (FBSBR). J Hazard Mater 2011; 185(2-3):852-7. doi: 10.1016/j.jhazmat.2010.09.098 [Crossref] [ Google Scholar]
- Dargahi A, Pirsaheb M, Savadpoor M, Alighadri M, Farookhi M. Effect of retention time and temperature on the efficiency stabilization ponds in treatment of petroleum wastewater. Journal of Environmental Science and Technology 2014; 16(2):13-24. [ Google Scholar]
- Fongsatitkul P, Wareham DG, Elefsiniotis P. The influence of organic loading and anoxic/oxic times on the removal of carbon, nitrogen and phosphorus from a wastewater treated in a sequencing batch reactor. J Environ Sci Health A Tox Hazard Subst Environ Eng 2008; 43(7):725-30. doi: 10.1080/10934520801959880 [Crossref] [ Google Scholar]
- Narasiah KS, Morasse C, Lemay J. Phosphorus removal from aerated lagoons using alum, ferric chloride and lime. Water Quality Research Journal 1994; 29(1):1-18. doi: 10.2166/wqrj.1994.001 [Crossref] [ Google Scholar]
- Bahmani A, Moussavi SP, Salehi K. Isotherm and Kinetic Study of Phosphor Adsorption from Aqueous Solution using Single Wall Carbon Nanotubes. J Environ Water Eng 2016; 2(1):120-131. [ Google Scholar]
- Awual MR, Jyo A. Assessing of phosphorus removal by polymeric anion exchangers. Desalination 2011; 281:111-7. doi: 10.1016/j.desal.2011.07.047 [Crossref] [ Google Scholar]
- Mahvi AH, Rafati L, Dehghani MH, Nadafi K. Phosphate Removal from the Medium by Iron Nanoparticle Resin(FO36). Scientific Journal of Kurdistan University of Medical Sciences 2010; 15:70-80. [ Google Scholar]
- Montalvo SJ, Guerrero LE, Milán Z, Borja R. Nitrogen and phosphorus removal using a novel integrated system of natural zeolite and lime. J Environ Sci Health A Tox Hazard Subst Environ Eng 2011; 46(12):1385-91. doi: 10.1080/10934529.2011.606709 [Crossref] [ Google Scholar]
- Samarghandi MR, Rahmani AR, Noori Sepehr M, Zarrabi M, Borji S. Determination of Thermodynamic and Kinetic Parameters During Sorption of Phosphorous by Weakly Anion Exchanger. Journal of Water and Wastewater 2013; 3:2-11. [ Google Scholar]