Avicenna J Environ Health Eng. 7(1):35-46.
doi: 10.34172/ajehe.2020.06
Original Article
Adsorptive Removal of Methylene Blue in Aqueous Solutions Through Raw and Modified Cantaloupe Peel Wastes: Kinetic and Isotherm Study
Mohammad Reza Samarghandi 1  , Kazem Godini 2 , Ghasem Azarian 3, * , Ali Reza Ehsani 1, Hassan Zolghadrnasab 1, *
Author information:
1Department of Environmental Health Engineering, School of Public Health and Research Center for Health Sciences, Hamadan University of Medical Sciences, Hamadan, Iran.
2Environmental Health Research Center, Research Institute for Health Development, Kurdistan University of Medical Sciences, Sanandaj, Iran.
3Research Center for Health Sciences, Hamadan University of Medical Sciences, Hamadan, IR Iran.
Abstract
Since large amounts of agricultural wastes are produced in Iran and these wastes have lignocellulosic nature, the current study was performed to survey the adsorption performance of methylene blue dye from aqueous solutions by means of raw and modified cantaloupe peel. The adsorbents used were characterized using techniques like scanning electron microscope (SEM), as well as Fourier transform infrared spectroscopy (FTIR). In this study, the effects of a few key variables including pH, reaction time, dye concentration, adsorbent dosage and temperature on the adsorption performance were investigated. Optimum values were attained at 0.04 and 0.08 g doses of modified and raw cantaloupe peel, pH of 7 after mixing for 120 and 90 minutes for raw and modified cantaloupe peel, respectively. The equilibrium information was fitted to the Langmuir, Freundlich, Temkin, and Dubinin-Radushkevich equations and the respective data for all models were tested. An increase in adsorbent dose and temperature caused the efficiency to rise. The mechanism and rate of adsorption were ascertained by analyzing the experimental data at various contact times according to traditional kinetic equations: pseudo-first-order and second order, Elovich, and intra-particle diffusion. The findings illustrated that the data accorded closely with the pseudo-second-order model. Moreover, it was found that these wastes can be applied to remove environmental pollutants, particularly methylene blue dye.
Keywords: Effluent, Methylene blue removal, Cantaloupe peel waste, Kinetic, Isotherm
Copyright and License Information
© 2020 The Author(s); Published by Hamadan University of Medical Sciences.
This is an open-access article distributed under the terms of the Creative Commons Attribution License (
http://creativecommons.org/licenses/by/4.0), which permits unrestricted use, distribution, and reproduction in any medium provided the original work is properly cited.
1. Introduction
Globally, over 100 000 different types of dyes are produced amounting to 0.7 to 1 million tons annually (1). The existing of these compounds in water can result in adverse effects on the kidney, reproductive system, liver, and so forth (2,3). These challenges and hazardous issues make it essential to find cheap, nontoxic, green and high performance substances in order to treat a high quantity of dye-laden effluents before being discharged into water resources (4-6). Methylene blue (MB) is one of the most widely applied dyes to dye cotton, wood, and silk. This dye has several side effects on human health like eye burns. Over the past decades, a huge number of physicochemical and biological purification methods have been introduced to remove MB (7,8).
Adsorption is known as a suitable method for removing different kinds of coloring substances. Adsorption processes, in order to remove dyes, have been used because of low prices, ease of treatment design, more availability of adsorbents, and high efficiency even at high doses of dyes; therefore, various adsorbent stemming from syntactical and natural materials are applied (9-11). Based on previous studies, approximately all compounds having carbon in their structure can be employed as an adsorbent. Bentonite, biomass, coke, wheat bran, bamboo, hazelnut skin, and so on have been used by many researchers (12,13). Agricultural wastes are generated in huge quantities around the world. Lignocellulosic materials containing three main parts in their structure, including hemicellulose, cellulose, and lignin, have shown a high capacity in adsorbing different pollutants. These wastes are inexpensive, biodegradable, abundant, and economical, which can be applied in water and wastewater treatment (14). Besides, these adsorbents can be used without any further process (15). Since no study has been conducted on dye removal using cantaloupe peel, the current study aimed to investigate the efficiency of both raw and modified cantaloupe peel to remove MB from aqueous environments. MB is used for many purposes from the textile industry for dying cloths to medicinal goals and so on. Therefore, it is expected to see different quantities of it in effluents (2). The treatment of effluents of various industries, especially the textile industry, is complicated and requires advanced technology and skilled operators. For instance, the application of biological, physiochemical and electrochemical or a combination of these complicated processes needs high costs for initial investment and operation. In this study, MB was removed by means of an agricultural waste including raw and modified cantaloupe peel. It should be pointed out that this waste is generated in huge quantities in the country annually.
Moreover, the impacts of variables like pH, reaction time, initial pollutant content, adsorbent dose, and reaction temperature on the removal efficiency of dye were investigated. Moreover, the kinetic and isotherm data were analyzed for better understanding the adsorption mechanisms and some models were utilized to fit the data obtained from the experiments.
2. Materials and Methods
All of the materials, used in the current research, were of analytical grade and bought from Merck (Germany). A scanning electron microscope (SEM) (Philips XL-30, Netherlands) was used to detect the structural and morphological properties of the adsorbent. Moreover, to measure the location of functional groups on the surface of the adsorbent, as well as the technique of Fourier transform infrared spectroscopy (FTIR) (Perkin-Elmer Inc., USA) was applied. All of the samples used in the study were prepared synthetically. MB (purity >99%) was purchased from Alvan Sabet Co., Hamadan, Iran. Fig. 1 indicates the chemical structure of the dye. The 1000-mg L−1stock solutions of the dye was made through dissolving 500 mg of the pure dye in 500 mL of distilled water; also, the working solutions were made freshly from the stock solution. The pH measurement was done using a pH meter (HACH sensION 4, Germany). So as to fix the pH values of the samples, 0.1-N H2SO4 and 0.1-N NaOH were used. Furthermore, the effects of operating parameters including contact time (0-120 minutes), pH value (3-11), initial MB content (25-125 mg L-1), temperature (20-50°C), and adsorbent dose (0.02-0.1 g) were investigated. After setting out the desired conditions, the samples were placed on a shaker (model: Iran-Parsazma) at 200 rpm. Afterwards, the samples were centrifuged (400 rpm; 5 minutes) and residual contents of the dye were detected by a spectrophotometer (Germany-DR5000-UV/Vis; maximum wavelength: 662 nm). In order to enhance the accuracy, all the experiments were performed in triplicate and the average figures were recorded.
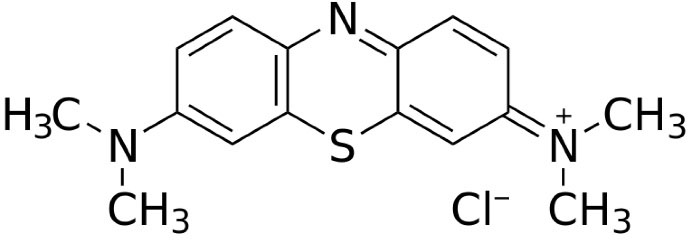
Figure 1.
The Structure of the Dye Methylene Blue.
.
The Structure of the Dye Methylene Blue.
To determine the pHpzc (Point of Zero Charge), 30 mL of NaCl (0.01 N) solution was poured into six 50-mL Erlenmeyer flasks and the solutions’ pH was fixed between 2 and 12 via NaOH and H2SO4. Then, 0.5 g of adsorbent (raw or modified cantaloupe peel) was added to each of them and placed on a shaker for 24 hours (120 rpm). After refining, the final pH was read using a digital pH meter (model HACH sensION 4 Germany). pHPZC was determined by plotting the initial pH values against the final pH (16). The amounts of MB removal (%) by means of raw and modified cantaloupe peel and the adsorption capacity of the adsorbent wase estimated, respectively, using the following equations (17,18):
Where R( %) presents the removal efficiency of MB, qe is the amount of adsorbed dye (mg g-1), Ci and Ce are the initial and equilibrium dye contents (mg L-1) of MB, V (L) is the volume of the solution and M (g) is the mass of the adsorbent. In order to determine reaction kinetics, initial content between 25 and 125 mg L-1 of the dye was prepared at a fixed pH value and adsorbent dosage. At intervals between 0 and 120 min, the solution was sampled and then the adsorbent was separated. Finally, the amount of dye residual was measured and the data obtained were used to determine the reaction kinetics. The isotherm studies were carried out at the initial content (25-125 mg L-1) for MB to obtain adsorption isotherms. Next, these solutions were kept in a shaker for the equilibrium time obtained from the last stage. Then, the contents of the dye residual were measured and the results were investigated based on the following isotherm models: Langmuir, Freundlich, Temkin and Dubinin-Radushkevich.
2.1. Adsorbent Preparation
So as to prepare the adsorbent, after shade drying, diluted water was used for washing cantaloupe peel and they were then kept at 70°C for 48 hours. Next, it was milled to pass through a No. 100 mesh sieve. Next, the obtained matter was washed and kept at 70°C (24 hours). Finally, the gained adsorbent was kept in a plastic container for use (19). The obtained adsorbent was used as a raw adsorbent and was kept in 0.4 mol of HNO3 for 24 hours to prepare the modified adsorbent. Afterwards, the new adsorbent, after rinsing, was dried at 70°C
(24 hours).
3. Results and Discussion
3.1. Characteristics of Raw and Modified Cantaloupe Peel
Fig. 2 presents the SEM images of the adsorbent’s surface. Apparently, the adsorbents’ surface morphology is homogeneous and nearly smooth. According to the FTIR spectra (Fig. 3), a few absorption peaks are seen belonging to different functional groups or various vibration modes. The adsorption peaks detected included 3428.5, 2925.55, 1630.33, 1432.05, and 1064.92, which illustrate stretching vibrations of the functional group (OH) on the adsorbent surface, symmetric stretching frequencies of the -CH3 group, stretching frequency of the C=O in carboxylic acid bonded with intramolecular hydrogen, O-H groups, and the groups of stretching C=O and polysaccharides, respectively, in adsorbents’ cellulose structure (19). After MB adsorption, the peak of stretching frequency of the OH group and C=O in carboxylic acid bonded with intramolecular hydrogen and frequency in the range of 1746.4 decreased to 1763.7. All changes are indicative of suitable adsorption of the dye on the adsorbents. Moreover, all peaks in the spectrum of the modified cantaloupe peel showed a marginal decrease (20).
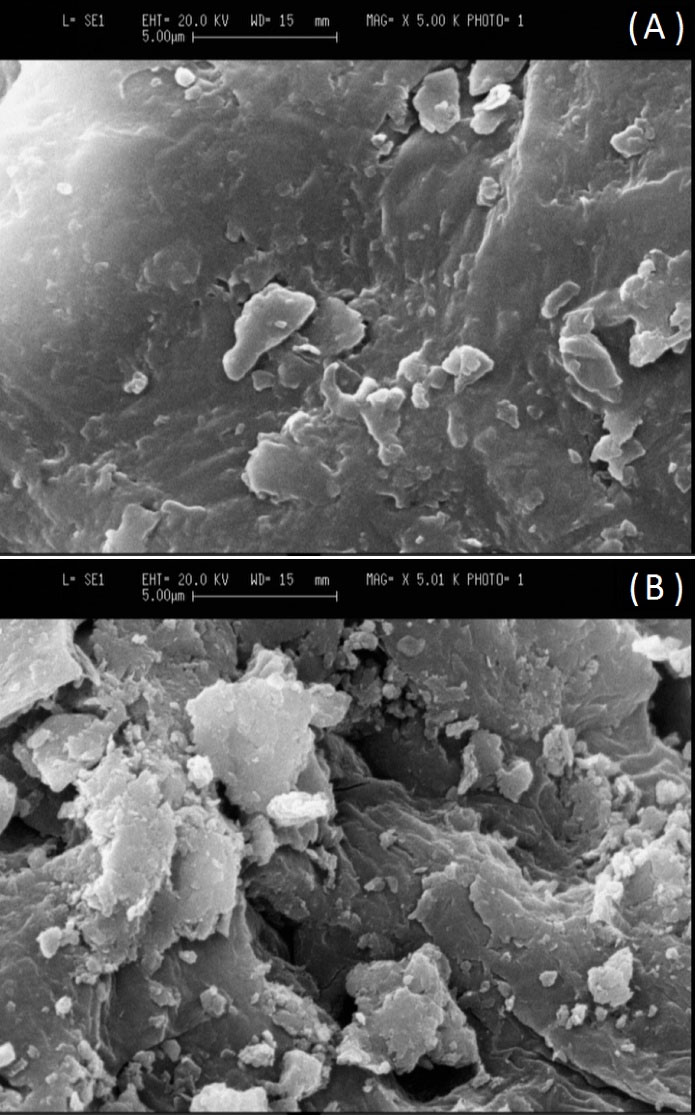
Figure 2.
Scanning Electronic Microscope (SEM) Image: (a) Raw and (b) Modified Cantaloupe Peel.
.
Scanning Electronic Microscope (SEM) Image: (a) Raw and (b) Modified Cantaloupe Peel.
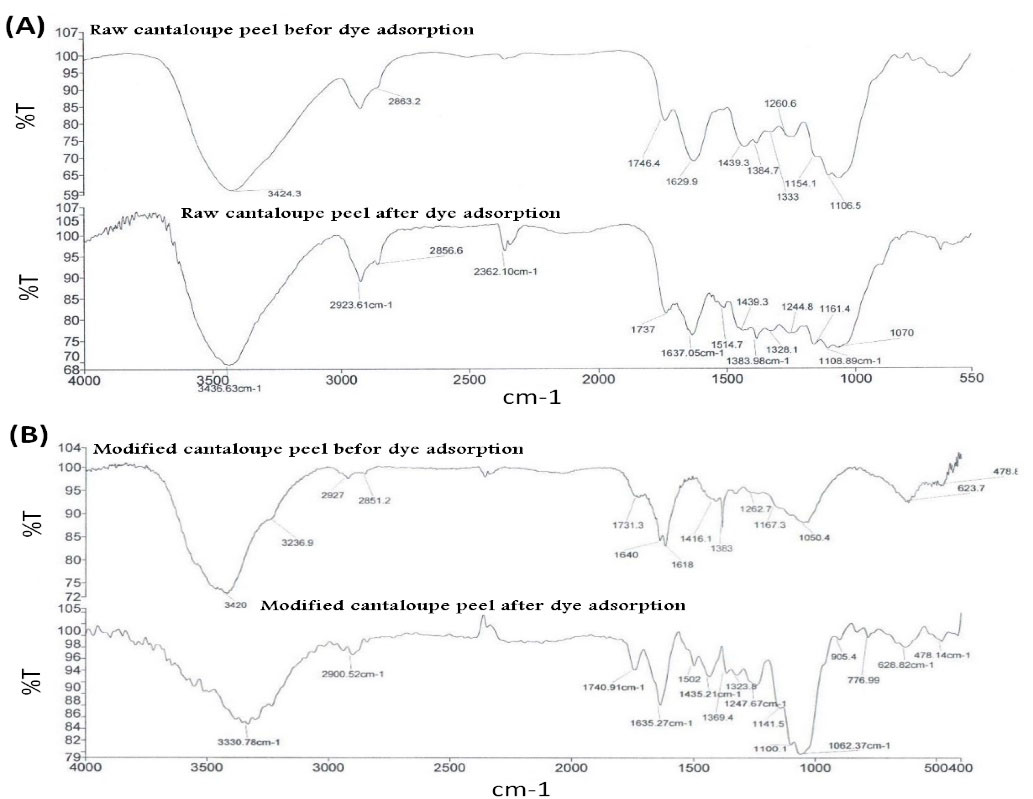
Figure 3.
FTIR Spectrum of the (a) Raw and (b) Modified Cantaloupe Peel before and after the Adsorption.
.
FTIR Spectrum of the (a) Raw and (b) Modified Cantaloupe Peel before and after the Adsorption.
3.2. The Effect of pH
As can be seen from Fig. 4, the removal efficiency went up with increasing pH value 3-7 and then decreased slowly. The highest efficiency was obtained at the value of 7, removing 76.3% and 89.7% of the dye by raw and modified cantaloupe peel, respectively. Therefore, this pH value was considered as the optimum point, the reason for this is dependent upon the cationic structure of the dye. Since the surface charge of modified cantaloupe peel is negative at pH values above 4, the amount of negative charge boosts at high values, and given the cationic nature of MB, the electrostatic force between adsorbent and pollutants increases and this enhances the amount of adsorption (21). Moreover, with raising solution pH, the concentration of H+ions decrease in solution, leading to a rise in the removal efficiency. The pHPZC values, respectively, for raw and modified cantaloupe peel were 7.8 and 7.1. These findings are in accordance with the findings of other studies. Ong et al stated that the amount of reactive dye removal by rice bran enhanced when pH was raised (2-10) (22). Additionally, at low pH values, the adsorbent’s surface is covered by the carboxylic group containing proton, which inhibits suitable adsorption. Similar observations were claimed by Sulak et al (23) illustrating that the amount of the dye adsorption went up from 13.9 to 15.28% when the pH value was raised from 4 to 10.
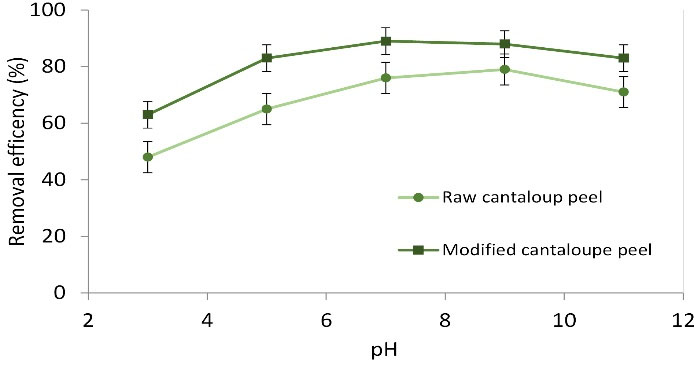
Figure 4.
Effect of pH Changes on Methylene Blue Removal at the Following Conditions: Adsorbents Dose: 0.06 g, Initial Dye Concentration: 50 mg L-1, and Reaction Time: 60 min.
.
Effect of pH Changes on Methylene Blue Removal at the Following Conditions: Adsorbents Dose: 0.06 g, Initial Dye Concentration: 50 mg L-1, and Reaction Time: 60 min.
3.3. Contact Time Effect
After 90 and 120 minutes, the adsorption process reached equilibrium, respectively, for raw and modified cantaloupe peel. After the equilibrium, the amount of the dye adsorption declined over time because of a decrease in active sites (Fig. 5). Also, in the study by Ong et al (22), the time of equilibrium was found to be 60 minutes for RO16 dye using rice bran. Moreover, Dawood and Sen explained that the contact time of equilibrium for Congo red adsorption by pine cone was 100 minutes (20). Another study, in which reactive red 198 was removed by raw and modified bio-adsorbent, gained similar findings (24). Relatively low contact time of equilibrium for dye adsorption on an adsorbent can be due to dye adsorption on the adsorbent’s surface area. The rate of dye adsorption in the adsorbent’s pores is lower than that on the surface areas resulting in a lower contact time of equilibrium (22).
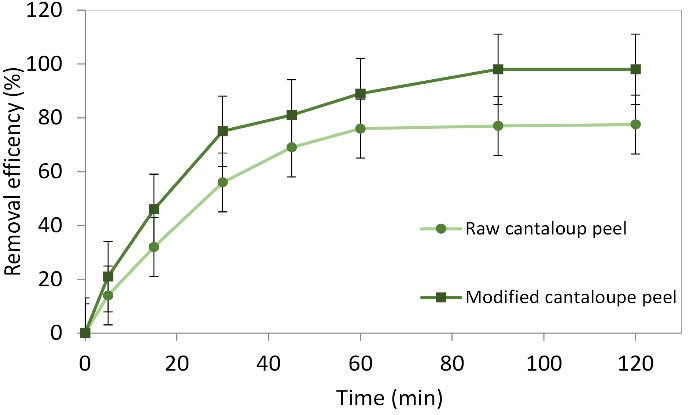
Figure 5.
Effect of Contact Time Changes on Methylene Blue Removal at the Following Conditions: Adsorbent dose: 0.08 and 0.04 g for Raw and Modified Cantaloupe Peel, Respectively, Initial Dye Content: 50 mg L-1, and pH: 7.
.
Effect of Contact Time Changes on Methylene Blue Removal at the Following Conditions: Adsorbent dose: 0.08 and 0.04 g for Raw and Modified Cantaloupe Peel, Respectively, Initial Dye Content: 50 mg L-1, and pH: 7.
3.4. Adsorbent Dosage Effect
The efficiency went up with raising the amount of the adsorbent (raw cantaloupe peel), an increase of 20% was seen when the dosage was raised from 0.02, 0.04, 0.06, 0.08, and 0.1 (Fig. 6). In contrast, in the case of modified cantaloupe peel, the efficiency increased from 59.4% to 86.5% when the dosage was raised from 0.02 to 0.04 g and then increased slightly. In this study, the dosages of 0.08 and 0.04 were selected as the best optimum points, respectively, for raw and modified cantaloupe peel. In the same conditions, more reactions between the adsorbent and adsorbate happen as there are active and available sites when adsorbent dosage is raised leading to lower adsorption capacity (23). The increase of MB adsorption occurred because of an increase in active and effective surface areas. The results of other studies show that increasing the dosage of adsorbents leads to a relatively lower increase in dye/pollutant adsorption; this is related to the lack of complete use of adsorbent capacity (24). There is not an upward trend between higher efficiency and higher dosages of adsorbents and, at a certain dose of adsorbents, the efficiency will not increase. In this work, the optimized doses of raw and modified cantaloupe peel were found to be 0.08 and 0.04 g, respectively. Since the adsorbent used in the present study was obtained from waste materials, it can be entirely economical.
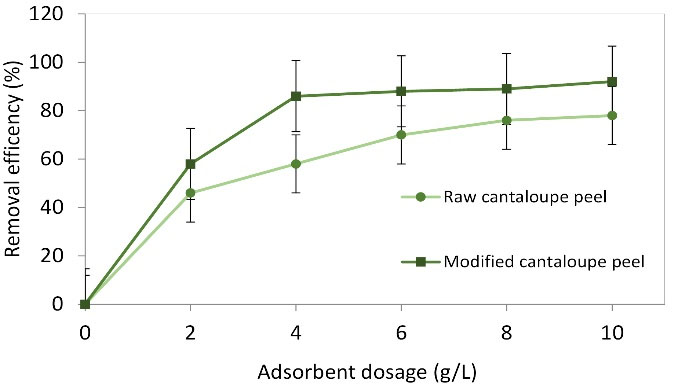
Figure 6.
Effect of Adsorbent Dose on Methylene Blue Removal at the Following Conditions: pH: 7, Initial Dye Content: 50 mg L-1, and Reaction Time: 120 min.
.
Effect of Adsorbent Dose on Methylene Blue Removal at the Following Conditions: pH: 7, Initial Dye Content: 50 mg L-1, and Reaction Time: 120 min.
3.5. Temperature Effect
Temperature increase results in a rise in the solubility of dye molecules and effective contacts between the adsorbent and adsorbate and, in turn, adsorption capacity (Fig. 7) (25). It also increases the size of the pores on the adsorbent’s surface. The obtained findings accorded with those of the study by Seyed Mohammadi et al (26), in which the activated carbon from oak fruit was used to remove MB. An increase in temperature causes kinetic energy to enhance, thereby increasing the number of contacts among the adsorbent and dye molecules. As a result, the adsorption of the molecules on the adsorptive sites is facilitated. Of course, an increase in temperature is suitable to reach the optimum level and after that a further increase in it leads to changes in the nature of the sites or increased rejection rate of adsorbed ions in the solution (22).
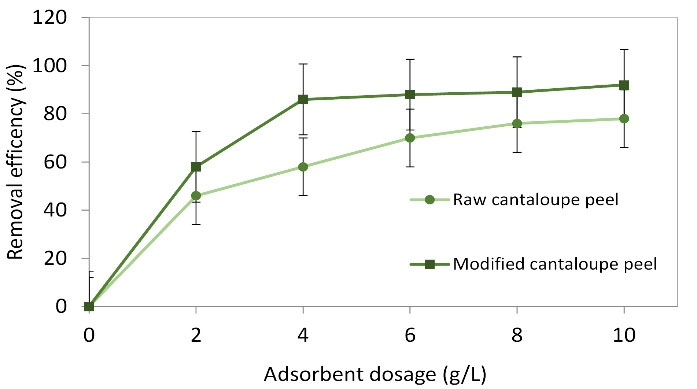
Figure 7.
Effect of Temperature on Methylene Blue Removal at the Following Conditions: Adsorbent Dose: 0.08 and 0.04 gfor Raw and Modified Cantaloupe Peel, Respectively, Initial Dye Content: 50 mg L-1, pH: 7, and Reaction Time: 120 min.
.
Effect of Temperature on Methylene Blue Removal at the Following Conditions: Adsorbent Dose: 0.08 and 0.04 gfor Raw and Modified Cantaloupe Peel, Respectively, Initial Dye Content: 50 mg L-1, pH: 7, and Reaction Time: 120 min.
3.6. Isotherm Models
Equilibrium uptake went up with raising equilibrium MB contents in the range of experimental content. This is because of a rise in driving force from the content gradient. Similarly, if MB concentration in solution was higher, a huge number of MB ions surround the active sites of raw cantaloupe peel, and the adsorption continued properly. Thus, the values of qe went up with the rise of equilibrium MB contents. The MB adsorption capacity on the modified cantaloupe peel was 158.73 mg g-1 at 298 K and 95.23 mg g-1 for raw cantaloupe peel, in comparison with other adsorbents, the amount of MB adsorption on the raw cantaloupe peel was not high; however, as a natural material, it is abundant and inexpensive; therefore, this adsorbent could be utilized for the removal of MB from the solution. The rise of the equilibrium adsorption with enhanced temperature illustrated that the MB adsorption on the raw cantaloupe peel was endothermic. The position of equilibrium is characteristic of the whole system including solute, adsorbent, solvent, pH, temperature and so forth. It should be noted that the correlation of the equilibrium data with either theoretical or empirical equations is vital for practical applications. Therefore, Langmuir, Freundlich, Temkin, and D–R isothermal models are utilized to the experimental data attained over the isothermal adsorption researches.
In the Langmuir model, it is assumed that no interaction among adsorbate molecules happen and the adsorption process occurs in a monolayer. And, the following linear equations show the Langmuir isotherm (27-29):
Here, Ce and qe are, respectively, equilibrium contents in the phases of liquid (mg L-1) and solid (mg g-1), qm is the maximum adsorption capacity (mg g-1), and b, n, and k are the constants of the model (19). A plot of Ce/Qe versus Ce at various contents of raw and modified cantaloupe peel ranging from 0.02 to 0.1 g should illustrate a straight line with a slope of 1/Qm and an intercept equal to 1/kaQm. In spite of this line at different conditions, the value of constant can be calculated the content of the adsorbents (Tables 1 and 2). It should be noted that the high correlation coefficients and maximum monolayer capacity (158.73-45.04 mg g-1 through 0.02-0.1 g of the modified cantaloupe peel and 95.23-44.44 mg g-1 using 0.02-0.1 g of raw cantaloupe peel) indicate powerful positive evidence on the fitness of equilibrium data of MB adsorption to the Langmuir model (Tables 1 and 2). Adsorption parameters by the Langmuir and Freundlich models have been shown in Tables 1 and 2, presenting the constants and coefficients of each one. The findings depicted that the adsorption followed the Freundlich model. Adsorption takes place in especial and heterogeneous sites without any reaction between the molecules of the adsorbent and adsorbate. In contrast, the Freundlich model is on the basis of heterogeneous and multilayer adsorption of the adsorbate on the adsorbent (24). Tablel 1 presents that the adsorption of MB onto both raw and modified cantaloupe peel followed the
Freundlich isotherm. The parameters (kf and n) of the Freundlich isotherm show the suitability or unsuitability of the adsorption; in this model, kf is the index showing the capacity of adsorption and n is the slope of the index indicating the intensity of adsorption. The heterogeneity factor (n), from the Freundlich isotherm, was greater than 1, illustrating that the adsorption process was under the experimental circumstances and of chemical adsorption. And, isotherms with n>1 are categorized as L isotherms and present that there is high affinity between the
adsorbent and adsorbate (30). Additionally, it was found that the MB adsorption onto the raw and modified cantaloupe peel was done properly. Based on Tables 1 and 2, the highest amounts of MB adsorption (Qmax) were calculated to be 95.23 and 158.73 mg g-1.
Table 1.
Isotherm Constants of MB Adsorption onto Modified Cantaloupe Peel at pH of 7, Contact Time of 60 Minutes, MB Content of 25-125 mg L-1, Adsorbent Dosage of 0.02-0.1 g, and Temperature of 27±2 °C
|
Adsorbent (g)
|
|
Isotherm
|
Parameters
|
0.02
|
0.04
|
0.06
|
0.08
|
0.10
|
Langmuir
Ce/qe = 1/KaQm + Ce/Qm |
Qm (mg g-1) |
158.74 |
90.08 |
65.78 |
55.57 |
45.03 |
| Ka (L mg -1) |
0.175 |
0.198 |
0.394 |
0.709 |
0.878 |
| RL |
0.044-0.184 |
0.038-0.168 |
0.023-0.093 |
0.011-0.054 |
0.008-0.045 |
| Χ2 |
188.434 |
93.444 |
65.115 |
37.773 |
21.704 |
| R2 |
0.9998 |
0.9998 |
0.9992 |
0.9993 |
0.9996 |
Freundlich
Ln qe = ln KF + (1/n)ln Ce |
1/n |
0.333 |
0.314 |
0.287 |
0.262 |
0.256 |
| n |
2.98 |
3.19 |
3.48 |
3.81 |
3.92 |
| KF (L mg -1) |
43.03 |
23.88 |
23.42 |
23.21 |
20.04 |
| Χ2 |
218.641 |
113.163 |
63.457 |
42.122 |
36.542 |
| R2 |
0.9182 |
0.9258 |
0.9491 |
0.9567 |
0.9472 |
Temkin
qe = Bl ln KT + Bl lnCe |
Bl |
29.84 |
17.38 |
11.01 |
8.28 |
6.53 |
| KT (L mg -1) |
2.48 |
2.54 |
7.97 |
22.29 |
30.75 |
| X2 |
227.741 |
118.037 |
67.653 |
49.013 |
31.278 |
| R2 |
0.9699 |
0.9734 |
0.9833 |
0.9866 |
0.9864 |
Dubinin and
Radushkevich
Ln qe = ln Qs – Kε2 |
Qs (mg g-1) |
132.88 |
73.74 |
54.23 |
44.86 |
36.73 |
| K |
2E-06 |
1E-06 |
3E-07 |
8E-07 |
6E-09 |
| E (kJ/mol)=1/ |
500 |
706 |
1293 |
2501 |
2888 |
| X2 |
211.853 |
107.733 |
73.377 |
43.904 |
34.658 |
| R2 |
0.9418 |
0.9172 |
0.8797 |
0.8574 |
0.8689 |
Table 2.
Isotherm Constants of MB Adsorption onto Raw Cantaloupe Peel at pH of 7, Contact Time of 60 Minutes, MB Content of 25-125 mg L-1, Adsorbent Dosage of 0.02-0.1 g, and Temperature of 27±2 °C
|
Adsorbent (g)
|
|
Isotherm
|
Parameters
|
0.02
|
0.04
|
0.06
|
0.08
|
0.10
|
Langmuir
Ce/qe = 1/KaQm + Ce/Qm |
Qm (mg g-1) |
95.24 |
78.44 |
60.25 |
49.51 |
44.54 |
| Ka (L mg -1) |
0.138 |
0.168 |
0.194 |
0.392 |
0.711 |
| RL |
0.054-0.233 |
0.042-0.193 |
0.039-0171 |
0.02-0.094 |
0.012-0.054 |
| Χ2 |
203.515 |
109.427 |
75.018 |
55.765 |
37.703 |
| R2 |
0.9976 |
0.9998 |
0.9991 |
0.9992 |
0.9993 |
Freundlich
Ln qe = ln KF + (1/n)ln Ce |
1/n |
0.1898 |
0.314 |
0.335 |
0.2877 |
0.264 |
| n |
5.28 |
3.18 |
2.98 |
3.51 |
3.81 |
| KF (L mg -1) |
40.55 |
21.53 |
19.94 |
18.72 |
17.2 |
| Χ2 |
316.661 |
133.183 |
86.456 |
74.102 |
45.542 |
| R2 |
0.9443 |
0.9184 |
0.9258 |
0.9491 |
0.9569 |
Temkin
qe = Bl ln KT + Bl lnCe |
Bl |
14.94 |
13.22 |
11.58 |
8.24 |
6.62 |
| KT (L mg -1) |
1.77 |
2.48 |
2.54 |
7.97 |
22.31 |
| X2 |
347.739 |
189.039 |
125.633 |
93.015 |
67.278 |
| R2 |
0.9734 |
0.9699 |
0.9736 |
0.9835 |
0.9866 |
Dubinin and
Radushkevich
Ln qe = ln Qs – Kε2 |
Qs (mg g-1) |
85.65 |
66.41 |
49.17 |
40.68 |
35.87 |
| K |
2E-06 |
2E-06 |
1E-06 |
3E-07 |
8E-08 |
| E (kJ/mol)=1/ |
500 |
501 |
706 |
1293 |
2502 |
| X2 |
223.898 |
116.767 |
79.303 |
67.399 |
44.638 |
| R2 |
0.9923 |
0.9418 |
0.9172 |
0.8799 |
0.8574 |
3.6.1. Temkin Isotherm
Judgment for the suitability of all models in terms of the representation of method applicability for the description of experimental data is based on R2 value. Despite the fact that the Langmuir and even Freundlich models have logical and a satisfactory R2 value, the applicability of other models like Temkin isotherm has commonly been utilized in linear form (31,32) below. The Temkin isotherm (equation 5) can be simplified to the following equation:
Here, β = (RT)/b is linked to adsorption heat, T is the temperature of absolute (in Kelvin) and R is the universal constant of gas, 8.314 (J mol-1 K−1) (33,34). The data
obtained were analyzed based on the linear form of the Temkin isotherm (equation 5). Also, the data showed that the Temkin isotherm is effectively capable of fitting the MB adsorption on the raw and modified cantaloupe peel.
Tables 1 and 2 present the linear isotherm constants and coefficients of determination. The heat of MB adsorption on raw cantaloupe peel was found to decrease between 14.92 and 6.63 kJ mol−1 with an increase in adsorbent dosage (0.02-0.1 g) and modified cantaloupe peel was
found to decrease between 29.85 and 6.52 kJ mol−1 with an increase in adsorbent dosage (0.02and 0.1 g). And, the correlation coefficients (R2) attained from the Temkin model were comparable to that gained from the Langmuir and Freundlich equations, describing the applicability of the Temkin model to the MB adsorption on the raw and
modified cantaloupe peel. But, based on X2, as a noticeable criterion, Langmuir is the most applicable model.
3.6.2. Dubinin–Radushkevich (D–R) Model
Further, the D–R model was employed to calculate the free energy, porosity, and the properties of the adsorbents (35,36). The D–R model does assume neither a homogeneous surface nor constant adsorption potential. This model has frequently been utilized in equation 6 and its linear form should be presented as equation 7 as follows:
here, K is a constant, which is related to the adsorption energy, Qm is the theoretical saturation capacity and ε is the Polanyi potential, estimated from equation 8.
The slope of the plot of ln qe versus ε2 gives K (mol2 (kJ2)−1) and the intercept outputs the capacity of adsorption, Qm (mg g−1). The mean free energy of adsorption (E), for the transfer of one mole of the target from infinity in solution to the surface of the solid was
estimated by the K value by means of equation 9 (37):
The calculated value of D–R (Tables 1 and 2) indicates that the saturation adsorption capacity at the optimal
circumstances by a few contents of the adsorbents was in the range of 85.55–35.88 mg g−1 for raw cantaloupe peel and 132.78–36.72 mg g−1 for the modified cantaloupe peel, respectively, which closely accords with the respective Langmuir value. Also, the values of E calculated by equation 9 is 0.5–2.5 kJ mol−1 for the raw cantaloupe peel
and 0.5–2.8 kJ mol−1 for modified cantaloupe peel correspond to physico-sorption process playing a key role in MB adsorption. Another important index for assessing the applicability of all models was the use of error analysis (χ2). The non-linear chi-square test statistic (38), (the best-fit isotherm) is according to equation below:
(10)
here, qe, exp and qe, cal are, respectively, the values of experimental and calculated adsorption capacity. It should be pointed that the close accordance of the data obtained by each model needs a lower χ2 value and non-applicability for each model is indicated by a greater χ2value. Also, the gained non-linear value, which is higher r2 value and smaller χ2 value of the Langmuir isotherm in
comparison with the similar value of other applied models, confirms its high performance in representing the data, obtained experimentally, under all conditions. Moreover, the lower correlation coefficient (R2) of the
Freundlich equation compared to the Langmuir model suggests that the process is better modeled via monolayer
compared to the multilayer adsorption. Therefore, to confirm this result, the favorable or unfavorable MG adsorption on the Langmuir model was judged through calculating the separation factor (RL) (39). Furthermore, the amounts of calculated RL for the adsorption by raw and modified cantaloupe peel were presented in Tables 1 and 2, respectively. It should be pointed out that RL is a dimensionless parameter showing the kind of adsorption process and is calculated by equation 11:
here, ka (L mg−1) is the Langmuir constant and C0 (mg L−1) is initial concentration. If RL >1, the adsorption is unsuitable, if RL = 1, it is linear, if RL < 1, it is suitable, and if RL=0, it is irreversible (24). This result is indicative of the surface change of adsorbent and deeper adsorption of dye molecules. According to the results obtained in this investigation, it can be pointed out that the modified cantaloupe peel could remove the dye better because of having more functional groups than another adsorbent. The study by Dawood and Sen (20) illustrated that the
adsorption of Congo red onto pine cone followed the Freundlich model, but Gulnaz et al (24), who investigated Reactive Red 198 adsorption, found that the process followed the Langmuir model.
3.7. Adsorption Kinetics
The kinetics of MB adsorption on the adsorbent is needed for the selection of optimal operating conditions for a full-scale batch method. The kinetic variables, which are beneficial for the projection of adsorption rate, show important information for designing and modeling adsorption methods. Therefore, the kinetics of MB adsorption on adsorbents was analyzed by the pseudo-first-order (40), pseudo-second-order (41), Elovich (42), and intraparticle diffusion (43,44) kinetic models. And, the conformity between the experimental data and the model projected values was stated through the correlation coefficients (R2, values close or equal to 1). A relatively higher value is the more applicable model to the kinetics of MB adsorption on the raw and modified cantaloupe peel wastes.
3.7.1. Pseudo-First and Second Order Kinetic
The adsorption kinetic data were explained by the Lagergren pseudo-first-order model (40), which is the earliest known equation expressing the adsorption rate on the basis of the adsorption capacity. The differential equation is commonly expressed below:
here, qe and qt are, respectively, the adsorption capacity (mg g−1) at equilibrium and at time t, k1 is the pseudo-first order adsorption rate constant (L min−1). Integrating equation 12 for the boundary conditions t=0–t and qt =0–qt shows:
(13)
Equation 13 could be rearranged to reach the following linear form:
(14)
So as to attain the rate constants, the values of log (qe−qt) were linearly correlated with t by plot of log (qe−qt) versus t to give a linear relationship from which k1 and predicted qe can be measured based on, respectively, the slope and intercept of the plot. The change in rate can be proportional to the first power of concentration for strict surface adsorption. However, the relationship between initial solute concentration and the rate of adsorption will not be linear if pore diffusion restricts the adsorption process. That the pseudo-first-order equation fits well for the first 50 min and thereafter the data deviate from
theory. Therefore, the model represents the initial steps where quick adsorption happen well but cannot be utilized for the whole adsorption process. Also, the correlation coefficients (R2) are relatively low for most adsorption data (Tables 3 and 4). This illustrates that the MB adsorption on the raw and modified cantaloupe peel wastes cannot be utilized and the reaction mechanism is not a first-order reaction.
Table 3.
Kinetic Parameters of MB Adsorption on Modified Cantaloupe Peel (Adsorbent Dosage: 0.04 g, MB Content: 25-125 mg L-1, pH: 7, Reaction Time: 5-120 min, Temperature: 27±2 °C)
|
Parameter values: concentration of dye (mg L-1) |
|
Models
|
Parameters
|
25
|
50
|
75
|
100
|
125
|
First order kinetic model:
Log (qe-qt)=log(qe)-(K1/2.303)t |
K1 |
0.19 |
0.014 |
0.012 |
0.006 |
0.004 |
| qe (cal) |
13.57 |
29.29 |
50.08 |
51.83 |
63.24 |
| R2 |
0.8584 |
0.7658 |
0.8084 |
0.9092 |
0.9034 |
Second order kinetic model:
t/qt=1/k2qe2 + (1/qe)t |
K2 |
0.005 |
0.003 |
0.002 |
0.0008 |
0.0006 |
| qe (cal) |
29.95 |
58.15 |
84.02 |
103.08 |
126.59 |
| R2 |
0.9989 |
0.9984 |
0.9978 |
0.9972 |
0.9957 |
| h |
3.59 |
6.88 |
8.25 |
10.17 |
11.11 |
Intraparticle diffusion
qt=Kid t1/2+C |
Kdif |
1.77 |
3.54 |
5.28 |
6.58 |
8.63 |
| C |
11.13 |
21.16 |
26.98 |
32.52 |
34.23 |
| R2 |
0.8087 |
0.7864 |
0.8224 |
0.7994 |
0.7727 |
Elovich
qt= 1/β ln(αβ) + 1/β ln (t) |
β |
0.185 |
0.094 |
0.064 |
0.053 |
0.037 |
| R2 |
0.9352 |
0.9219 |
0.9418 |
0.9238 |
0.9103 |
| Experimental date |
qe(exp) |
30.02 |
62.35 |
83.57 |
97.24 |
125.24 |
Table 4.
Kinetic Parameters of MB Adsorption on Raw Cantaloupe Peel (Adsorbent Dosage: 0.04 g MB Content: 25-125 mg L-1, pH: 7, Reaction Time: 5-120 min, Temperature: 27±2 °C)
|
Parameter values: dye concentration (mg L
-1
)
|
|
Models
|
parameters
|
25
|
50
|
75
|
100
|
125
|
First order kinetic model:
Log (qe-qt)=log(qe)-(K1/2.303)t |
K1 |
0.048 |
0.045 |
0.044 |
0.042 |
0.038 |
| qe (cal) |
20.96 |
32.68 |
70.18 |
118.13 |
138.97 |
| R2 |
0.9251 |
0.9303 |
0.9122 |
0.9324 |
0.9587 |
Second order kinetic model:
t/qt=1/k2qe2 + (1/qe)t |
K2 |
0.0036 |
0.0019 |
0.0009 |
0.0006 |
0.0003 |
| qe (cal) |
29.08 |
57.13 |
84.74 |
107.54 |
144.94 |
| R2 |
0.9990 |
0.9981 |
0.9913 |
0.9935 |
0.9997 |
| h |
2.94 |
6.12 |
6.53 |
7.53 |
8.77 |
Intraparticle diffusion
qt=Kid t1/2+C |
Kdif |
1.84 |
3.63 |
5.78 |
7.74 |
10.96 |
| C |
9.39 |
15.95 |
18.49 |
26.03 |
32.60 |
| R2 |
0.8361 |
0.7951 |
0.8894 |
0.9373 |
0.9680 |
Elovich
qt= 1/β ln(αβ) + 1/β ln (t) |
β |
0.19 |
0.09 |
0.07 |
0.05 |
0.04 |
| R2 |
0.9538 |
0.9290 |
0.9403 |
0.9621 |
0.9773 |
| Experimental date |
qe(exp) |
28.87 |
56.25 |
85.25 |
104.25 |
143.33 |
The adsorption kinetics may be stated via the pseudo-second order model (41). The differential equation is commonly given below:
here, k2 (g (mg min)−1) is the second-order rate constant of adsorption. And, integrating (equation 15) for the boundary conditions qt =0–qt at t=0–t is simplified and can be rewritten to linear form to attain:
The second-order rate constants were applied to estimate the initial sorption rate (equation 17):
If the second-order kinetics is applicable, then the plot of t/qt versus t can present a linear relationship. Values of k2 and equilibrium adsorption capacity qe were estimated from the intercept and slope of the plots of t/qt versus t. The linear plots of t/qt versus t indicate good agreement between experimental and estimated qe values at different initial MB and adsorbent contents (Tables 3 and 4). Also, the correlation coefficients for the second-order kinetic model were greater than 0.9991 and 0.9987, which resulted in the belief that the pseudo-second-order kinetic model
supplied a good correlation for the adsorption of different initial contents of MB onto raw and modified cantaloupe peel wastes. The values of initial sorption (h) that represent the rate of initial adsorption practically went up (2.93 to 8.76 mg (g min)−1) with the rise in initial MB contents from 25-125 mgL−1 onto adsorbent dose of
0.04 g for raw cantaloupe peel and increased from 3.58 to 11.10 mg (g min)−1 with the increase in initial
MB contents from 25-125 mgL−1 onto the adsorbent dosage of 0.04 g for the modified cantaloupe peel. The pseudo-second-order rate constant (k2) declined with the increase of initial MB content from 25 to 125 mgL−1 for raw cantaloupe peel waste of 0.035 to 0.0002 and 0.004 to 0.0007 for modified cantaloupe peel waste (Tables 3 and 4). As can be seen, the MB adsorption onto raw and modified cantaloupe peel fitted best to the pseudo second-order kinetic model Tables 3 and 4). The adsorption process following the pseudo-second order kinetic model shows that two reactions are effective in the adsorption of an adsorbate onto an adsorbent; the first one is fast and reaches equilibrium quickly and the second one has a low rate and continues too long (45). Our findings accord with those of a study by Uddin et al (19), who investigated the
adsorption of MB onto tea wastes. Moreover, Hameed et al reported that pineapple stem waste as an adsorbent
followed the pseudo-second-order kinetic model (46).
3.7.2. Intraparticle Diffusion Kinetic Model
Since the MB is likely transported from its aqueous environment to the raw and modified cantaloupe peel wastes by intraparticle diffusion, the intraparticle diffusion is the other kinetic model that can be applied to survey the MB adsorption rate on the adsorbents. Also, the possibility of intraparticle diffusion was expressed through the intraparticle diffusion model, which is generally explained using equation 18:
here, C (mg g−1) is the intercept and Kdif is the intraparticle diffusion rate constant (mgg−1 min−1/2). And, the values of qt were linearly linked with values of t1/2 and the rate constant Kdif directly investigated from the slope of the regression line (Tables 3 and 4). The values of intercept C (Tables 3 and 4) give information regarding the thickness of the boundary layer, and the resistance to the external mass transfer enhancement as the intercept increase. The constant C was found to increase with raising dye content from 25 to 125 mg L−1, showing the rise of the thickness of the boundary layer and decline of the chance of the external mass transfer and hence improve of the chance of internal mass transfer. Also, the R2 values presented in Tables 3 and 4 are close to unity demonstrating the utilization of this model, which may confirm that the rate-limiting stage is the intraparticle diffusion process. The intraparticle diffusion rate constant, Kdif, ranging from 1.83 to 10.86 mg g−1 min−1/2 and 1.78 to 8.62 mg g−1 min−1/2 for 0.04 g of the raw and modified cantaloupe peel and it increased with raising initial dye content. Also, the linearity of the plots illustrates that intraparticle diffusion had a basic role in the uptake of the adsorbate by the adsorbent. Nonetheless, as still there is no enough indication regarding it, Ho (47) has indicated that, if the intraparticle diffusion is the sole rate-limiting stage, it is vital for the qt versus t1/2 plots to pass through the origin.
3.7.3. Elovich Kinetic Model
The Elovich equation is another rate equation on the basis of the adsorption capacity generally expressed in some studies (39,48,49).
here, β is the initial rate of adsorption (mg (g min)−1) and α is the constant of desorption (g mg−1) over any experiment. And, it is rewritten via assuming αβt>>t and by using the boundary conditions qt =0 at t = 0 and qt = qt at t = t, equation 19 becomes:
If MB adsorption by adsorbents fits the Elovich model, a plot of qt versus ln(t) output a linear relationship with a slope of (1/β) and an intercept of (1/β) ln(αβ). Therefore, the constants could be attained from the slope and the intercept of the straight line (Tables 3 and 4). Also, the initial adsorption rate (β) declines between 0.18 and 0.03 mg (g min)−1 for the raw cantaloupe peel and decrease from 0.19 to 0.04 mg(g min)−1 for modified cantaloupe peel with raising initial MB content from 25-125 mgL−1 on the adsorbent dosage of 0.04 g. Similar pattern mentioned earlier for the initial adsorption rate (h) was gained from the pseudo-second-order model (Tables 3 and 4).
4. Conclusion
The results indicated that the adsorption by the adsorbents was performed well, as the adsorption of the dye had a direct relationship with solution pH, adsorbent dosage, initial dye content, reaction time and temperature and indirect relationship with dye concentration. The time to reach adsorption equilibrium was 90 and 120 minutes, respectively, for raw and modified cantaloupe peel. The optimum amount of raw cantaloupe peel was attained at 0.08 g (dye content=50 mg L-1, temperature=20°C and reaction time 90 minutes) and the optimum amount of modified cantaloupe peel was gained at 0.04 g (dye concentration=25 mg L-1, temperature=20°C and contact time 120 minutes). Under the optimized conditions, 86.5 and 97% of the dye were absorbed by the raw and modified cantaloupe peel, respectively. The Langmuir isotherm gave a better fit to adsorption isotherms than the Freundlich, Temkin and Dubinin and Radushkevich isotherm. The kinetic study of MB on raw and modified cantaloupe peel was conducted according to the pseudo-first order, pseudo-second-order, Elovich, and intraparticle diffusion equations. The obtained data indicated that the adsorption followed the pseudo-second-order rate besides the interparticle diffusion model. The current research concludes that this adsorbent can be utilized as low-cost adsorbents for the removal of MB from water and wastewater. Moreover, studies on quantitative properties of this adsorbent and the involved mechanisms, as well as the feasibility of the application this adsorbent for other dyes for possible industrial approaches are required.
Acknowledgements
Authors are thankful to Hamadan University of Medical Sciences for preparing research materials, equipment, and funds. The current project received financial support from the Vice Chancellorship for Research Affairs of Hamadan University of Medical Science.
References
- Al-Degs YS, El-Barghouthi MI, El-Sheikh AH, Walker GM. Effect of solution pH, ionic strength, and temperature on adsorption behavior of reactive dyes on activated carbon. Dyes Pigm 2008; 77(1):16-23. doi: 10.1016/j.dyepig.2007.03.001 [Crossref] [ Google Scholar]
- Rafatullah M, Sulaiman O, Hashim R, Ahmad A. Adsorption of methylene blue on low-cost adsorbents: a review. J Hazard Mater 2010; 177(1-3):70-80. doi: 10.1016/j.jhazmat.2009.12.047 [Crossref] [ Google Scholar]
- Rahmani AR, Godini K, Nematollahi D, Azarian G, Maleki S. Degradation of azo dye CI Acid Red 18 using an eco-friendly and continuous electrochemical process. Korean J Chem Eng 2016; 33(2):532-8. doi: 10.1007/s11814-015-0175-y [Crossref] [ Google Scholar]
- Kyzas GZ, Kostoglou M. Green adsorbents for wastewaters: a critical review. Materials (Basel) 2014; 7(1):333-64. doi: 10.3390/ma7010333 [Crossref] [ Google Scholar]
- Rahmani AR, Nematollahi D, Samarghandi MR, Samadi MT, Azarian G. A central composite design to optimize in-situ electrochemically produced ozone for removal of Reactive Red 198. J Electrochem Soc 2018; 165(3):E121-E8. doi: 10.1149/2.0201803jes [Crossref] [ Google Scholar]
- Samarghandi MR, Mehralipour J, Azarian G, Godini K, Shabanlo A. Decomposition of sodium dodecylbenzene sulfonate surfactant by Electro/Fe2+-activated Persulfate process from aqueous solutions. Global NEST Journal 2017; 19(1):115-21. doi: 10.30955/gnj.002063 [Crossref] [ Google Scholar]
- Shokoohi R, Nematollahi D, Samarghandi MR, Azarian G, Latifi Z. Optimization of three-dimensional electrochemical process for degradation of methylene blue from aqueous environments using central composite design. Environ Technol Innov 2020; 18:100711. doi: 10.1016/j.eti.2020.100711 [Crossref] [ Google Scholar]
- Mashkoor F, Nasar A. Magsorbents: potential candidates in wastewater treatment technology–a review on the removal of methylene blue dye. J Magn Magn Mater 2020; 500:166408. doi: 10.1016/j.jmmm.2020.166408 [Crossref] [ Google Scholar]
- Babi KG, Koumenides KM, Nikolaou AD, Mihopoulos NS, Tzoumerkas FK, Makri CA. Pilot-plant experiments for the removal of THMs, HAAs and DOC from drinking water by GAC adsorption-Galatsi Water Treatment Plant, Athens. Global NEST Journal 2003; 5(3):177-84. doi: 10.30955/gnj.000285 [Crossref] [ Google Scholar]
- Badii K, Doulati Ardejani F, Aziz Saberi M, Abdolreza S, Hashemi Nasab R. Adsorption of basic organic colorants from an aqua binary mixture by diatomite. Prog Color Color Coat 2010; 3(1):41-6. [ Google Scholar]
- Verma VK, Mishra AK. Kinetic and isotherm modeling of adsorption of dyes onto rice husk carbon. Global NEST Journal 2010; 12(2):190-6. doi: 10.30955/gnj.000638 [Crossref] [ Google Scholar]
- dos Santos AB, Cervantes FJ, van Lier JB. Review paper on current technologies for decolourisation of textile wastewaters: perspectives for anaerobic biotechnology. Bioresour Technol 2007; 98(12):2369-85. doi: 10.1016/j.biortech.2006.11.013 [Crossref] [ Google Scholar]
- Özer A, Dursun G. Removal of methylene blue from aqueous solution by dehydrated wheat bran carbon. J Hazard Mater 2007; 146(1-2):262-9. doi: 10.1016/j.jhazmat.2006.12.016 [Crossref] [ Google Scholar]
- Salleh MAM, Mahmoud DK, Karim WAWA, Idris A. Cationic and anionic dye adsorption by agricultural solid wastes: a comprehensive review. Desalination 2011; 280(1-3):1-13. doi: 10.1016/j.desal.2011.07.019 [Crossref] [ Google Scholar]
- Bhatnagar A, Sillanpää M. Utilization of agro-industrial and municipal waste materials as potential adsorbents for water treatment—a review. Chem Eng J 2010; 157(2-3):277-96. doi: 10.1016/j.cej.2010.01.007 [Crossref] [ Google Scholar]
- Ravulapalli S, Kunta R. Effective removal of methylene blue, a hazardous dye from industrial effluents using active carbon of Finfectoria plant. Int J Enviro Sci Technol 2019; 16(12):7837-48. doi: 10.1007/s13762-018-2147-3 [Crossref] [ Google Scholar]
- Shokoοhi R, Zolghadrnasab H, Azarian G, Mehdipour M. Cadmium removal by using pumice modified with iron nanoparticles from aqueous solutions. Global NEST Journal 2016; 18(2):426-36. doi: 10.30955/gnj.001854 [Crossref] [ Google Scholar]
- Rahmani H, Gholami M, Mahvi AH, Alimohammadi M, Azarian G, Esrafili A. Tinidazole removal from aqueous solution by sonolysis in the presence of hydrogen peroxide. Bull Environ Contam Toxicol 2014; 92(3):341-6. doi: 10.1007/s00128-013-1193-2 [Crossref] [ Google Scholar]
- Uddin MT, Islam MA, Mahmud S, Rukanuzzaman M. Adsorptive removal of methylene blue by tea waste. J Hazard Mater 2009; 164(1):53-60. doi: 10.1016/j.jhazmat.2008.07.131 [Crossref] [ Google Scholar]
- Dawood S, Sen TK. Removal of anionic dye Congo red from aqueous solution by raw pine and acid-treated pine cone powder as adsorbent: equilibrium, thermodynamic, kinetics, mechanism and process design. Water Res 2012; 46(6):1933-46. doi: 10.1016/j.watres.2012.01.009 [Crossref] [ Google Scholar]
- Doğan M, Alkan M, Türkyilmaz A, Ozdemir Y. Kinetics and mechanism of removal of methylene blue by adsorption onto perlite. J Hazard Mater 2004; 109(1-3):141-8. doi: 10.1016/j.jhazmat.2004.03.003 [Crossref] [ Google Scholar]
- Ong ST, Lee CK, Zainal Z. Removal of basic and reactive dyes using ethylenediamine modified rice hull. Bioresour Technol 2007; 98(15):2792-9. doi: 10.1016/j.biortech.2006.05.011 [Crossref] [ Google Scholar]
- Sulak MT, Demirbas E, Kobya M. Removal of Astrazon Yellow 7GL from aqueous solutions by adsorption onto wheat bran. Bioresour Technol 2007; 98(13):2590-8. doi: 10.1016/j.biortech.2006.09.010 [Crossref] [ Google Scholar]
- Gulnaz O, Sahmurova A, Kama S. Removal of Reactive Red 198 from aqueous solution by Potamogeton crispus. Chem Eng J 2011; 174(2-3):579-85. doi: 10.1016/j.cej.2011.09.061 [Crossref] [ Google Scholar]
- Nacèra Y, Aicha B. Equilibrium and kinetic modelling of methylene blue biosorption by pretreated dead Streptomyces rimosus: effect of temperature. Chem Eng J 2006; 119(2-3):121-5. doi: 10.1016/j.cej.2006.01.018 [Crossref] [ Google Scholar]
- Seyed Mohammadi A, Asgari G, Dargahi A, Mobarakian SA. Equilibrium and synthetic equations for index removal of methylene blue using activated carbon from oak fruit bark. Journal of Mazandaran University of Medical Sciences 2015; 24(121):172-87. [ Google Scholar]
- Langmuir I. The adsorption of gases on plane surfaces of glass, mica and platinum. J Am Chem Soc 1918; 40(9):1361-403. doi: 10.1021/ja02242a004 [Crossref] [ Google Scholar]
- Salman T, Temel FA, Turan NG, Ardali Y. Adsorption of lead (II) ions onto diatomite from aqueous solutions: mechanism, isotherm and kinetic studies. Global NEST Journal 2015; 18(1):1-10. [ Google Scholar]
- SamadI MT, ShokOohi R, PoormohammadI A, Azarian G, Harati M, Shanesaz S. Removal of bisphenol, using antimony nanoparticle multi-walled carbon nanotubes composite from aqueous solutions. Orient J Chem 2016; 32(2):1015-24. doi: 10.13005/ojc/320227 [Crossref] [ Google Scholar]
- Boparai HK, Joseph M, O’Carroll DM. Kinetics and thermodynamics of cadmium ion removal by adsorption onto nano zerovalent iron particles. J Hazard Mater 2011; 186(1):458-65. doi: 10.1016/j.jhazmat.2010.11.029 [Crossref] [ Google Scholar]
- Aharoni C, Sparks DL, Levinson S, Ravina I. Kinetics of soil chemical reactions: relationships between empirical equations and diffusion models. Soil Sci Soc Am J 1991; 55(5):1307-12. doi: 10.2136/sssaj1991.03615995005500050019x [Crossref] [ Google Scholar]
- Wang XS, Qin Y. Equilibrium sorption isotherms for of Cu2+ on rice bran. Process Biochem 2005; 40(2):677-80. doi: 10.1016/j.procbio.2004.01.043 [Crossref] [ Google Scholar]
- Akkaya G, Özer A. Biosorption of Acid Red 274 (AR 274) on Dicranella varia: determination of equilibrium and kinetic model parameters. Process Biochem 2005; 40(11):3559-68. doi: 10.1016/j.procbio.2005.03.048 [Crossref] [ Google Scholar]
- Pearce CI, Lloyd JR, Guthrie JT. The removal of colour from textile wastewater using whole bacterial cells: a review. Dyes Pigm 2003; 58(3):179-96. doi: 10.1016/S0143-7208(03)00064-0 [Crossref] [ Google Scholar]
- Dubinin MM. The potential theory of adsorption of gases and vapors for adsorbents with energetically nonuniform surfaces. Chem Rev 1960; 60(2):235-41. doi: 10.1021/cr60204a006 [Crossref] [ Google Scholar]
- Dubinin MM. Modern state of the theory of volume filling of micropore adsorbents during adsorption of gases and steams on carbon adsorbents. Zhurnal Fizicheskoi Khimii 1965; 39(19):1305-17. [ Google Scholar]
- Radushkevich L. Potential theory of sorption and structure of carbons. Zhurnal Fizicheskoi Khimii 1949; 23(12):1410-20. [ Google Scholar]
- Ho YS, Ofomaja AE. Kinetics and thermodynamics of lead ion sorption on palm kernel fibre from aqueous solution. Process Biochem 2005; 40(11):3455-61. doi: 10.1016/j.procbio.2005.02.017 [Crossref] [ Google Scholar]
- Ghaedi M, Ansari A, Habibi MH, Asghari AR. Removal of malachite green from aqueous solution by zinc oxide nanoparticle loaded on activated carbon: kinetics and isotherm study. J Ind Eng Chem 2014; 20(1):17-28. doi: 10.1016/j.jiec.2013.04.031 [Crossref] [ Google Scholar]
- Lagergren S. Zur Theorie der Sogenannten Adsorption Gelöster Stoffe, Kungliga Svenska Vetenskapsakademiens. Handlingar 1898; 24(4):1-39. [ Google Scholar]
- Ho YS, McKay G, Wase DAJ, Forster CF. Study of the sorption of divalent metal ions on to peat. Adsorp Sci Technol 2000; 18(7):639-50. doi: 10.1260/0263617001493693 [Crossref] [ Google Scholar]
- Chien SH, Clayton WR. Application of Elovich equation to the kinetics of phosphate release and sorption in soils. Soil Sci Soc Am J 1980; 44(2):265-8. doi: 10.2136/sssaj1980.03615995004400020013x [Crossref] [ Google Scholar]
- Weber WJ, Morris JC. Kinetics of adsorption on carbon from solution. Journal of the Sanitary Engineering Division 1963; 89(2):31-60. [ Google Scholar]
- Srinivasan K, Balasubramanian N, Ramakrishna T. Studies on chromium removal by rice husk carbon. Indian J Environ Health 1988; 30(4):376-87. [ Google Scholar]
- Behnamfard A, Salarirad MM. Equilibrium and kinetic studies on free cyanide adsorption from aqueous solution by activated carbon. J Hazard Mater 2009; 170(1):127-33. doi: 10.1016/j.jhazmat.2009.04.124 [Crossref] [ Google Scholar]
- Hameed BH, Krishni RR, Sata SA. A novel agricultural waste adsorbent for the removal of cationic dye from aqueous solutions. J Hazard Mater 2009; 162(1):305-11. doi: 10.1016/j.jhazmat.2008.05.036 [Crossref] [ Google Scholar]
- Ho YS. Removal of copper ions from aqueous solution by tree fern. Water Res 2003; 37(10):2323-30. doi: 10.1016/s0043-1354(03)00002-2 [Crossref] [ Google Scholar]
- Ravanan M, Ghaedi M, Ansari A, Taghizadeh F, Elhamifar D. Comparison of the efficiency of Cu and silver nanoparticle loaded on supports for the removal of Eosin Y from aqueous solution: kinetic and isotherm study. Spectrochim Acta A Mol Biomol Spectrosc 2014; 123:467-72. doi: 10.1016/j.saa.2013.12.049 [Crossref] [ Google Scholar]
- Ahmadi K, Ghaedi M, Ansari A. Comparison of nickel doped Zinc Sulfide and/or palladium nanoparticle loaded on activated carbon as efficient adsorbents for kinetic and equilibrium study of removal of Congo Red dye. Spectrochim Acta A Mol Biomol Spectrosc 2015; 136 Pt C:1441-9. doi: 10.1016/j.saa.2014.10.034 [Crossref] [ Google Scholar]