Avicenna J Environ Health Eng. 10(1):18-31.
doi: 10.34172/ajehe.2023.4228
Original Article
Spatial Distribution of Lead in the Soil of Urban Areas Under Different Land-Use Types
Amin Allah Pasgar 1, 2  , Mohammad Malakootian 1, 2, *
Author information:
1Environmental Health Engineering Research Center, Kerman University of Medical Sciences, Kerman, Iran
2Department of Environmental Health, School of Public Health, Kerman University of Medical Sciences, Kerman, Iran
Abstract
Awareness of lead (Pb) distribution and zoning in urban, agricultural, and industrial areas is of particular importance in environmental protection planning. This cross-sectional study aimed to determine the distribution of Pb in different uses with different levels of industrial development and human activities in urban areas in Hamadan during 2018. For this purpose, 146 soil samples were collected from 0-20 cm depth and prepared for air-dried laboratory analyses. Then, pH, electrical conductivity (EC), total Pb, and adsorbable Pb in the soil were measured. The results demonstrated that the mean concentration of total Pb is 88 mg/kg. In addition, the mean concentration of Pb in urban, industrial, and agricultural areas was 41 mg/kg, 30 mg/kg, and 17 mg/kg, respectively. Further, the average concentration of adsorbable Pb with a standard deviation of 0.3 in industrial, urban, and agricultural areas was 0.38 mg/kg, 0.16 mg/kg, and 0.06 mg/kg. Land use was an important source of Pb change in the studied soils; however, Pb change did not depend only on land use. Factors such as weather conditions or proximity to roads, as well as previous land uses, could affect the role of existing land use and be effective in the distribution of soil Pb. Studies revealed that the amount of the soil’s adsorbable Pb is more important than that of total Pb in different uses, which should be considered in any soil-related research.
Keywords: Soil contamination, Heavy metals, Lead, Spatial distribution, Hamadan,
Copyright and License Information
© 2023 The Author(s); Published by Hamadan University of Medical Sciences.
This is an open-access article distributed under the terms of the Creative Commons Attribution License (
https://creativecommons.org/licenses/by/4.0), which permits unrestricted use, distribution, and reproduction in any medium, provided the original work is properly cited.
Please cite this article as follows: Pasgar AA, Malakootian M. Spatial distribution of lead in the soil of urban areas under different land-use types. Avicenna J Environ Health Eng. 2023; 10(1):18-31. doi:10.34172/ajehe.2023.4228
1. Introduction
Heavy metal contamination in the soil does directly affect the physical and chemical properties of the soil and, consequently, its function. Heavy metals enter water resources and the food chain through the soil and are a serious threat to human health. They enter the soil through various sources such as industrial and mineral activities, chemical fertilizers, and wastewater. One of the most important metals is lead (Pb), which can enter the food chain in various ways (water, air, and soil) and the body of living organisms. After entering the digestive system, Pb is actively absorbed through mucus transport proteins by the calcium transporter and enters the bloodstream after absorption. The presence of heavy metals such as Pb in sewage irrigation water pollutes agricultural soils and vegetables (1,2). Pb poisoning is the most common cause of contamination (1). In fact, Pb is one of the first pollutants in the U.S. Environmental Protection Agency due to its significant spread and presence in waste sites and the known harmful effects on ecosystems and the environment. Pb transfer and distribution in the soil are affected by a set of chemical processes such as oxidation and reduction, uptake by cations on exchange sites, chelation with organic compounds and metal oxides, and uptake by plants. Heavy metals reach the soil surface through various sources of pollution. Their outcome depends on their physical and chemical properties, and in particular on the classification of these metals (3,4). Most of these heavy metals accumulate on the soil surface and enter the food chain through adsorption by plants (5).
Among the heavy metals in the soils of six European countries, zinc (Zn) and Pb have the highest levels (6). Obviously, the type of use plays an important role in the distribution of Pb in the soil. Various studies have been conducted on the concentration of Pb in soils; however, few studies have considered the relationship between the amount of Pb concentration and the type of use (7). The pollution of roadside dirt for long periods of time is a major environmental concern. Although Pb-containing gasoline consumption is banned in most countries, there is still an increase in Pb levels in these soils (up to 7000 mg/kg). Pb imports through mining activities, burning fossil fuels, and the use of Pb in diesel and gasoline vehicles were reported by researchers in North America from the 1950s to the 1970s and in Europe until the 1980s (8). Soils in hunting and military areas have been found to be contaminated with Pb so that more than 400 tons of Pb enter the soil through military activity (9,10). The use of chemical fertilizers and insecticides also increases the concentration of heavy metals in soils. Studies have shown that the long-term use of phosphate chemical fertilizers has increased the concentration of cadmium (Cd), Pb, fluoride, and uranium in soils (11). The effect of successive application of chemical fertilizers on ecosystem pollution has been investigated in some studies (12,13). An increase in Pb in agricultural soils has been indicated to originate from the use of chemical fertilizers (14). Of the other causes of soil contamination in industrial areas are the entry of heavy metals from metal smelters and mines through surface water transfer or wind and dust flow (15). As some believe, most heavy metals such as Pb enter the environment through industrial combustion processes (16,17). The accumulation and storage of metals in soils highly depend on soil properties (18). It is necessary to know the spatial distribution of pollutants and the level of pollution in order to implement management programs (19). Determining spatial changes in soil characteristics helps better understand the complex relationships between soil characteristics and environmental factors (20). Pb distribution and its amount in different regions of Iran have been studied by some researchers, and different results have been presented on Pb distribution in different applications. Amouei et al evaluated the distribution of Pb in various applications in Amol and Babol and reported the highest amount of Pb in industrial lands (15). Likewise, Hani et al used statistical methods to determine the spatial distribution of Cd and Pb metals in surface soils in Ahvaz, and the basic radial functions of the best internalization method were selected among them (21). Malakootian and Khashi measured the concentration of heavy metals (Arsenic, Cd, Pb, and copper [Cu]) in drinking water resources in the villages of the southeast of Rafsanjan plain, and the results showed that there was natural and human origin of pollution for some parts of the region to these metals (22). Salimi et al examined changes in Pb and Cd in the soil of Saveh and rapeseed in the margins of highways (23). Mirzaei Aminiyan et al found that the greatest amount of pollution was related to the congestion traffic of vehicles and industrial areas (24). The use of introspection techniques in the geographic information system (GIS) environment makes it possible to obtain a general picture of how heavy metals are distributed by presenting a contamination map of each metal, along with soil chemical properties, to locate areas and soils in those situations in which one or more elements are in trouble, and GIS facilities and functions may be utilized to better manage the soil. It is essential to assess the variability of waste characteristics in order to achieve a better understanding of the complex relationships between factors. With the rapid growth of technology and computer software and new statistical methods such as GIS, environmental problem studies have become easily possible. The use of statistical techniques by considering the GIS computer program to determine the spatial distribution of heavy metals in urban areas has been reported by various researchers (25-27).
The contamination of natural resources, including soil, with heavy metals is ignored in developed countries due to environmental regulations. However, in developing countries, it is on the rise. In Iran, chemical fertilizers are being used indiscriminately, and this has put the environment at serious risk of contamination with chemical fertilizers and, in particular, heavy metal pollution. Roads are the second largest source of pollution, creating pollution in the urban environment (28).
Traffic causes serious problems, especially in large cities with high population densities. Road traffic is the most important source of Pb pollution in urban areas. Industrial pollution has been and continues to be a major cause of environmental degradation. Numerous studies have demonstrated that areas around industries are exposed to significant air, soil, and water pollution through industrial activities. Mining development is one of the causes of pollution, among which sulfide mines are important in the extraction stage due to the increased concentration of heavy elements. The heavy metals released into the mineral waste dams are due to the effects of natural processes and condensing plants (29). The role of heavy metals in the distribution of heavy metals has attracted the attention of many researchers, and several studies have been conducted in this field. Although information on the distribution of heavy metals has been well documented in many developed countries, there is less information in this regard in developing countries (30). In these countries, urbanization and human population growth and land use development are uncontrolled and unplanned, leading to many problems. Therefore, it is necessary to identify the spatial pattern of urban soil pollution in these areas. Those areas where there is a risk of contamination can be identified by zoning these areas (31).
Thus, awareness of how Pb is distributed in different parts of the urban target lands with different uses, in order to provide a map of Pb contamination, is of special importance, which was the focus of this research.
2. Materials and Methods
2.1. The Study Area
This applied cross-sectional study was conducted in 2018 in Hamedan, located in the west of Iran. The dominant geological formations in the region include alluvial terraces related to the Quaternary geological period, as well as orbital limestone, shale, and marl limestone formations related to the late Cretaceous and Cretaceous periods. Moreover, the other geological formations were andesitic lava and fine limestone belonging to the early Neogene and Late Paleogene (32). Fig. 1 shows the location of Hamadan in Iran.
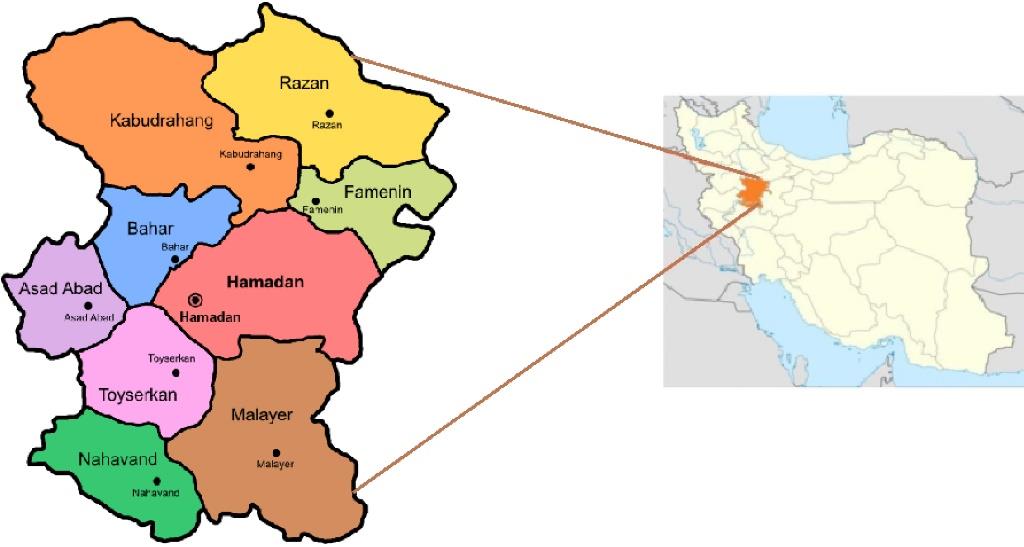
Fig. 1.
Location of Hamedan, Iran
.
Location of Hamedan, Iran
2.2. Geostatistical and Statistical Measurement
Multivariate analysis, including principal component analysis (PCA), was performed for the classification of samples using SPSS 16 software. The extracted statistical parameters were minimum, maximum, average, skewness and strain of raw data, histogram, Q-Q graph, and data normality. The data of the natural sciences do not always have a normal distribution, it is therefore important to determine the normality of the raw data. However, in cases where the data do not have a normal distribution, the Mann-Whitney test was used to compare the mean of the groups, and the Spearman correlation test was employed to determine the correlation of the measured parameters. In situations where the data were normalized by logarithmic conversion, the mean of the groups was compared by Duncan’s test and Pearson’s test to estimate the correlation of the parameters.
The skewness indicates the degree or level of symmetry around the mean. The positive and negative numbers represent the symmetry to the right and left, respectively. While the number zero denotes the symmetry around the mean, the elongation refers to the elongation level or flatness (flatness) of a curve relative to a normal standard curve. Spatial dependence was analyzed by calculating the semivariogram based on Eq. (1):
(1)
where γ (h) and Z (xi) represent half the variance in the desired distance and the value of the variable Z in the position xi, respectively, and N (h) is the number of pairs of points that are as far apart as h. The three main parameters for interpreting semivariogram spatial dependence are amplitude (A0), nugget effect (C0), and sill (C0+C). The nugget effect indicates changes that are either caused by accidental factors such as measurement errors or cannot be detected at the shortest distance. The half-variance value is usually increased by increasing the sampling interval and then reaching a constant value called the sill. The amplitude represents the range at which the points interact with each other locally or the distance that the semivariogram reaches the sill. Variograms can be described using theoretical models such as linear, spherical, exponential, and Gaussian. Prior to drawing the semivariogram, data that had abnormal distribution were normalized using logarithmic conversion. The selection of the best model adapted to the semivariogram was based on the maximum value of the coefficient of determination and the sum of the remaining squares. Data were interpolated in non-sampled points using Kriging’s method and circular, spherical, exponential, and Gaussian models, and then zoning maps were prepared based on the results. To compare the accuracy and predictability of the predictions, the mean error square root (RMSE) and correlation coefficient (R2) were used for the data. Of course, the values calculated to the model are closer to the actual values when the RMSE values are smaller, and therefore the model has less error, and the correlation between the observed and predicted values is higher when the correlation coefficient is closer to one. To perform interpolation using the conventional Kriging’s method, it is necessary to employ data with normal distribution. GS + v.10 (2016) statistical program was utilized to analyze the spatial structure of the desired parameters and prepare zoning maps.
The units of the study population were classified into groups that were more homogeneous in terms of variable traits. Several samples were randomly selected from each class. Overall, 146 samples, including 51, 46, and 49 soil samples, were collected from 0-20 cm depth of agricultural, industrial (Shahid Mofteh power plant, Bouali industrial town, and Baharan industrial town), and urban lands, respectively. Then, the soil samples were air-dried for 24 hours and passed through a 2 mm sieve and prepared for analysis. The electrical conductivity (EC) and pH of the samples were measured in one to five soil-to-water extracts by EC meters and electric pH meters. The absorbable Pb extract and total Pb were obtained by diethylenetriaminepentaacetic acid extractor and normal 4 nitric acid (by the acid digestion method), respectively. Pb levels in the samples were estimated using an atomic absorption device (32,33).
2.3. Anisotropy in Semivariogram Models
When soil characteristics are directional, to study the effect of direction on soil properties, it is necessary to calculate the semivariogram in different directions. If the spatial correlation structure is similar in all directions, the toxicity of the variogram has isotropic properties; in this case, the semivariogram depends only on the distance and has no effect on the direction. In many cases, some features demonstrate different correlation patterns in different directions, thus the semivariogram model of anisotropy should be used to reflect these differences (34,35). To control the directional dependence in the experimental semivariogram, semivariogram values should be calculated for the pairs of data that are in bands with a specific direction and in a delay range. The directed bands are characterized by direction, angular resistance, and bandwidth. Bandwidth is the range of software applied to determine the pair of points where a semivariogram is drawn.
3. Results and Discussion
Table 1 provides the results of soil characteristics, including pH, EC, adsorbable Pb, and total Pb in different parts of Hamedan.
Table 1.
Soil Characteristics, Including pH, EC, Adsorbable Lead, and Total Lead in Different Parts of Hamadan
|
|
No of Samples
|
Minimum
|
Maximum
|
SD
|
Mean
|
Variation Coefficient
|
Skewness
|
Elongation
|
| pH |
146 |
5.2 |
10.3 |
0.7 |
7.9 |
0.1 |
-0.7 |
2.1 |
| EC (µS/cm) |
146 |
0.01 |
2.2 |
0.3 |
0.3 |
1.0 |
0.4 |
-0.3 |
| Adsorbable lead (mg/kg) |
146 |
0.0 |
3.7 |
0.4 |
0.2 |
2.0 |
0.08 |
-0.4 |
| Total lead (mg/kg) |
146 |
0.06 |
1045 |
24 |
22 |
1.1 |
-0.4 |
0.5 |
Note. EC: Electrical conductivity; SD: Standard deviation.
Among the parameters, only pH data had a normal distribution, and the other three parameters were not normally distributed. The pH and total Pb had a negative skewness, while the other parameters had a positive skewness. On the other hand, EC and absorbable Pb had a negative elongation.
3.1. Correlation Between Soil Characteristics
The results of the correlation coefficient between the characteristics of soil (pH, EC, absorbable Pb, total Pb) in different applications (agriculture, industrial, and urban) in the study area are presented in Table 2.
Table 2.
Correlation Coefficient Between the Characteristics of Soil (pH, EC, absorbable lead, Total Lead) in Different Applications (Agriculture, Industrial, and Urban) in Hamedan
|
Use
|
No of Samples
|
|
pH
|
EC
|
Adsorbable Lead
|
Total Lead
|
| Total use |
|
pH |
1 |
- |
- |
- |
|
|
EC |
0.121 |
1 |
- |
- |
| 146 |
Adsorbable lead |
-0.036 |
0.026 |
1 |
- |
|
|
Total lead |
-0.097 |
-0.08 |
0.356**
|
1 |
| Agriculture |
|
pH |
1 |
- |
-
|
- |
|
|
EC |
-0.38**
|
1 |
-
|
- |
| 51 |
Adsorbable lead |
-0.085 |
0.098 |
1 |
- |
|
|
Total lead |
0.098 |
0.1 |
0.895**
|
1 |
| Industrial |
|
pH |
1 |
- |
- |
- |
|
|
EC |
0.367*
|
1 |
- |
- |
| 46 |
Adsorbable lead |
0.12 |
-0.2 |
1 |
- |
|
|
total lead |
0.073 |
-0.083 |
0.346*
|
1 |
| Urban |
|
pH |
1 |
- |
- |
- |
|
|
EC |
0.089 |
1 |
- |
- |
| 49 |
Adsorbable lead |
-0.219 |
0.274 |
1 |
- |
|
|
Total lead |
-0.391 |
0.026 |
0.399*
|
1 |
Note. EC: Electrical conductivity. *p < 0.05 **p < 0.01.
The strong correlation between total Pb and adsorbable Pb shows the same origin of metals.
3.2. Multi-variable Analyses to Determine Pollution Source
Table 3 provides the normal matrix of the soil properties of the study areas. Based on PCA analysis, total Pb and absorbable Pb, as well as pH and EC were classified as primary and secondary components, respectively. Considering that the total Pb and absorbable Pb were placed in one category, the source of the contamination of these two components was the same.
Table 3.
Normal Matrix of the Soil Properties of the Study Areas in Hamadan
|
Element/Factor
|
Primary Component
|
Secondary Component
|
| pH |
- |
0.61 |
| EC |
- |
0.71 |
| Adsorbable lead |
0.69 |
- |
| Total lead |
0.79 |
- |
Note. EC: Electrical conductivity.
3.3. Examining the Interpolation Methods and Choosing the Best Method
Based on the Kolmogorov-Smirnov test, it was found that the distribution of total and adsorbable Pb values was not normal, and normalization was required before using them in the Kriging’s method. By converting the data under the logarithmic function, the data distribution becomes symmetrical and closer to the normal distribution. Interpolation with conventional Kriging’s method was performed for all four parameters using four spherical, exponential, and Gaussian models, and the optimal model was selected according to the evaluation criterion and considering the lower nugget/sill ratio and the lowest RMSE for each parameter. The nugget-to-sill ratio is also used as a criterion for classifying the location dependence of properties. If this ratio is less than 0.25%, the variables have a high spatial dependence. If it is between 0.25 and 0.75%, the variables have a moderate spatial dependence, and if it is greater than 0.75%, they have a weak spatial dependence. To predict the spatial correlation of soil properties, the best mathematical model was fitted with an experimental semivariogram. The results of verifying the semivariogram parameters of the variogram are given in Table 4.
Table 4.
Results of Verification of the Semivariogram Model of Fitting Measured Data
|
Properties
|
RMSE
|
R
2
|
Nugget
|
Sill
|
Distance
|
Model
|
Nugget/Sill
|
| pH |
0.78 |
0.97 |
0.01 |
0.58 |
175812 |
Exponential |
0.02 |
| EC |
387 |
1.24 |
0.02 |
1.19 |
580 |
Exponential |
0.02 |
| Adsorbable lead |
15 |
0.94 |
0.18 |
0.63 |
650 |
Exponential |
0.28 |
| Total lead |
22 |
0.96 |
0.21 |
0.73 |
638 |
Gaussian |
0.28 |
Note. EC: Electrical conductivity; RMSE: root-mean-square error; R2: Correlation coefficient.
The semivariogram parameters showed that with the exception of the total Pb described by the Gaussian model, the rest of the exponential model perfectly represented spatial changes in soil characteristics. The semivariogram calculation in different directions proved that the soil characteristics in this study lack anisotropic properties. The amplitude factor indicates the Pb correlation interval. After this distance, there was no connection between the variables. According to the obtained results and correlation coefficient, all soil characteristics measured in this study had a strong spatial dependence.
The maximum and minimum distances were related to pH (175182 m) and EC (580 m), respectively. The large domain indicates that the observed values of the desired parameter have been affected by the other values of that parameter over larger distances (36). Samples with distances closer to the domain have a spatial dependence, while specimens with a distance between them greater than the domain have no spatial dependence. In other words, the pH values range from 175182 m and the EC up to 580 m in spatial dependence. Although various research sources have stated different values based on their purpose as the permissible limits of metals in the soil and plants, which has made decision-making a little difficult, in most cases, these data are close to each other.
3.4. Spatial Distribution of Soil Properties
3.4.1. pH Spatial Distribution
Fig. 2 illustrates the pH spatial distribution in agricultural soils in Hamadan. Soils in the northeastern region of agricultural land have a lower pH range than other areas, and the pH of the soil was increased by moving to the west. However, in some places, the pH is close to 6, which can be detected in the zoning map. In general, soil pH ranged from 6.0 to 7.8, implying that pHchanges are more scattered in urban soils. In addition, the pH range of these soils ranged from 6.9 to 8.9, indicating that the average pH of these soils was higher than that of agricultural soils.
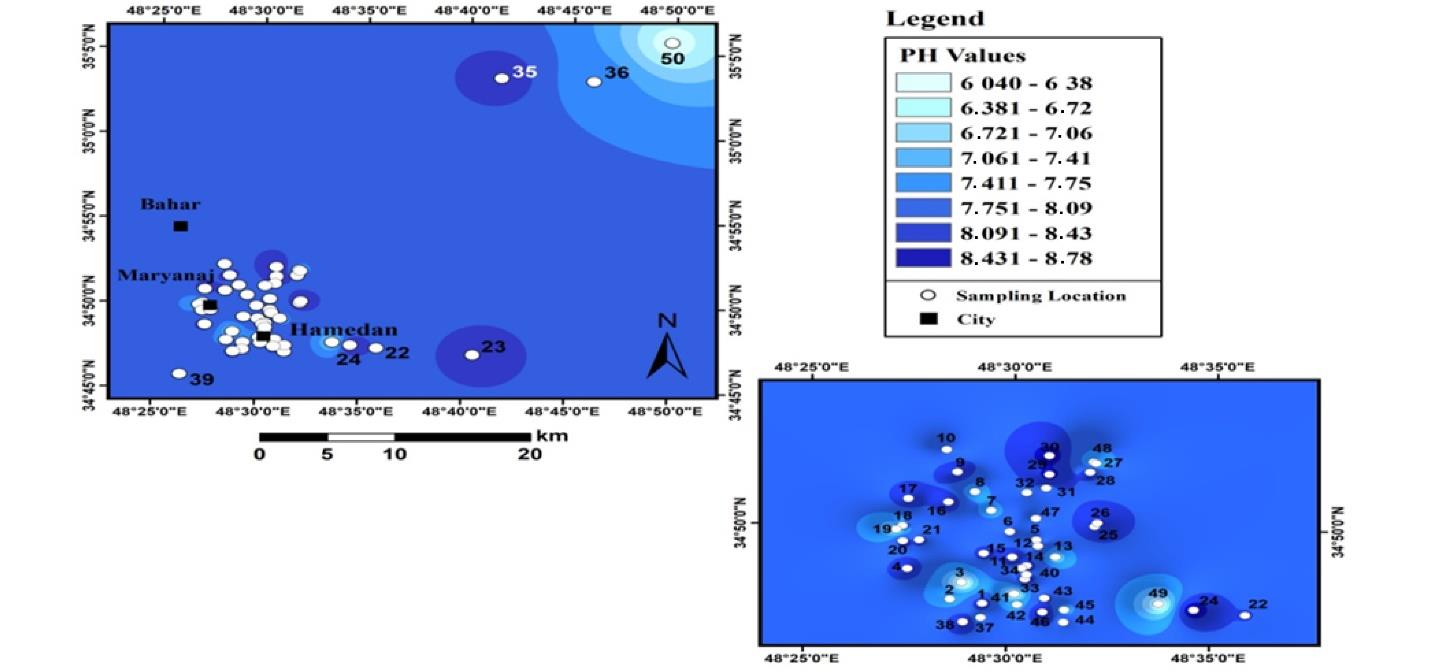
Fig. 2.
pH Distribution in Agricultural Land Soils in Hamadan
.
pH Distribution in Agricultural Land Soils in Hamadan
Fig. 3 displays the results of spatial pH distribution in urban land in Hamadan. As shown, in all geographical directions, pH is found to be different. Fig. 4 depicts the spatial distribution of pH in industrial land soils in Hamadan.
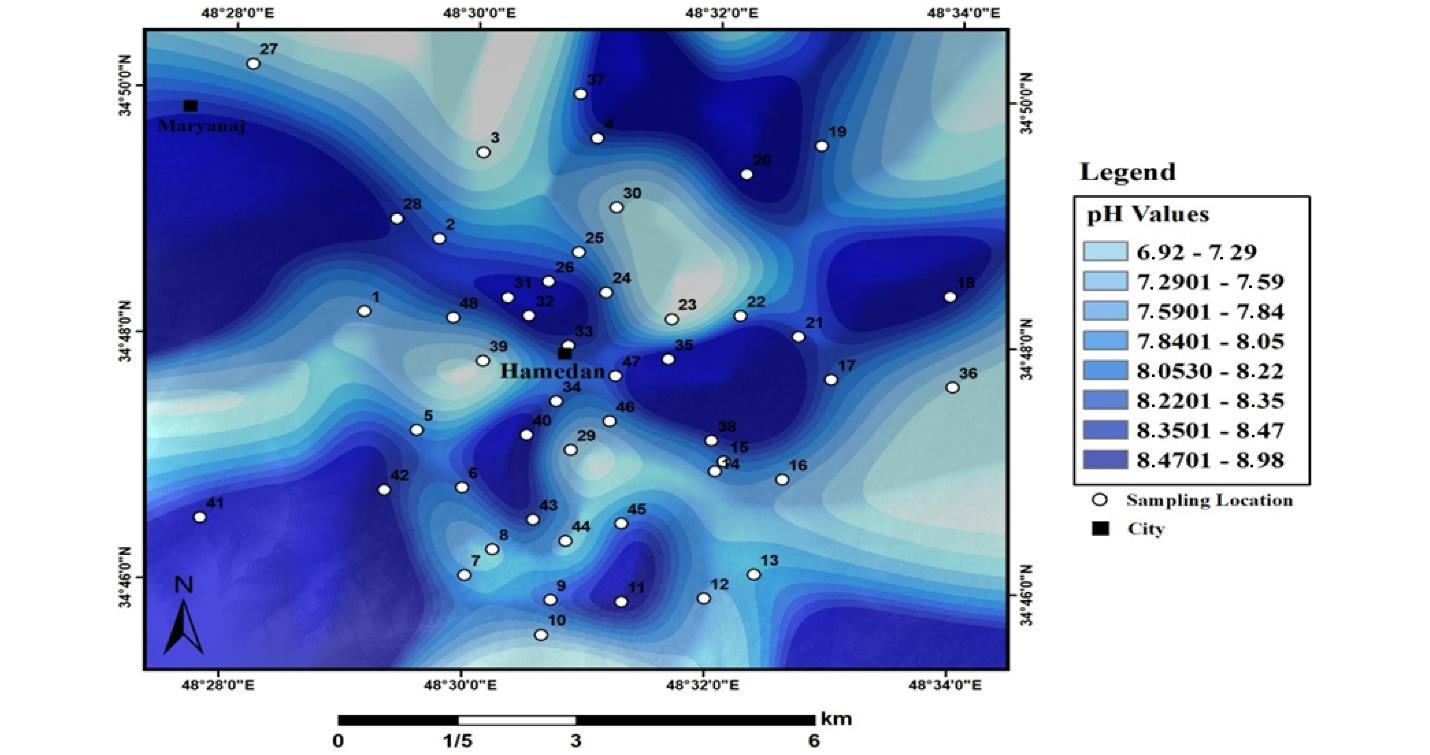
Fig. 3.
pH Distribution in Urban Land Soils in Hamadan
.
pH Distribution in Urban Land Soils in Hamadan
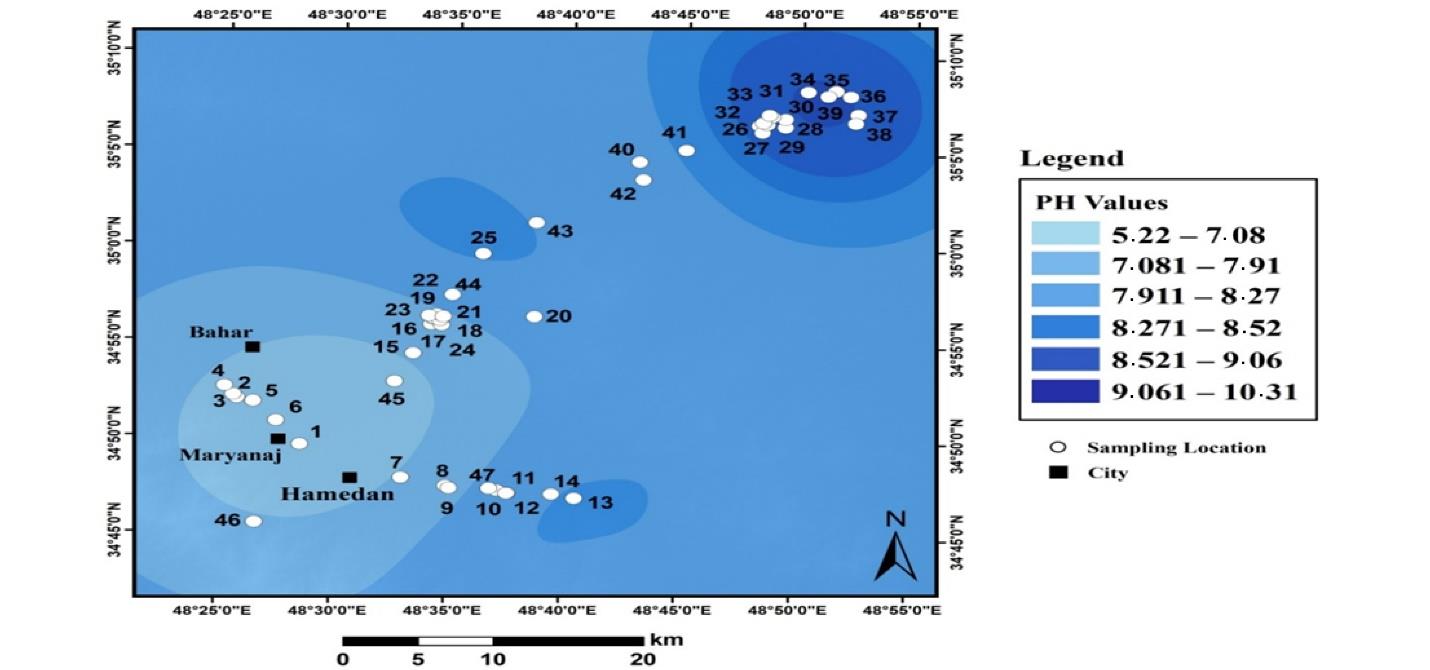
Fig. 4.
pH Distribution in Industrial Land Soils in Hamadan
.
pH Distribution in Industrial Land Soils in Hamadan
The range of pH changes in these soils varied from 5.2 to 10.3 so that it covered acidic soils to completely alkaline soils. The lowest pH was sampled in the southwestern part of the region, and the pH was increased in the northeast. The predominant pH of these samples was between 7.2 and 8.9.
3.4.2. Spatial Distribution of Electrical Conductivity
Fig. 5 shows the results of the spatial distribution of changes in the EC of agricultural lands in Hamadan. The highest values of EC were in the northeastern parts of the region and a small part in the southern part of the region with agricultural use. Most of the soils in the area had an EC of 89 to 165 µS/cm. Moreover, the average EC of the soil was 144, and the EC varied between 12 and 625 µS/cm.
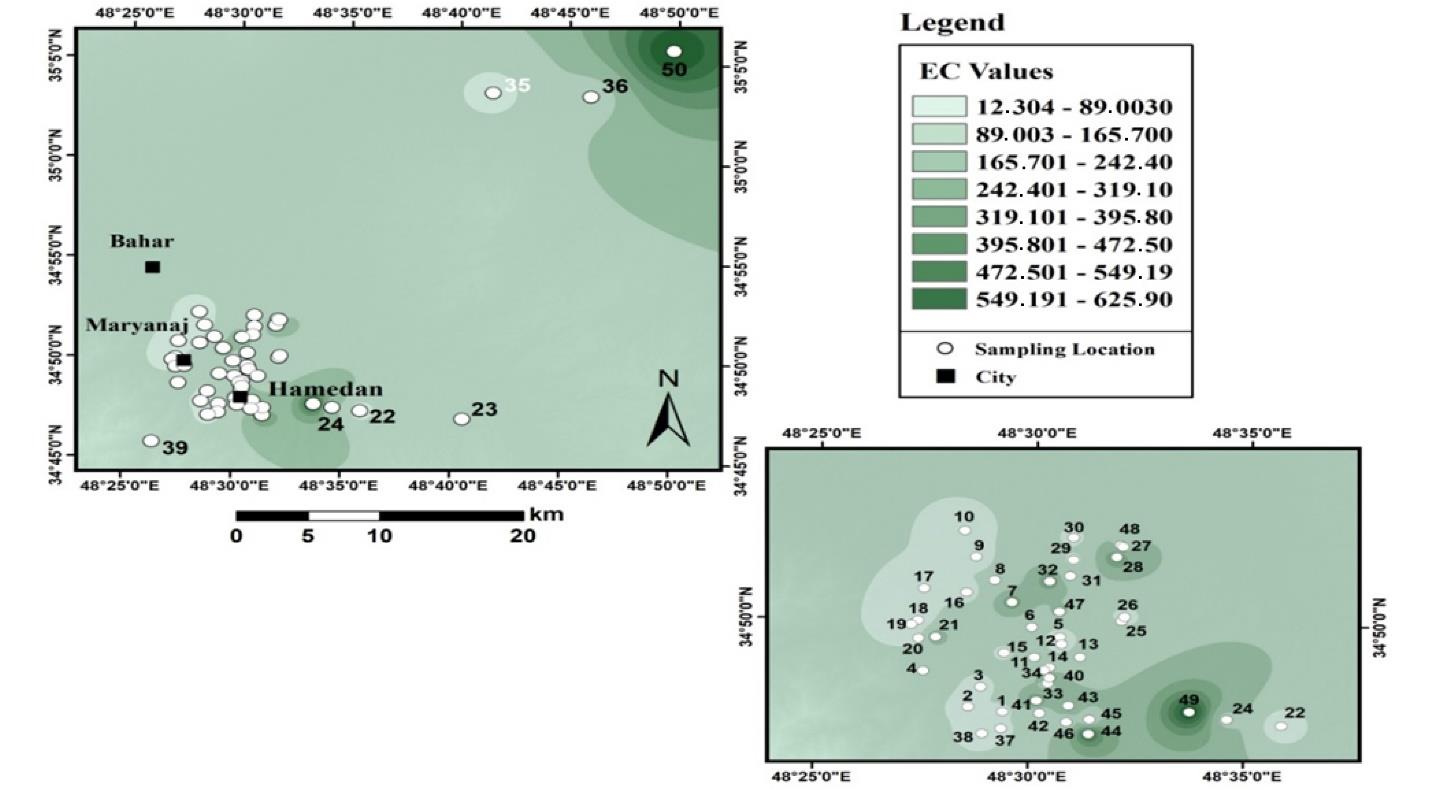
Fig. 5.
Electrical Conductivity Zoning of Agricultural Soils in Hamadan
.
Electrical Conductivity Zoning of Agricultural Soils in Hamadan
Fig. 6 illustrates the results of the spatial distribution of changes in the EC of urban lands in Hamadan.
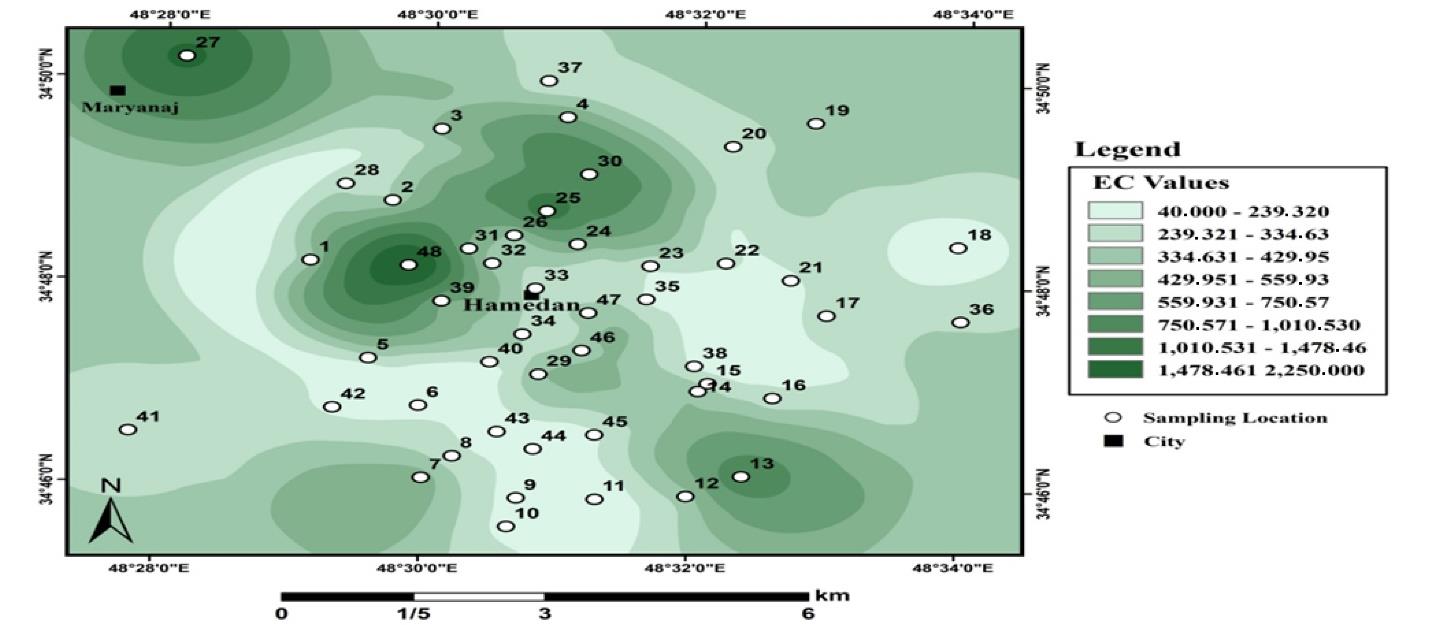
Fig. 6.
Electrical Conductivity Zoning of Urban Soils in Hamadan
.
Electrical Conductivity Zoning of Urban Soils in Hamadan
As shown, soils with different amounts of EC are distributed throughout the region. The EC of urban soils is higher than that of agricultural soils. The highest value of EC was 2250 μs/cm. The amount of EC was between 40 and 2250 variables, and the average EC was 340 µS/cm.
Fig. 7 depicts the results of the spatial distribution of changes in the EC of industrial lands in Hamadan.
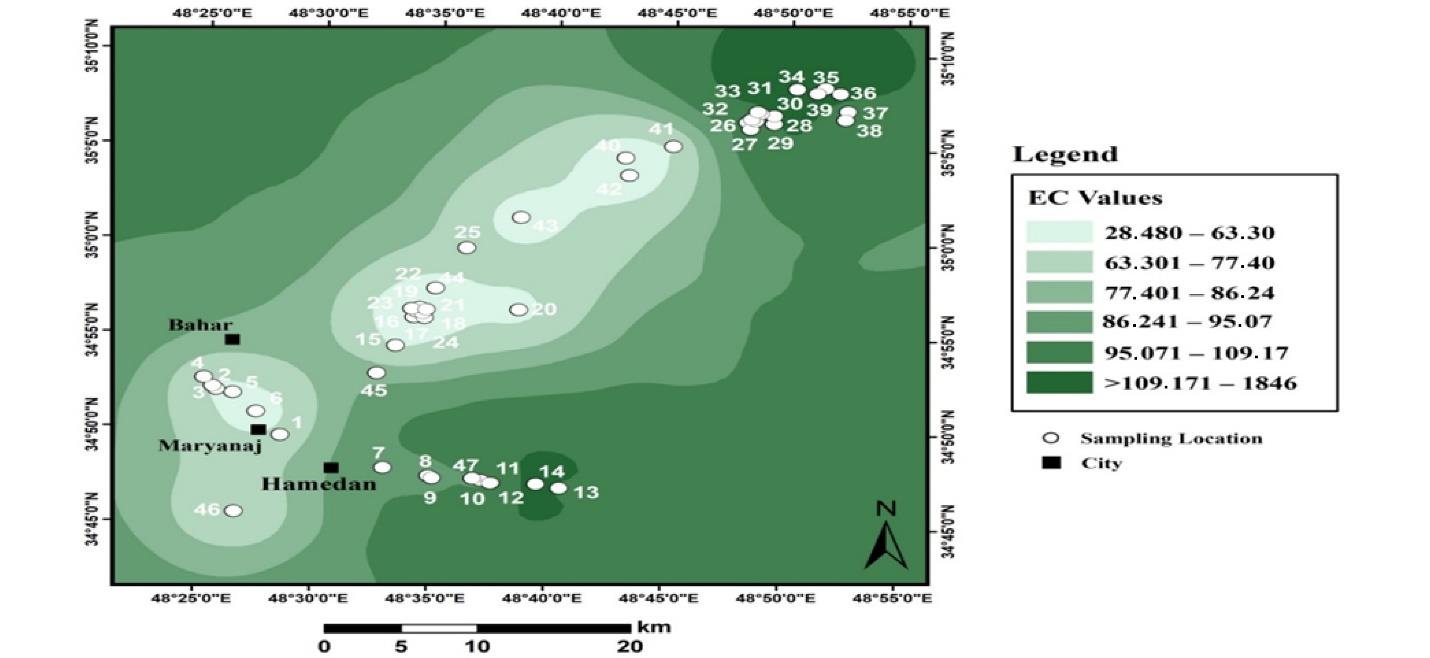
Fig. 7.
Electrical Conductivity Zoning of Industrial Soils in Hamadan
.
Electrical Conductivity Zoning of Industrial Soils in Hamadan
The results of the EC zoning of industrial soils revealed that the highest amount of EC in these soils is observed in a small area of the northeast. However, the value of this parameter increases from west to east. The lowest amount of EC is observed in the southwestern part and the center of the sampling areas. The lowest and highest values of EC are between 28 and 1840 with an average of 344 µS/cm. There was no significant difference between the EC of urban and industrial soils.
3.4.3. Spatial Distribution of Total Lead
Fig. 8 displays the results of the spatial distribution of total Pb in agricultural land in Hamadan. According to the zoning results, the total amount of Pb in agricultural lands increased from west to east, and the highest amount of total Pb was observed in a part of the northeast of the sampling points. The average total Pb in these lands was 17 mg/kg, and the highest amount of total Pb in agricultural use was 85 mg/kg.
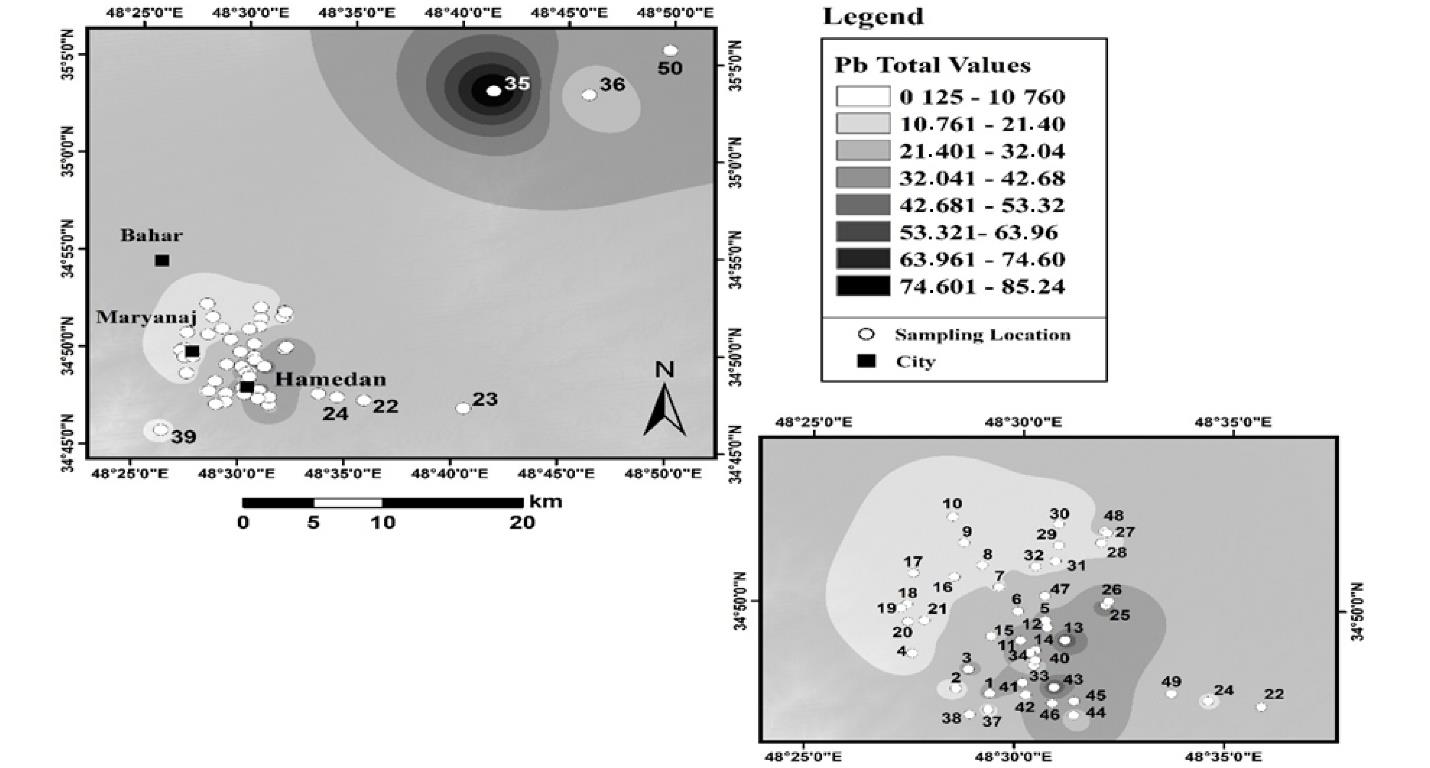
Fig. 8.
Distribution of Total Lead in Agricultural Land Use in Hamadan
.
Distribution of Total Lead in Agricultural Land Use in Hamadan
Fig. 9 shows the results of the spatial distribution of total Pb in urban land use in Hamadan. Based on the zoning results, the amount of total Pb in urban lands had a different pattern, as the lowest amount of total Pb was observed in the southern part of the sampled points. It seems that the distance from the city center and adjacency to the roads have also led to an increase in Pb. Based on the findings, the average total Pb in urban lands was 41, and the highest total Pb in these lands was 1045 mg/kg.
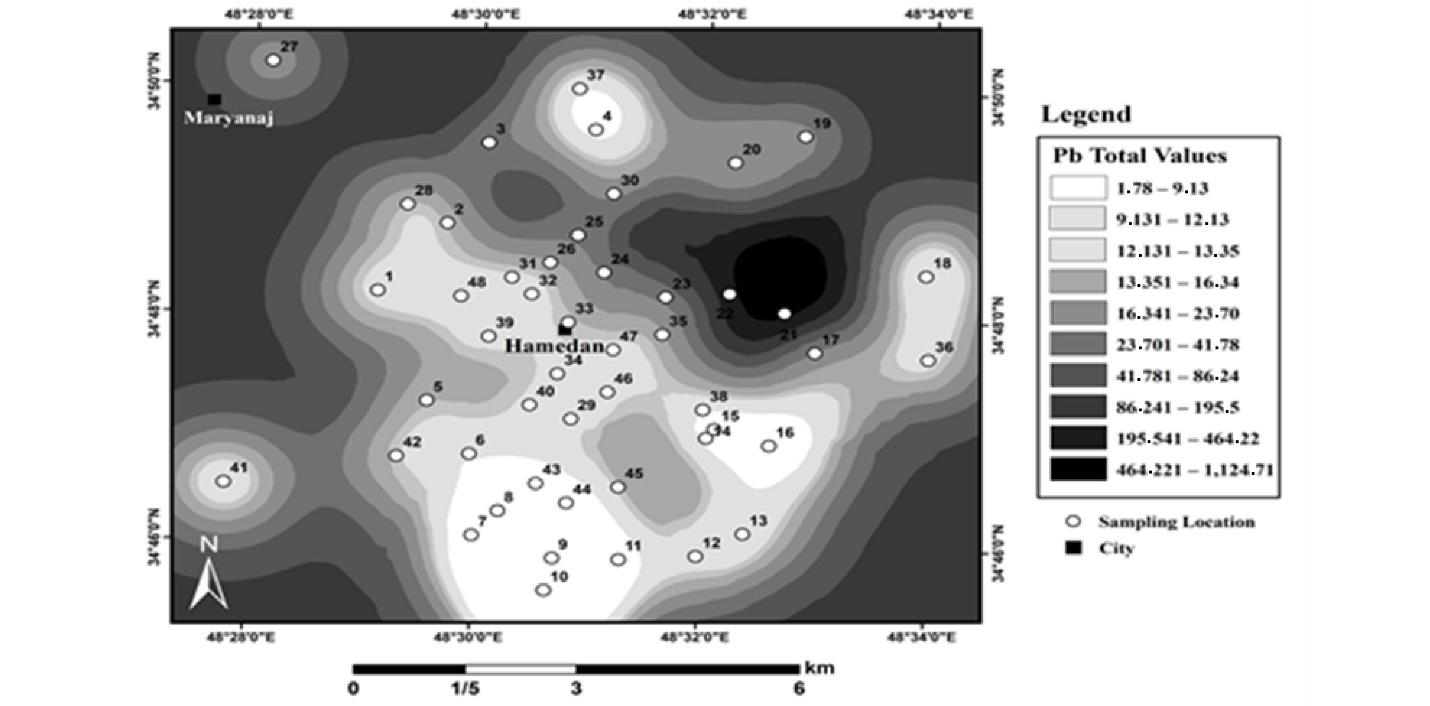
Fig. 9.
Total Lead Distribution of Urban Lands in Hamadan
.
Total Lead Distribution of Urban Lands in Hamadan
Fig. 10 illustrates the results of the spatial distribution of total Pb in industrial land in Hamadan. The average total Pb in industrial lands and the highest amount of total Pb in these lands were 30 mg/kg and 107 mg/kg, respectively. According to zoning maps, some areas with different uses had higher total Pb than the standard. Among the three studied land uses, urban land use was more polluted. The type of application could affect the amount of soil Pb, and when the degree of urbanization and industrialization increased, the concentration of soil Pb represented an increase.
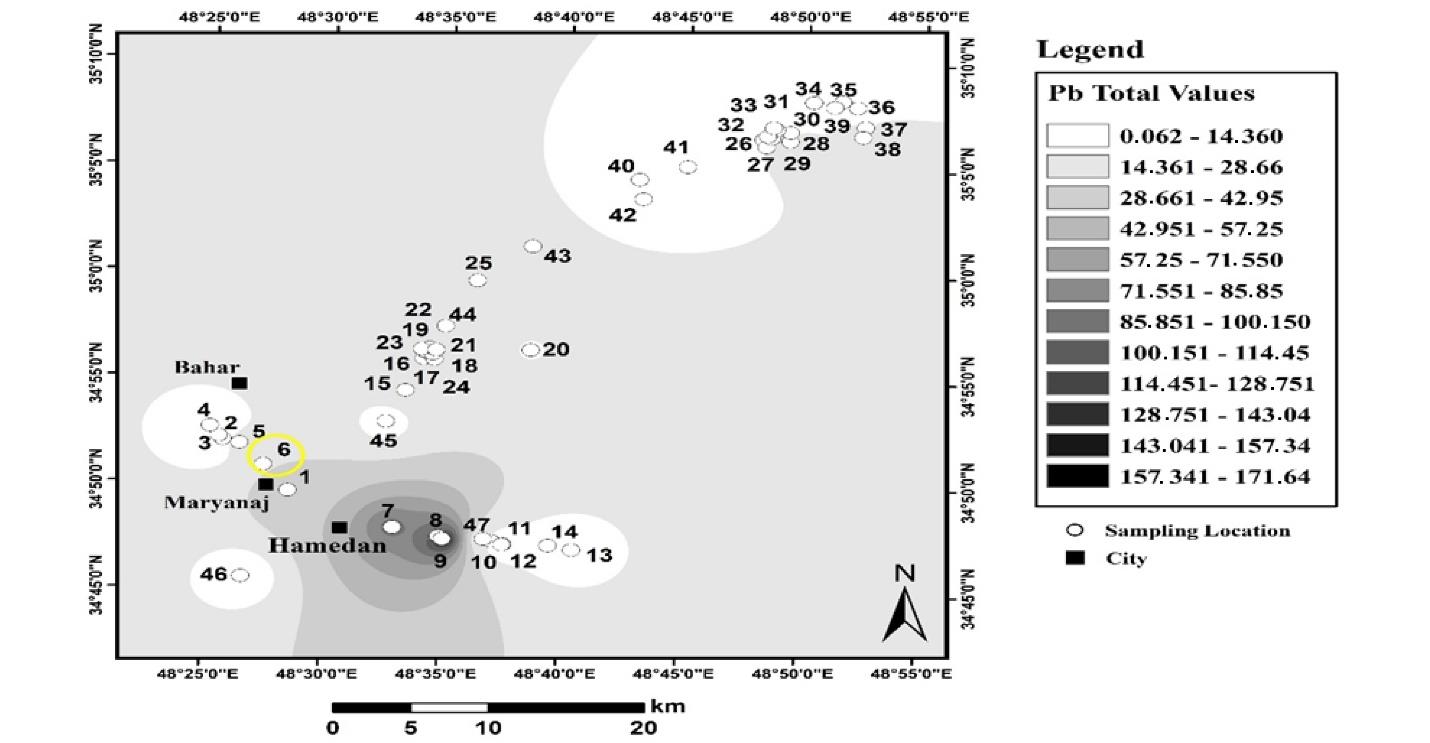
Fig. 10.
Total Lead Distribution of the Industrial Area in Hamadan
.
Total Lead Distribution of the Industrial Area in Hamadan
3.4.4. Spatial Distribution of Absorbable Lead
Fig. 11 shows the results of the spatial distribution of absorbable Pb in agricultural land in Hamadan. Absorbable Pb had the highest value in the northeastern part of the region. In addition, its average in these lands was 0.06 mg/kg, and its lowest and highest values varied between 0 and 0.31 mg/kg. Fig. 12 depicts the results of the spatial distribution of absorbable lead in urban land use in Hamadan.
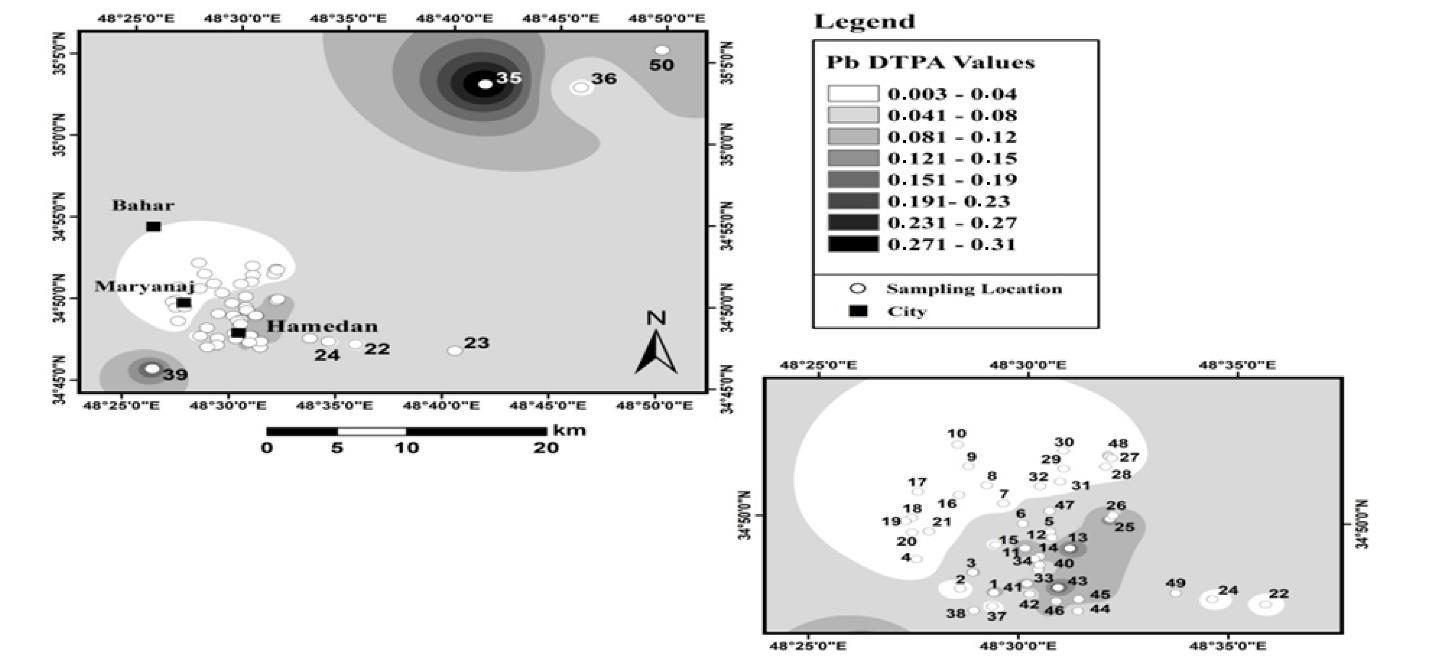
Fig. 11.
The Spatial Distribution of Absorbable Lead in Agricultural Land Use in Hamadan
.
The Spatial Distribution of Absorbable Lead in Agricultural Land Use in Hamadan
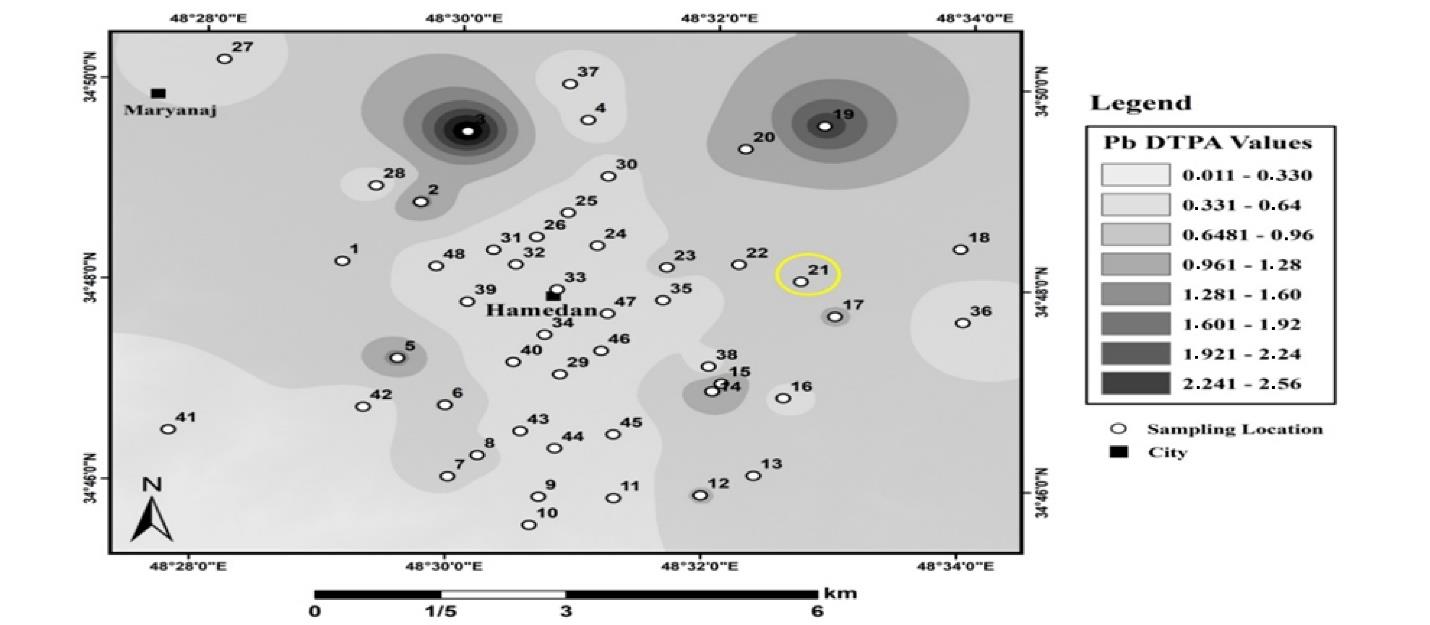
Fig. 12.
Adsorbable Lead Distribution in Urban Land Soils, Hamadan
.
Adsorbable Lead Distribution in Urban Land Soils, Hamadan
The zoning map shows that the amount of absorbable Pb was on average 0.16 mg/kg. The lowest and highest amounts of absorbable Pb in these soils were 0 and 2.5 mg/kg. Fig. 13 displays the results of the spatial distribution of absorbable Pb in industrial land in Hamadan.
Fig. 13.
Absorbable Lead Distribution in Industrial Land Soils
.
Absorbable Lead Distribution in Industrial Land Soils
The absorbable Pb of industrial lands increased from southwest to northeast. The amount of Pb in these lands varied between 0 and 3.7 mg/kg with an average of 0.38 mg/kg. In general, the average amount of absorbable Pb in industrial lands was less than that in urban lands. Although the total concentration of heavy metals is a useful indicator for assessing soil pollution, it does not provide sufficient information on the adsorption and toxicity of heavy metals. The mobility, adsorption, and toxicity of heavy metals to plants depend significantly on their chemical forms in the soil (36,37). Heavy metals are present in the soil in the form of soluble, exchange, carbonate, bound to iron and manganese oxides, organic, and residual. Their accessibility to soil is different (38), and out of different components, soluble and exchange components have greater accessibility in the soil. Therefore, determining the absorbable shape, instead of the total concentration of heavy metals, shows a more appropriate assessment of soil contamination. The results of the spatial distribution of absorbable Pb demonstrated that in all three uses, the amount of absorbable Pb is less than the critical level and the declared standard. The point of interest is the difference in the rank of pollution of the three uses. According to the results of Pb zoning, the total pollution trend in urban lands is more than in industrial lands, and in industrial lands, it is more than that in agricultural lands. The pollution trend in terms of absorbable Pb in industrial lands is greater than that in urban lands which is, in turn, greater than that in agricultural lands.
Although the amount of Pb that can be absorbed in all applications is less than the standard, and there is no problem in terms of pollution, based on the amount of Pb, the total risk of pollution in urban and industrial lands was higher than the provided standard. The results of this study demonstrated that although Pb is a whole scale for contamination in the region, available Pb, which is easily absorbed by plants and organisms and enters the food chain, can be a criterion for measuring the contamination of areas with Pb. The higher amount of Pb available in industrial lands indicates that in these areas, if animals and plants are present, Pb will easily enter the food chain and cause many problems in the long run. Since most studies have been conducted on the spatial distribution of total Pb, and the spatial distribution changes of various Pb components such as absorbable Pb have not been studied so far; thus, it is impossible to compare the results obtained in this study with those of other studies. Based on the findings of the present study, despite the higher total Pb in urban lands, the amount of absorbable Pb in these areas was less than that in industrial lands, which is of great importance. Regarding the low amount of total Pb in industrial lands, the absorbable Pb in these lands was higher, implying the possibility of higher entry of this metal into the food chain, which should be considered in further studies.
Among the parameters, only pH data had a normal distribution, and the other three parameters were abnormal; therefore, using SPSS software and logarithmic conversion, the abnormal data became normal. The study of descriptive statistics showed that pH and total Pb had a negative skewness, whereas the other parameters had a positive skewness. On the other hand, EC and absorbable Pb had a negative elongation. To determine the distribution of data, the parameter of the change coefficient is used, which is the result of dividing the standard deviation by the average data. If this parameter is less than 15%, the data diffusion is low; if it is between 15% and 35%, the average diffusion and the high diffusion data have a change coefficient above 35% (39). The data change coefficient represented that the pH and Pb properties of absorbable Pb are of low dispersion, and total Pb and EC are of extremely high dispersion. To examine the descriptive statistics of the data in the three uses, similar to the above-mentioned method, the mentioned parameters were examined in each use, and it was determined that the absorbable Pb data and the total Pb were non-normal in industrial and urban areas; however, they became normal by using logarithmic conversion. Non-normal distribution of total Pb data has been reported in many studies, which is consistent with the results of our study and those of McGrath et al in Ireland (19) and Dayani et al in the lands around Sepahanshahr-Isfahan, reporting total Pb distribution as logarithmic (40). The obtained correlation coefficient had all the characteristics of the measured soil with strong spatial dependence. The results of the study are in line with the findings of Wu et al. They reported that the spatial correlation of heavy metals was strong to medium (41). Shi et al presented a similar report on strong Pb correlation, citing spatial dependence on soil similarity, topography, and type of parent material in the Shanghai Basin of China (36). The strong dependence of Pb in the present study was due to the type of use and soil characteristics.
Of the three studied land uses, lands with urban use were more polluted. The type of application affects the amount of soil Pb, and the concentration of soil Pb increased with an increase in the degree of urbanization and industrialization. The researchers reported a positive correlation between the concentration of soil metals, especially Pb, and urbanization. Distance from the city center is a good predictor of metal concentration, and soil Pb varies between the city center, the suburbs, and rural areas. Amouei et al reported the highest amount of Pb contamination on highways in adjacent urban lands in the north of the country (15). The results of the current study conform to those obtained by Mirzaei Aminiyan et al in Kerman (Iran). The highest amount of pollution was related to urban and regional centers with high traffic of vehicles and industrial areas (24). However, most studies in developed countries and some parts of the world have reported the highest pollution in industrial areas. One of the reasons for the difference in studies conducted in Iran and developed countries can be the increase in the number of vehicles in recent years in Iran and the use of unsuitable and Pb-contaminated fuels. However, strict laws on fuel use have been developed in developed countries. Kim and Ferguson in New Zealand in 1994 and Das et al in India believed that major heavy metals such as Pb enter the environment through industrial combustion processes (16,17). Amouei et al examined the distribution of Pb in various uses in Amol and Babel and found that the highest amount of Pb was observed in industrial lands. The amount of Pb in industrial lands, agriculture, and highways was 84 + 38, 19.7 ± 9.5, and 213 + 132, respectively. These values are higher than the standards defined by the Environmental Protection Organization of Iran (50 mg/kg), which are consistent with our results (15). In another study, Glennon et al in Ireland reported that the average surface soil concentration of industrial soils in residential areas and managed and uncultivated lands was 174, 70, 80, and 50 mg/kg, respectively (42).
In a study by Birke et al in Germany, the concentrations of Pb in high-population residential areas, industrial areas, and agricultural land were reported at 87, 109, and 25 mg/kg, respectively (43). It is clear that industrial sites, especially those that have long been in industrial use, are more prone to spot pollution. The distribution of heavy metals is related to the type of land use (44). In industrial areas, more Pb is accumulated than in other uses (45). Shi et al found that the highest levels of metal pollution are related to industrial, urban, and agricultural lands, respectively (46). It is obvious that the type of use plays an important role in the distribution of Pb in the soil. However, in some cases, the recorded land use is based on the current state of the land, while past land use in urban and industrial areas has been neglected during sampling (47). The effect of use in some areas can be ambiguous; for example, industrial lands may have been converted to other uses in some areas. The second case is that atmospheric sediments play an important role in the amount of Pb in soils, especially before restricting the use of Pb-containing fuels. The effect of atmospheric sediments may complicate the effect of land use on Pb distribution, which should be considered in studies. In some cases, industrialization and urbanization have been shown to increase pollution in agricultural land, and the highest levels of pollution are observed in the suburbs and industrial centers.
On the other hand, the widespread use of chemical fertilizers in agricultural lands pollutes agricultural soils with heavy metals such as Cd, Zn, Pb, and Cu (48). Li et al reported that as metropolitan construction continued, heavy metals were transported to the river, contaminating irrigated land with river water so that the concentration of these metals in cultivated lands exceeded the source of pollution in most cases. It is necessary to determine the amount of metal distribution in different uses due to the complexity of natural systems (49). The results of a study by Liao et al in China revealed that the distribution of Pb, Cu, and chromium was also influenced by land use and land use history (50). Several research sources have stated different values based on their purpose, including the allowance of metals in soil and plants, which has made decision-making a bit difficult; however, in most cases, these data are close to each other. Three standards for critical Pb in the soil have been reported by the U.S. Environmental Protection Agency, at 100, 10, and 10 mg/kg, respectively (34,51). Zhang et al (37) reported the high Pb concentration in some regions of China. According to the results obtained by Karami et al in Hamadan, the concentration of Pb in various parent materials was 23 mg/kg on average. Therefore, higher values in some of the samples of the studied soils present indicated the entry of these metals through human activities (52).
4. Conclusion
In general, land use is an important source of Pb change in the soil. However, Pb change does not only depend on land use. Factors such as weather conditions or precipitations or proximity to roads, and previous land use can affect land use and be effective in the distribution of soil Pb. Soils in the northeastern region of agricultural land had a lower pH range than the other areas, and the pH of the soil was increased by moving west. The highest values of EC were in the northeastern parts of the region, and a small part was observed in the southern part of the region with agricultural use. According to the zoning results, the total amount of Pb in agricultural lands increased from west to east, and the highest amount of total Pb was observed in a part of the northeast of the sampling points. The average total Pb in these lands was 17 mg/kg, and the highest amount of total Pb in agricultural use was 85 mg/kg. According to the zoning results, the amount of total Pb in urban lands had a different pattern, as the lowest amount of total Pb was observed in the southern part of the sampled points. It seems that the distance from the city center and adjacency to the roads could also increase Pb. Among the three studied land uses, urban land use was more polluted. The type of application affected the amount of soil Pb, and the concentration of soil Pb increased with an increase in the degree of urbanization and industrialization. Absorbable Pb had the highest value in the northeastern part of the region, and its average in these lands was 0.06 mg/kg. Moreover, its lowest and highest values varied between 0 and 0.31 mg/kg. The lowest and highest amounts of absorbable Pb in these soils were 0 and 2.5 mg/kg.
Acknowledgments
This paper is a result of a MSc. thesis, carried out in the Environmental Health Engineering Research Center of Kerman University of Medical Sciences and was sponsored by the Vice-Chancellor for Research and Technology of Kerman University of Medical Sciences. The authors take this opportunity to express their gratitude for the support and assistance extended by the facilitators during the conduct of the research.
Authors’ Contribution
Conceptualization: Amin Allah Pasgar.
Data curation: Amin Allah Pasgar.
Formal analysis: Amin Allah Pasgar, Mohammad Malakootian.
Funding acquisition: Amin Allah Pasgar.
Investigation: Amin Allah Pasgar.
Methodology: Amin Allah Pasgar, Mohammad Malakootian.
Project administration: Mohammad Malakootian.
Resources: Amin Allah Pasgar.
Software: Amin Allah Pasgar.
Supervision: Mohammad Malakootian.
Validation: Mohammad Malakootian.
Visualization: Amin Allah Pasgar, Mohammad Malakootian.
Writing–original draft: Amin Allah Pasgar.
Writing–review & editing: Amin Allah Pasgar, Mohammad Malakootian
Competing Interests
None.
References
- Khan S, Cao Q, Zheng YM, Huang YZ, Zhu YG. Health risks of heavy metals in contaminated soils and food crops irrigated with wastewater in Beijing, China. Environ Pollut 2008; 152(3):686-92. doi: 10.1016/j.envpol.2007.06.056 [Crossref] [ Google Scholar]
- Sharma RK, Agrawal M, Marshall F. Heavy metal contamination in vegetables grown in wastewater irrigated areas of Varanasi, India. Bull Environ Contam Toxicol 2006; 77(2):312-8. doi: 10.1007/s00128-006-1065-0 [Crossref] [ Google Scholar]
- Duffus JH. “Heavy metals” a meaningless term? (IUPAC Technical Report). Pure Appl Chem 2002; 74(5):793-807. doi: 10.1351/pac200274050793 [Crossref] [ Google Scholar]
- Hooda PS. Trace Elements in Soils. Chichester: John Wiley & Sons; 2010. 10.1002/9781444319477.
- Säumel I, Kotsyuk I, Hölscher M, Lenkereit C, Weber F, Kowarik I. How healthy is urban horticulture in high traffic areas? Trace metal concentrations in vegetable crops from plantings within inner city neighbourhoods in Berlin, Germany. Environ Pollut 2012; 165:124-32. doi: 10.1016/j.envpol.2012.02.019 [Crossref] [ Google Scholar]
- Madrid F, Romero AS, Madrid L, Maqueda C. Reduction of availability of trace metals in urban soils using inorganic amendments. Environ Geochem Health 2006; 28(4):365-73. doi: 10.1007/s10653-005-9034-9 [Crossref] [ Google Scholar]
- Johnson CC, Demetriades A, Locutura J, Ottesen RT. Mapping the Chemical Environment of Urban Areas. John Wiley & Sons; 2011.
- Candelone JP, Hong S, Pellone C, Boutron CF. Post‐Industrial Revolution changes in large‐scale atmospheric pollution of the northern hemisphere by heavy metals as documented in central Greenland snow and ice. J Geophys Res Atmos 1995; 100(D8):16605-16. doi: 10.1029/95jd00989 [Crossref] [ Google Scholar]
- Darling CT, Thomas VG. The distribution of outdoor shooting ranges in Ontario and the potential for lead pollution of soil and water. Sci Total Environ 2003; 313(1-3):235-43. doi: 10.1016/s0048-9697(03)00328-0 [Crossref] [ Google Scholar]
- Robinson BH, Bischofberger S, Stoll A, Schroer D, Furrer G, Roulier S. Plant uptake of trace elements on a Swiss military shooting range: uptake pathways and land management implications. Environ Pollut 2008; 153(3):668-76. doi: 10.1016/j.envpol.2007.08.034 [Crossref] [ Google Scholar]
- Franklin RE, Duis L, Brown R, Kemp T. Trace element content of selected fertilizers and micronutrient source materials. Commun Soil Sci Plant Anal 2005; 36(11-12):1591-609. doi: 10.1081/css-200059091 [Crossref] [ Google Scholar]
- Loganathan P, Mackay A, Lee J, Hedley M. Cadmium distribution in hill pastures as influenced by 20 years of phosphate fertilizer application and sheep grazing. Soil Res 1995; 33(5):859-71. doi: 10.1071/sr9950859 [Crossref] [ Google Scholar]
- Mortvedt JJ. Heavy Metals in Fertilisers: Their Effect on Soil and Plant Health. Paper Presented to: The International Fertiliser Society; December 16, 2005; Cambridge.
- Blume HP, Eger H, Fleischhauer E, Hebel A, Reij C, Steiner KG. Towards Sustainable Land Use. Catena Verlag; 1998.
- Amouei AI, Yousefi Z, Mahvi AH, Naddafi K, Tahmasbizadeh M. Heavy metal concentrations in industrial, agricultural, and highway soils in northern Iran. Environ Justice 2012; 5(3):153-7. doi: 10.1089/env.2011.0038 [Crossref] [ Google Scholar]
- Kim ND, Fergusson JE. The concentrations, distribution and sources of cadmium, copper, lead and zinc in the atmosphere of an urban environment. Sci Total Environ 1994; 144(1-3):179-89. doi: 10.1016/0048-9697(94)90437-5 [Crossref] [ Google Scholar]
- Das P, Samantaray S, Rout GR. Studies on cadmium toxicity in plants: a review. Environ Pollut 1997; 98(1):29-36. doi: 10.1016/s0269-7491(97)00110-3 [Crossref] [ Google Scholar]
- Hou EQ, Xiang HM, Li JL, Li J, Wen DZ. Soil acidification and heavy metals in urban parks as affected by reconstruction intensity in a humid subtropical environment. Pedosphere 2015; 25(1):82-92. doi: 10.1016/s1002-0160(14)60078-3 [Crossref] [ Google Scholar]
- McGrath D, Zhang C, Carton OT. Geostatistical analyses and hazard assessment on soil lead in Silvermines area, Ireland. Environ Pollut 2004; 127(2):239-48. doi: 10.1016/j.envpol.2003.07.002 [Crossref] [ Google Scholar]
- Goovaerts P. Geostatistical tools for characterizing the spatial variability of microbiological and physico-chemical soil properties. Biol Fertil Soils 1998; 27(4):315-34. doi: 10.1007/s003740050439 [Crossref] [ Google Scholar]
- Hani A, Sinaei N, Gholami A. Spatial variability of heavy metals in the soils of Ahwaz using geostatistical methods. Int J Environ Sci Dev 2014; 5(3):294-8. doi: 10.7763/ijesd.2014.v5.495 [Crossref] [ Google Scholar]
- Malakootian M, Khashi Z. Heavy metals contamination of drinking water supplies in southeastern villages of Rafsanjan plain: survey of arsenic, cadmium, lead and copper. J Health Field 2014;2(1):1-9. [Persian].
- Salimi M, Bahmanyar MA, Ghajar Sepanlo M, Mohammadi A. Lead and cadmium changes in soil and canola at Saveh-Hamedan roadside. Water Soil Sci 2015;25(2):193-205. [Persian].
- Mirzaei Aminiyan MM, Mirzaei Aminiyan F, Mousavi R, Heydariyan A. Heavy metal pollution affected by human activities and different land-use in urban topsoil: a case study in Rafsanjan city, Kerman province, Iran. Eurasian J Soil Sci 2016; 5(2):97-104. doi: 10.18393/ejss.2016.2.097-104 [Crossref] [ Google Scholar]
- Davis HT, Aelion CM, McDermott S, Lawson AB. Identifying natural and anthropogenic sources of metals in urban and rural soils using GIS-based data, PCA, and spatial interpolation. Environ Pollut 2009; 157(8-9):2378-85. doi: 10.1016/j.envpol.2009.03.021 [Crossref] [ Google Scholar]
- Lee CS, Li X, Shi W, Cheung SC, Thornton I. Metal contamination in urban, suburban, and country park soils of Hong Kong: a study based on GIS and multivariate statistics. Sci Total Environ 2006; 356(1-3):45-61. doi: 10.1016/j.scitotenv.2005.03.024 [Crossref] [ Google Scholar]
- Zhang C. Using multivariate analyses and GIS to identify pollutants and their spatial patterns in urban soils in Galway, Ireland. Environ Pollut 2006; 142(3):501-11. doi: 10.1016/j.envpol.2005.10.028 [Crossref] [ Google Scholar]
- Duong TT, Lee BK. Determining contamination level of heavy metals in road dust from busy traffic areas with different characteristics. J Environ Manage 2011; 92(3):554-62. doi: 10.1016/j.jenvman.2010.09.010 [Crossref] [ Google Scholar]
- Chen CW, Kao CM, Chen CF, Dong CD. Distribution and accumulation of heavy metals in the sediments of Kaohsiung Harbor, Taiwan. Chemosphere 2007; 66(8):1431-40. doi: 10.1016/j.chemosphere.2006.09.030 [Crossref] [ Google Scholar]
- Thuy HT, Tobschall HJ, An PV. Distribution of heavy metals in urban soils–a case study of Danang-Hoian Area (Vietnam). Environm Geol 2000; 39(6):603-10. [ Google Scholar]
- Navas A, Machı́n J. Spatial distribution of heavy metals and arsenic in soils of Aragón (northeast Spain): controlling factors and environmental implications. Appl Geochem 2002; 17(8):961-73. doi: 10.1016/s0883-2927(02)00006-9 [Crossref] [ Google Scholar]
- Jalali M, Khanlari ZV. Environmental contamination of Zn, Cd, Ni, Cu, and Pb from industrial areas in Hamadan province, western Iran. Environ Geol 2008; 55(7):1537-43. doi: 10.1007/s00254-007-1103-1 [Crossref] [ Google Scholar]
- Parsons PJ, Slavin W. A rapid Zeeman graphite furnace atomic absorption spectrometric method for the determination of lead in blood. Spectrochim Acta Part B At Spectrosc 1993; 48(6-7):925-39. doi: 10.1016/0584-8547(93)80094-b [Crossref] [ Google Scholar]
- Lindsay WL, Norvell WA. Development of a DTPA soil test for zinc, iron, manganese, and copper. Soil Sci Soc Am J 1978; 42(3):421-8. doi: 10.2136/sssaj1978.03615995004200030009x [Crossref] [ Google Scholar]
- Isaaks E, Srivastava RM. Applied Geostatistics. Oxford: Oxford University Press; 1989.
- Shi J, Wang H, Xu J, Wu J, Liu X, Zhu H. Spatial distribution of heavy metals in soils: a case study of Changxing, China. Environ Geol 2007; 52(1):1-10. doi: 10.1007/s00254-006-0443-6 [Crossref] [ Google Scholar]
- Zhang Y, Dong C, Liu J, Xu S, Ai T, Kang F. Gridded population distribution map for the Hebei province of China. Environ Eng Manag J 2015; 14(3):673-80. [ Google Scholar]
- Ji B, Plishka MJ, Wu D, Badowski PR, Karwacki EJ Jr. Removal of Transition Metal Ternary and/or Quaternary Barrier Materials from a Substrate. United States: Google Patents; 2008.
- Wilding L. Spatial variability: its documentation, accommodation and implication to soil surveys. In: Soil Spatial Variability. Wageningen, The Netherlands: PUDOC; 1985.
- Dayani M, Mohammadi J, Naderi Khorasgani M. Geostatistical assessment of Pb and the related soil physical and chemical properties in near-surface soil around Sepahanshahr, Isfahan. Desert 2010; 15(2):139-49. [ Google Scholar]
- Wu C, Wu J, Luo Y, Zhang H, Teng Y. Statistical and geoestatistical characterization of heavy metal concentrations in a contaminated area taking into account soil map units. Geoderma 2008; 144(1-2):171-9. doi: 10.1016/j.geoderma.2007.11.001 [Crossref] [ Google Scholar]
- Glennon MM, Harris P, Ottesen RT, Scanlon RP, O’Connor PJ. The Dublin SURGE Project: geochemical baseline for heavy metals in topsoils and spatial correlation with historical industry in Dublin, Ireland. Environ Geochem Health 2014; 36(2):235-54. doi: 10.1007/s10653-013-9561-8 [Crossref] [ Google Scholar]
- Birke M, Rauch U, Stummeyer J. Urban geochemistry of Berlin, Germany. In: Johnson CC, Demetriades A, Locutura J, Ottesen RT, eds. Mapping the Chemical Environment of Urban Areas. Wiley-Blackwell; 2011.
- Sörme L, Bergbäck B, Lohm U. Century perspective of heavy metal use in urban areas A case study in Stockholm. Water Air Soil Pollut 2001; 1(3):197-211. doi: 10.1023/a:1017564407076 [Crossref] [ Google Scholar]
- McGrath S, Loveland P. The Soil Geochemical Atlas of England and Wales. Blackie Academic & Professional; 1992.
- Shi G, Chen Z, Xu S, Zhang J, Wang L, Bi C. Potentially toxic metal contamination of urban soils and roadside dust in Shanghai, China. Environ Pollut 2008; 156(2):251-60. doi: 10.1016/j.envpol.2008.02.027 [Crossref] [ Google Scholar]
- Rawlins BG, Lark RM, O’Donnell KE, Tye AM, Lister TR. The assessment of point and diffuse metal pollution of soils from an urban geochemical survey of Sheffield, England. Soil Use Manag 2005; 21(4):353-62. doi: 10.1079/sum2005335 [Crossref] [ Google Scholar]
- Micó C, Recatalá L, Peris M, Sánchez J. Assessing heavy metal sources in agricultural soils of an European Mediterranean area by multivariate analysis. Chemosphere 2006; 65(5):863-72. doi: 10.1016/j.chemosphere.2006.03.016 [Crossref] [ Google Scholar]
- Li Q, Wu Z, Chu B, Zhang N, Cai S, Fang J. Heavy metals in coastal wetland sediments of the Pearl River Estuary, China. Environ Pollut 2007; 149(2):158-64. doi: 10.1016/j.envpol.2007.01.006 [Crossref] [ Google Scholar]
- Liao J, Wen Z, Ru X, Chen J, Wu H, Wei C. Distribution and migration of heavy metals in soil and crops affected by acid mine drainage: public health implications in Guangdong province, China. Ecotoxicol Environ Saf 2016; 124:460-9. doi: 10.1016/j.ecoenv.2015.11.023 [Crossref] [ Google Scholar]
- Kabata‐Pendias A, Sadurski W. Trace elements and compounds in soil. In: Elements and Their Compounds in the Environment: Occurrence, Analysis and Biological Relevance. John Wiley & Sons; 2004. p. 79-99. 10.1002/9783527619634.ch5.
- Karami LK, Amiri F, Sefiyanian A, Shariff AR, Tabatabaie T, Pradhan B. Spatial patterns of heavy metals in soil under different geological structures and land uses for assessing metal enrichments. Environ Monit Assess 2013; 185(12):9871-88. doi: 10.1007/s10661-013-3298-9 [Crossref] [ Google Scholar]