Avicenna J Environ Health Eng. 9(1):62-68.
doi: 10.34172/ajehe.2022.08
Original Article
Polycyclic Aromatic Hydrocarbons from Bottled Water: A New Automated Solid Phase Extraction Method and Simulation of Cancer Risk
Fatemeh Mahdavi Doost 1  , Mohammad Mehdi Emamjome 1 , Hamze Ali Jamali 1 , Hamid Karyab 1, 2, *
Author information:
1Department of Environmental Health Engineering, Health Faculty, Qazvin University of Medical Sciences, Qazvin, Iran
2Research Center for Social Determinants of Health, Qazvin University of Medical Sciences, Qazvin, Iran
Abstract
Considering the adverse effects of polycyclic aromatic hydrocarbons (PAHs) on human health and the complexity of their detection in water resources, this study was developed to assess the performance of a new automated device for the identification of PAHs in water based on the solid-phase extraction and to simulate the cancer risk of 16 priority PAHs by Monte Carlo technique. All operational modes of extraction were automatically performed using the proprietary software program. Three spiked aliquots of PAHs including 100, 500, and 1000 ng/L were used to evaluate the performance of the automated-solid phase extraction (SPE) apparatus. The time of extraction in the automatic-SPE apparatus was 50±4 minutes for simultaneous extraction of 4 water samples, which was four times faster than that of manual-SPE apparatus. The mean recoveries of PAHs were 89.22±4.94, 91.70±4.45, and 94.61±6.28% in spiked samples, with a mean of 91.84±5.22%. Except for naphthalene, all obtained recoveries were in an acceptable range (85-115%). The results of Monte Carlo simulation showed that the cancer risk attributable to eight detected PAHs including naphthalene, fluorene, phenanthrene (Phe), benzoanthracene, chrysene, benzo(k) fluoranthene, indeno(cd)pyrene, and dibenzo(a,h)anthracene ranged from 0.05E-6 to 0.11E-6, with the cancer risk of 0.012E-6 having the highest probability (P=0.82). Additionally, this simulation showed that 99% of the probability density of cancer risk was located within the range lower than 0.05E-6. Our results showed that the novel automated-SPE apparatus could be utilized for the extraction of PAHs from water resources with a good recovery (85%-115%), high operational speed, and potential for separation of solvents from the air in the drying step. Therefore, this device can be used for the extraction of trace PAHs and similar organic compounds from water resources.
Keywords: Drinking water, Polycyclic aromatic hydrocarbons, Automated solid-phase extraction, Risk, Monte Carlo method
Copyright and License Information
© 2022 The Author(s); Published by Hamadan University of Medical Sciences.
This is an open-access article distributed under the terms of the Creative Commons Attribution License (
http://creativecommons.org/licenses/by/4.0), which permits unrestricted use, distribution, and reproduction in any medium provided the original work is properly cited.
Please cite this article as follows: Mahdavi Doost F, Emamjome MM, Jamali HA, Karyab H. Polycyclic aromatic hydrocarbons from bottled water: a new automated solid phase extraction method and simulation of cancer risk. Avicenna J Environ Health Eng. 2022; 9(1):62-68. doi:10.34172/ajehe.2022.08
1. Introduction
Bottled water is a source of potable water whose consumption is increasing in recent decades, especially with climate change and increasing ambient air temperature. It is demonstrated that an increase in the mean temperature is correlated with an increase in bottled water consumption (1). Iranian people consume 15-20 L of bottled water annually. This value is 130, 170, and 244 L in Turkey, the United States, and Mexico, respectively, suggesting that bottled water consumption is considerably low compared with the other countries (2).
On the other hand, the detection of organic pollutants in bottled water is increasing. In a previous study, the occurrence of contaminants of emerging concern in bottled water is reported (3). In addition, pollution of bottled water with polycyclic aromatic hydrocarbons (PAHs) has been reported in various studies (4-6). They are a group of chemicals with high melting points, high boiling points, low vapor pressure, very low water solubility, and priority pollutants that can cause environmental (7) and human health concerns (8). The presence of the PAHs in different water bodies including sediments (9), rivers (10), sea (11), and drinking water (12) has been widely investigated. They can pollute water resources mainly through dry and wet deposition (13), vehicle traffic (14), discharge of untreated industrial wastewater (15), leaching from creosote-impregnated wood (16), crude petroleum spills (17), and fuel combustion (18). The permissible limit is not established for PAHs in bottled water. However, the maximum allowed limit for benzo[a]pyrene (BaP), a carcinogen PAHs, is determined to be 0.0007 mg/L (19).
There are many analytical methods for extraction of PAHs from water resources including dispersive liquid-liquid microextraction (20), pressurized liquid extraction (21), solid-phase extraction (22), solid-phase microextraction (23), simultaneous distillation extraction (24), headspace solid-phase microextraction (25), stir bar sorptive extraction (26), and so on, which are often used manually. Solid phase extraction (SPE) is one of the most common forms of sample preparation used for the extraction, changing of solvents, clean-up, concentration, and matrix simplification of PAHs. In addition, due to its simplicity and economy in terms of time and solvent, the SPE method has been largely replaced with the liquid-liquid extraction method (22,27).
However, SPE has unfavorable properties for direct analysis of a number of samples. In addition, various studies have reported the limitations and challenges in applying manual methods for solid-phase extraction including the probability of migration, medium and inadequate recovery for some analytes, exposure to hazardous organic compounds as solvents, contamination of the laboratory environment with organic solvents and causing air pollution, operational problems such as the limited capacity of manifold tank, the lack of automatic control over chamber pressure, and the probability of overflow of sample from the adsorbent cartridge (28). Considering the intrinsic properties of PAHs and the necessity to identify them in water sources, the objective of this study was to develop an innovative automated SPE apparatus for extraction of semi and non-volatile PAHs from water resources, which was able to extract 4 water samples simultaneously. In addition, the modified device was also equipped with a gas control system. For this purpose, two methods based on the use of an automated-SPE device and manual solid-phase extraction method have been developed for the extraction of 16 priority PAHs. Additionally, this study aimed to simulate cancer risk from PAHs in bottled water using the Monte Carlo technique.
2. Materials and Methods
2.1. Materials
Standard solutions of 16 PAHs including naphthalene (Nap), acenaphthylene (Acy), acenaphthene (Ace), fluorine (Fl), phenanthrene (Phe), anthracene (Ant), fluoranthene (Flu), pyrene (Pyr), benzo[a]anthracene (BaA), chrysene (Chy), benzo[a]pyrene (BaP), benzo[b]fluoranthene (BbF), benzo[k]fluoranthene (BkF), dibenzo[a.h]anthracene (DahA), indeno[1,2,3-cd]pyrene (IcdP), and benzo[g, h, i]perylene (BghiP) were obtained from Supelco Company, USA. C18 extraction cartridges were purchased from Chromaband, Germany. Moreover, all solvents including cyclohexane, acetone, and methanol were of analytical-reagent grade and they were obtained from Merck, Germany.
2.2. PAHs Extraction by Automated Device
To decrease the problems and challenges of using manual-SPE procedure for the extraction of organic pollutants from water resources, an automated-SPE device was developed. The main characteristics of this device are presented in Table 1.
Table 1.
Specifications of Automated-PSE Device for the Extraction of PAHs From Water
|
Condition
|
Characterization
|
| Injector technique |
Vacuum manifold with 4 channels |
| Manifold capacity |
7.5 L |
| Manifold dimensions |
0.20Í0.15Í0.3 mm |
| Distribution system |
Stainless steel tubes |
| Sample injection capacity |
1000-4000 mL of water |
| Water flow rate |
20-50 mL/min |
| Temperature during the solvent drying step |
40 ± 0.2°C |
| Rate of N2 injection into manifold |
3000 ft/min |
| Solvent drying rate |
1 ± 0.2 mL/min |
| Air purification system |
Granular activated carbon unit |
| Total extraction time |
50 ± 4 min |
The device was designed for the extraction of 4 water samples simultaneously. It enables the extraction of PAHs in four stages including conditioning of cartridges, sample injection to four cartridges, washing for the removal of impurities from the cartridge, and elution. The conditioning of cartridges was achieved by appropriate solvents including methanol and ultra-pure water. Injection of water sample was based on vacuum condition in the manifold compartment. Automatic injection of pure nitrogen was used to dry the elution solvents at 40°C. To prevent air pollution, all evaporated solvents were transferred into a chamber and the adsorption process using granular activated carbon (GAC) was used to eliminate organic solvents from the effluent. All operations related to injection, conditioning, washing, elution, liquid discharge from the vacuum chamber, as well as the injection and discharge of air into the GAC are performed automatically using the proprietary software program. This software system enables the user to perform extraction operations in both manual and automatic modes. The extraction procedures applied in this automated-SPE device were consistent with previous studies (29,30). To evaluate the performance and quality control of the automated-SPE device, three spiked levels of PAHs including 100, 500, and 1000 ng/L were used with three replicates. All analyses of PAHs concentration were carried out with the duplicate samples. To obtain the calibration curves, samples were analyzed at seven levels ranging from 2 to 2000 ng/L with three replicates resulting in correlation coefficients ranging from 0.96 to 0.99. Additionally, standard solutions contained all studied PAHs. The detection limit (DL) for PAHs, with a signal-to-noise ratio of 3, ranged from 0.5 to 3 ng/L. The sequence of implementation steps in the automated-SPE device is presented in Fig. 1.
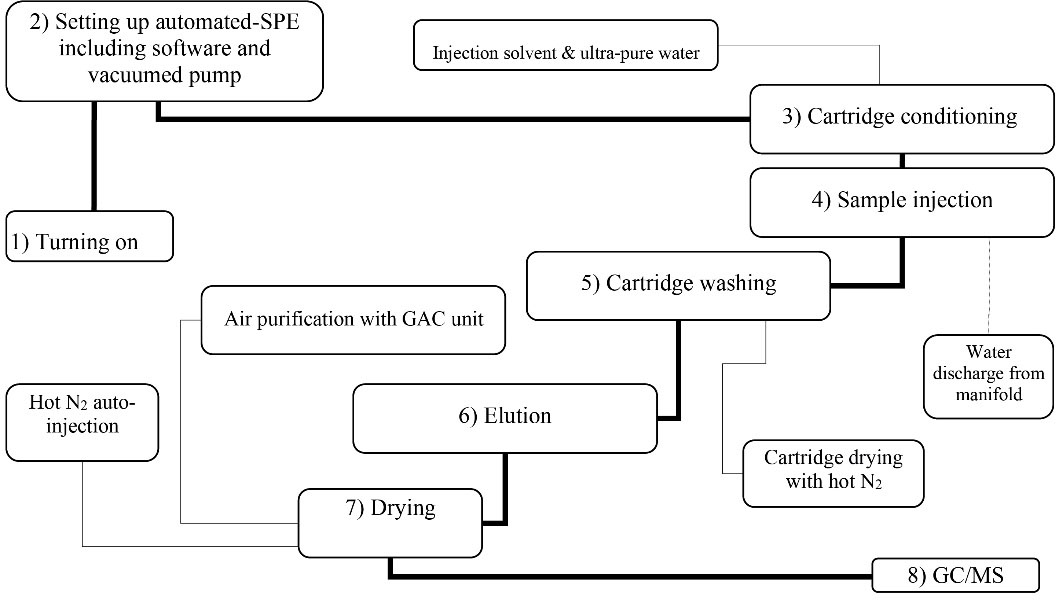
Figure 1.
The Sequence of Implementation Steps in the Automated-SPE Device.
.
The Sequence of Implementation Steps in the Automated-SPE Device.
2.3. Water Sampling
A total of 39 bottled water samples were selected to determine the concentration of PAHs. Bottled water was purchased from local retail stores in Iran. They were selected from famous brands of bottled water which were kept away from sunlight at ambient temperature. The bottles were made of polyethylene terephthalate (PET), a crystalline polymer that is widely used for packaging foods and beverages. After sampling, water samples were poured into 1 L amber glass bottles with Teflon lined tops to prevent reaction. Each sample was stored in a cooler at 4°C for transportation to the laboratory.
2.4. Sample Analysis
Extraction of PAHs was performed using C18 cartridges in three interconnected phases. First, the SPE cartridges were conditioned with 5 mL of methanol under vacuum conditions. Then, cartridges were washed with 5 mL of ultra-pure water. In the second step, 1 L of the water sample was passed through the cartridge at a flow rate of 20 mL/min. Afterwards, pure nitrogen was used to dry the wall of the separating funnel and the cartridge. The centrifugation process is critical for the removal of the residential water from cartridges in the manual-SPE procedure (12). However, in the automated-SPE device, centrifugation was removed from the drying process. The third step was elution, which was performed with the injection of 5 mL of cyclohexane into the cartridges. Finally, the extract was dried using N2 at 40°C for 5 minutes. The extract was poured into the micro vial and stored in the refrigerator until analysis.
The PAHs in the extracts were measured using a 3800 Varian GC coupled to a Varian Saturn 2200 MS, equipped with a 30 m × 0.25 mm i.d. WCOT CP-Sil 8 CB column. The initial column temperature was adjusted to 70°C. After an initial holding time of 1 minute, the temperature was programmed to rise to 300°C at a rate of 10°C/min for 30 minutes. The injector and detector temperatures were 250°C and 300°C, respectively. Helium was used as the carrier gas at a flow rate of 2 mL/min. All procedures were performed according to EPA Method 8270D (31). Method parameters for the analysis of PAHs are presented in Table 2.
Table 2.
Method Parameters and Analytical Results for PAH Components
|
Compounds PAHs
|
t
R
(min)
|
Selected Ions for Mass Spectrometry Quantification
|
R
2
in Calibration
|
|
Range
|
Target
|
| Nap |
7.99 |
127-129 |
128 |
0.99 |
| Acy |
11.66 |
151-153 |
152 |
0.99 |
| Ace |
12.08 |
152-154 |
153 |
0.99 |
| Fl |
13.30 |
165-167 |
166 |
0.99 |
| Phe |
15.60 |
177-179 |
178 |
0.98 |
| Ant |
17.76 |
177-179 |
178 |
0.98 |
| Flu |
18.60 |
201-203 |
202 |
0.99 |
| Pyr |
19.06 |
201-203 |
202 |
0.99 |
| BaA |
21.94 |
227-229 |
228 |
0.97 |
| Chy |
22.03 |
227-229 |
228 |
0.96 |
| BbF |
24.63 |
251-253 |
252 |
0.96 |
| BkF |
24.50 |
251-253 |
252 |
0.98 |
| BaP |
24.80 |
251-253 |
252 |
0.98 |
| IcdP |
28.70 |
275-277 |
276 |
0.98 |
| DahA |
28.80 |
275-277 |
276 |
0.98 |
| BghiP |
29.76 |
277-279 |
278 |
0.98 |
2.5. Health Risk Simulation
The simulation of cancer risk attributable to PAHs in bottled water was accomplished using SPSS version 26.0 (Chicago, IL, USA). The Monte Carlo method was used for the simulation, which is a mathematical technique to estimate the possible outcomes of an uncertain event. Before the simulation, toxic equivalency factors (TEFs) were applied to convert the concentrations of multi-component PAHs into BaP equivalent concentrations. TEF is an estimate of the relative toxicity of a PAH compound compared to BaP, which can be detected in the bottled water (32). The input variables were bottled water ingestion rate by adults, exposure duration for adults, adsorption rate of BaP in the intestinal tract, exposure frequency for adults, body weight of adults, cancer slope factor of BaP, and average time of exposure to BaP. The values for the above-mentioned parameters were 0.3 L/day (33), 54 years (34), 100% (34), 350 days/year (33), 70 kg (35), 1 mg/kg/day (36) and 25550 days (35). In addition, BaP equivalent concentration was used as the determined concentration of 16 PAHs in the water samples.
3. Results and Discussion
3.1. Extraction of PAHs from Water Samples
The maximum time of extraction in the automatic-SPE device was 50 ± 4 minutes for the extraction of 4 samples. As presented in Table 3, the recovery percentages of PAHs were 60.20-123.40%, 63.85-120.40%, and 61.30-112.50% at spiked concentrations of 100, 500, and 1000 ng/L, respectively. These values are comparable with extracted PAHs using automated-SPE method from seawater (88-104%) and rainwater (91-113%) (37). The mean recoveries for analyzed 16 PAHs were 89.22 ± 4.94, 91.70 ± 4.45, and 94.61 ± 6.28% at concentrations of 100, 500, and 1000 ng/L, respectively. In addition, the mean recovery was found to be 91.84 ± 5.22%. In non-automated-SPE procedure, different results have been reported according to the extraction methods. For example, the recovery of PAH compounds from bottled water was reported to range from 92.5 to 103.4% using magnetic solid-phase extraction by Sharifiarab et al (38) and it ranged from 85 to 121% by ultrasonic extraction method in a study by Ngubo et al (39).
Table 3.
Recoveries of PAHs Components Using Different Manual and Automated-SPE Procedures
|
Compounds
|
Recovery in manual-SPE (12)
|
Recovery in automated-SPE (%) (100 ng/L)
|
Recovery in automated-SPE (%) (500 ng/L)
|
Recovery in automated-SPE (%) (1000 ng/L)
|
Detected 16 PAHs in water (ng/L)
|
| Nap |
36.28 |
60.20 ± 3.14 |
63.85 ± 2.14 |
61.30 ± 3.21 |
ND-2.10 |
| Acy |
68.14 |
77.14 ± 4.11 |
88.14 ± 2.90 |
86.10 ± 3.90 |
ND* |
| Ace |
82.94 |
89.30 ± 2.10 |
88.30 ± 3.21 |
86.70 ± 3.90 |
ND |
| Fl |
59.10 |
69.45 ± 3.90 |
81.11 ± 2.50 |
81.90 ± 6.12 |
ND-2.10 |
| Phe |
112.24 |
98.58 ± 6.90 |
112.3 ± 4.15 |
112.20 ± 9.11 |
ND-2.90 |
| Ant |
97.03 |
112.10 ± 5.35 |
115.50 ± 8.45 |
112.50 ± 7.02 |
ND |
| Flu |
74.50 |
123.40 ± 11.50 |
120.40 ± 9.75 |
110.40 ± 6.50 |
ND |
| Pyr |
82.00 |
120.80 ± 5.20 |
110.15 ± 4.65 |
112.40 ± 6.50 |
ND |
| BaA |
79.74 |
90.70 ± 3.85 |
90.40 ± 9.45 |
98.75 ± 11.00 |
ND-6.35 |
| Chy |
64.54 |
75.50 ± 2.10 |
85.30 ± 4.26 |
85.10 ± 6.98 |
ND-97.93 |
| BbF |
108.14 |
80.10 ± 4.40 |
78.69 ± 2.32 |
89.15 ± 5.02 |
ND |
| BkF |
117.82 |
80.30 ± 4.10 |
85.30 ± 3.25 |
86.35 ± 5.50 |
ND-10.76 |
| BaP |
69.70 |
80.35 ± 4.50 |
95.23 ± 2.85 |
91.35 ± 7.00 |
ND |
| IcdP |
80.23 |
112.80 ± 9.80 |
98.60 ± 7.20 |
100.72 ± 7.55 |
ND-47.18 |
| DahA |
132.57 |
78.32 ± 6.00 |
78.50 ± 2.11 |
99.65 ± 7.55 |
ND-16.07 |
| BghiP |
47.83 |
78.50 ± 2.14 |
75.50 ± 2.00 |
99.50 ± 3.60 |
ND |
| Total PAHs (ng/L) |
- |
- |
- |
- |
16.00-117.59 |
| Average recovery (%) |
82.05 |
89.22 ± 4.94 |
91.70 ± 4.45 |
94.61 ± 6.28 |
- |
The regression analysis revealed that there was not any significant difference between recovery percentages at three spiked concentrations of PAHs including 100, 500, and 1000 ng/L (P > 0.05). The lowest recovery belonged to Nap (60.20%) at the spiked concentration of 100 ng/L; this can be attributed to the drying of elution solvent at high temperatures. It is proved that Nap is more sensitive to high temperatures than other PAHs (40). In addition, the obtained results revealed that the mean recovery for Nap using automated-SPE method was higher than that obtained by manual-SPE method, which was reported to be 36.28% (12).
In manual-SPE procedure, the recoveries of 12 PAHs including Nap, Ace, Acy, Fl, Flu, Pyr, BaA, Chy, BaP, IcdP, DahA, and BghiP were not in the acceptable range (85-115%) (12). However, in automated-SPE procedure, except for Nap, all obtained recoveries were in an acceptable range (85-115%).
3.2. PAHs Levels in Water Samples
As presented in Table 3, eight individual PAHs including Nap, Fl, Phe, BaA, Chy, BkF, IcdP, and DahA were identified in the bottled water. The detected concentration of PAHs ranged from 2.10 to 97.93 ng/L. The mean detected concentration of PAHs in the bottled water was 5.86 ng/L (33). In addition, total concentrations of PAHs ranged from 16.00 to 117.59 ng/L, indicating that some samples had concentrations higher than the maximum permissible level recommended by European Commission (100 ng/L) (41).
The presence of PAHs may be the result of a high concentration of PAHs in water resources (12), especially in groundwater which was the main resource for the production of bottled water in this study. Moreover, it can be attributed to secondary pollution such as air particulate during wet deposition (4,38). Results were comparable to those reported by Vega et al. They studied 16 PAHs in bottled water in Mexico City and found that total concentrations of PAHs ranged from 12.78 to 20.15 ng/L. They found that Phe, Ant, Flu, Pyr, and BaA were the dominant PAHs. Additionally, BbF and BkF were detected at high concentrations (4). In addition, our results were not comparable with the findings of a study by Güler. It was reported that the mean concentration of PAHs in Turkish mineral bottled water was 3000 ng/L (6).
3.3. Simulation of Cancer Risk
Obtained results indicated that the presence of PAHs in bottled water can threaten the health of consumers. The point estimation of cancer risk showed that excess lifetime cancer risk ranged from 0.08E-8 to 9.78E-08, with an average of 1.53E-08, which was lower than the acceptable health risk proposed by the World Health Organization (WHO) (42). The acceptable health risk defined by the WHO is 1.0E-05, meaning that 1 in 100 000 increased risk is considered acceptable (43,44). As presented in Fig. 2, the Monte Carlo simulation revealed that the cancer risk from PAHs in bottled water ranged from 0.05E-6 to 0.11E-6, with the cancer risk of 0.012E-6 having the highest probability. This simulation showed that 99% of the probability density of cancer risk was located within the range lower than 0.05E-6. In addition, as presented in Fig. 3, the cumulative distribution of expected cancer risk showed that the maximum risk of PAHs cannot exceed 0.1E-6. In addition, the mean ELCR was estimated to be 0.016 ± 0.009 (95% CI = 0.015-0.016).
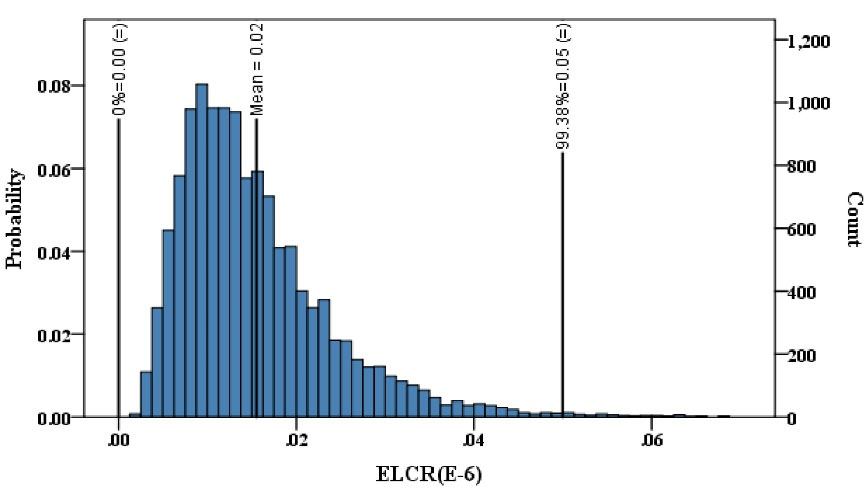
Figure 2.
Distribution of Cancer Risk Attributable to Ingestion Exposure to PAHs in Bottled Water in Adults.
.
Distribution of Cancer Risk Attributable to Ingestion Exposure to PAHs in Bottled Water in Adults.
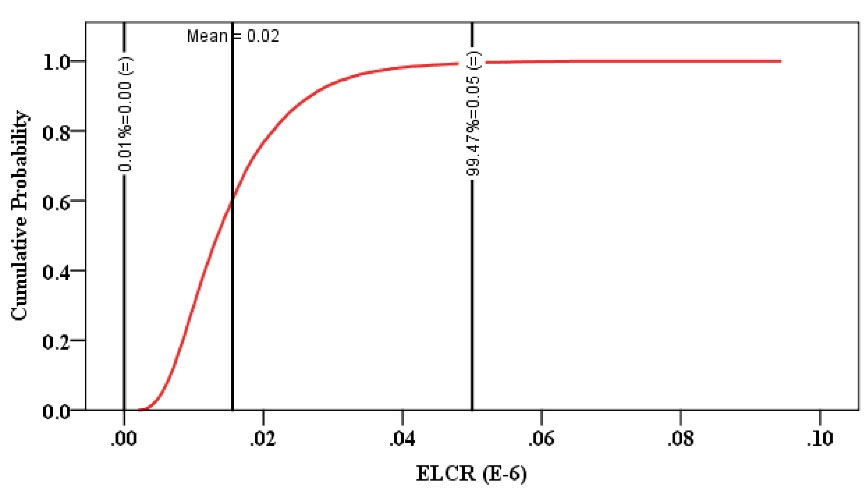
Figure 3.
Cumulative Distribution of Expected Cancer Risk from PAHs in Bottled Water in Adults.
.
Cumulative Distribution of Expected Cancer Risk from PAHs in Bottled Water in Adults.
4. Conclusion
This study was the first attempt to use the Monte Carlo method for the estimation of cancer risk attributable to PAHs in bottled water in Iran. It revealed that the cancer risk from PAHs in bottled water ranged from 0.05E-6 to 0.11E-6, with the cancer risk of 0.012E-6 having the highest probability. In addition, the obtained results showed that the novel automated-SPE device can be used for extraction of PAHs from water resources with a good recovery (85-115%), except for Nap. The main novelties of this device are high extraction speed and separation of organic solvents from the air during the solvent drying step. This device enables the separation and extraction of BaP, as an indicator for the presence ofPAHs, from water resources.
Acknowledgements
This article is a part of a project entitled “Evaluation of Recovery of Polycyclic Aromatic Hydrocarbons from Drinking Water by an Automated-SPE” which was funded by the Deputy of Research and Technology of Qazvin University of Medical Sciences, Qazvin. Iran. The authors would like to thank the staff of the laboratory in the School of Health.
Authors’ Contribution
All authors approved the final version of the manuscript for publication.
Conflict of Interest Disclosures
The authors declare that they have no competing interests.
References
- Zapata O. The relationship between climate conditions and consumption of bottled water: a potential link between climate change and plastic pollution. Ecol Econ 2021; 187:107090. doi: 10.1016/j.ecolecon.2021.107090 [Crossref] [ Google Scholar]
- First Iranian English Economic Daily. Bottled Water Consumption in Iran Meager. Financial Tribune, Economy, Domestic Economy, 2017. Available at: https://financialtribune.com/articles/economy-domestic-economy/65908/bottled-water-consumption-in-iran-meager.
- Akhbarizadeh R, Dobaradaran S, Schmidt TC, Nabipour I, Spitz J. Worldwide bottled water occurrence of emerging contaminants: a review of the recent scientific literature. J Hazard Mater 2020; 392:122271. doi: 10.1016/j.jhazmat.2020.122271 [Crossref] [ Google Scholar]
- Vega S, Gutiérrez R, Ortiz R, Schettino B, de Lourdes Ramírez, Pérez JJ. Hydrocarbons derived from petroleum in bottled drinking water from Mexico City. Bull Environ Contam Toxicol 2011; 86(6):632-6. doi: 10.1007/s00128-011-0268-1 [Crossref] [ Google Scholar]
- Aygun SF, Bagcevan B. Determination of polycyclic aromatic hydrocarbons (PAHs) in drinking water of Samsun and it’s surrounding areas, Turkey. J Environ Health Sci Eng 2019; 17(2):1205-12. doi: 10.1007/s40201-019-00436-0 [Crossref] [ Google Scholar]
- Güler C. Evaluation of maximum contaminant levels in Turkish bottled drinking waters utilizing parameters reported on manufacturer’s labeling and government-issued production licenses. J Food Compost Anal 2007; 20(3-4):262-72. doi: 10.1016/j.jfca.2006.10.005 [Crossref] [ Google Scholar]
- Khaksar F, Nejatkhah Manavi P, Ashja Ardalan A, Abedi E, Saleh A. Concentration of polycyclic aromatic hydrocarbons in zooplanktons of Bushehr coastal waters (north of the Persian Gulf). Mar Pollut Bull 2019; 140:35-9. doi: 10.1016/j.marpolbul.2019.01.029 [Crossref] [ Google Scholar]
- Taiwo AM, Ihedioha EC, Nwosu SC, Oyelakin OA, Efubesi PC, Shitta JS. Levels and health risk assessment of polycyclic aromatic hydrocarbons in protein foods from Lagos and Abeokuta, Southwestern Nigeria. J Food Compost Anal 2019; 79:28-38. doi: 10.1016/j.jfca.2019.03.001 [Crossref] [ Google Scholar]
- Sampei Y, Uraoka S-i, Ono T, Dettman DL. Polycyclic aromatic hydrocarbons (PAHs) in sediment cores from lakes Shinji and Nakaumi, SW Japan: a proxy of recent fire events in the watershed. Estuar Coast Shelf Sci 2019; 226:106269. doi: 10.1016/j.ecss.2019.106269 [Crossref] [ Google Scholar]
- Karyab H, Nasseri S, Ahmadkhaniha R, Rastkari N, Mahvi AH, Nabizadeh R. Determination and source identification of polycyclic aromatics hydrocarbons in Karaj River, Iran. Bull Environ Contam Toxicol 2014; 92(1):50-6. doi: 10.1007/s00128-013-1140-2 [Crossref] [ Google Scholar]
- Nagato EG, Makino F, Nakase H, Yoshida S, Hayakawa K. Improvements in polycyclic aromatic hydrocarbon contamination in the Japan Sea: an interannual survey from 2008 to 2014. Mar Pollut Bull 2019; 138:333-40. doi: 10.1016/j.marpolbul.2018.11.061 [Crossref] [ Google Scholar]
- Karyab H, Yunesian M, Nasseri S, Mahvi AH, Ahmadkhaniha R, Rastkari N. Polycyclic aromatic hydrocarbons in drinking water of Tehran, Iran. J Environ Health Sci Eng 2013; 11(1):25. doi: 10.1186/2052-336x-11-25 [Crossref] [ Google Scholar]
- Cao S, Na G, Li R, Ge L, Gao H, Jin S. Fate and deposition of polycyclic aromatic hydrocarbons in the Bransfield Strait, Antarctica. Mar Pollut Bull 2018; 137:533-41. doi: 10.1016/j.marpolbul.2018.10.045 [Crossref] [ Google Scholar]
- Burant A, Selbig W, Furlong ET, Higgins CP. Trace organic contaminants in urban runoff: associations with urban land-use. Environ Pollut 2018; 242(Pt B):2068-77. doi: 10.1016/j.envpol.2018.06.066 [Crossref] [ Google Scholar]
- Oh JY, Choi SD, Kwon HO, Lee SE. Leaching of polycyclic aromatic hydrocarbons (PAHs) from industrial wastewater sludge by ultrasonic treatment. Ultrason Sonochem 2016; 33:61-6. doi: 10.1016/j.ultsonch.2016.04.027 [Crossref] [ Google Scholar]
- Ikarashi Y, Kaniwa MA, Tsuchiya T. Monitoring of polycyclic aromatic hydrocarbons and water-extractable phenols in creosotes and creosote-treated woods made and procurable in Japan. Chemosphere 2005; 60(9):1279-87. doi: 10.1016/j.chemosphere.2005.01.054 [Crossref] [ Google Scholar]
- Ugochukwu UC, Ochonogor A, Jidere CM, Agu C, Nkoloagu F, Ewoh J. Exposure risks to polycyclic aromatic hydrocarbons by humans and livestock (cattle) due to hydrocarbon spill from petroleum products in Niger-delta wetland. Environ Int 2018; 115:38-47. doi: 10.1016/j.envint.2018.03.010 [Crossref] [ Google Scholar]
- Perera FP. Multiple threats to child health from fossil fuel combustion: impacts of air pollution and climate change. Environ Health Perspect 2017; 125(2):141-8. doi: 10.1289/ehp299 [Crossref] [ Google Scholar]
- Iranian National Standardization Organization. Bottled drinking water-specifications and test methods. 2nd revision. Iranian National Standardization Organization; 2020.
- Mousavi L, Tamiji Z, Khoshayand MR. Applications and opportunities of experimental design for the dispersive liquid-liquid microextraction method-a review. Talanta 2018; 190:335-56. doi: 10.1016/j.talanta.2018.08.002 [Crossref] [ Google Scholar]
- Vazquez-Roig P, Picó Y. Pressurized liquid extraction of organic contaminants in environmental and food samples. TrAC Trends Anal Chem 2015; 71:55-64. doi: 10.1016/j.trac.2015.04.014 [Crossref] [ Google Scholar]
- Andrade-Eiroa A, Canle M, Leroy-Cancellieri V, Cerdà V. Solid-phase extraction of organic compounds: a critical review Part II. TrAC Trends Anal Chem 2016; 80:655-67. doi: 10.1016/j.trac.2015.08.014 [Crossref] [ Google Scholar]
- Souza-Silva ÉA, Jiang R, Rodríguez-Lafuente A, Gionfriddo E, Pawliszyn J. A critical review of the state of the art of solid-phase microextraction of complex matrices I Environmental analysis. TrAC Trends Anal Chem 2015; 71:224-35. doi: 10.1016/j.trac.2015.04.016 [Crossref] [ Google Scholar]
- Guan X, Ge D, Li S, Huang K, Liu J, Li F. Chemical composition and antimicrobial activities of Artemisia argyi Lévl et vant essential oils extracted by simultaneous distillation-extraction, subcritical extraction and hydrodistillation. Molecules 2019; 24(3):483. doi: 10.3390/molecules24030483 [Crossref] [ Google Scholar]
- Fuchsmann P, Tena Stern M, Bischoff P, Badertscher R, Breme K, Walther B. Development and performance evaluation of a novel dynamic headspace vacuum transfer “In Trap” extraction method for volatile compounds and comparison with headspace solid-phase microextraction and headspace in-tube extraction. J Chromatogr A 2019; 1601:60-70. doi: 10.1016/j.chroma.2019.05.016 [Crossref] [ Google Scholar]
- Madej K, Jonda A, Borcuch A, Piekoszewski W, Chmielarz L, Gil B. A novel stir bar sorptive-dispersive microextraction in combination with magnetically modified graphene for isolation of seven pesticides from water samples. Microchem J 2019; 147:962-71. doi: 10.1016/j.microc.2019.04.002 [Crossref] [ Google Scholar]
- Płotka-Wasylka J, Szczepańska N, de la Guardia M, Namieśnik J. Miniaturized solid-phase extraction techniques. TrAC Trends Anal Chem 2015; 73:19-38. doi: 10.1016/j.trac.2015.04.026 [Crossref] [ Google Scholar]
- Andrade-Eiroa A, Canle M, Leroy-Cancellieri V, Cerdà V. Solid-phase extraction of organic compounds: a critical review (Part I). TrAC Trends Anal Chem 2016; 80:641-54. doi: 10.1016/j.trac.2015.08.015 [Crossref] [ Google Scholar]
- Li N, Lee HK. Solid-phase extraction of polycyclic aromatic hydrocarbons in surface water Negative effect of humic acid. J Chromatogr A 2001; 921(2):255-63. doi: 10.1016/s0021-9673(01)00879-2 [Crossref] [ Google Scholar]
- US EPA. Analytical Methods Approved for Drinking Water Compliance Monitoring. 2018. https://www.epa.gov/dwanalyticalmethods.
- Environmental Protection Agency (EPA). Method 8270D: Semivolatile Organic Compounds by Gas Chromatography/Mass Spectrometry (GC-MS). EPA; 2022. Available at: https://19january2017snapshot.epa.gov/sites/production/files/2015-07/documents/epa-8270d.pdf.
- Nisbet IC, LaGoy PK. Toxic equivalency factors (TEFs) for polycyclic aromatic hydrocarbons (PAHs). Regul Toxicol Pharmacol 1992; 16(3):290-300. doi: 10.1016/0273-2300(92)90009-x [Crossref] [ Google Scholar]
- Karyab H, Yunesian M, Nasseri S, Rastkari N, Mahvi A, Nabizadeh R. Carcinogen risk assessment of polycyclic aromatic hydrocarbons in drinking water, using probabilistic approaches. Iran J Public Health 2016; 45(11):1455-64. [ Google Scholar]
- Ambade B, Sethi SS, Kumar A, Sankar TK, Kurwadkar S. Health risk assessment, composition, and distribution of polycyclic aromatic hydrocarbons (PAHs) in drinking water of Southern Jharkhand, East India. Arch Environ Contam Toxicol 2021; 80(1):120-33. doi: 10.1007/s00244-020-00779-y [Crossref] [ Google Scholar]
- Sobhanardakani S. Health risk assessment of inorganic arsenic through groundwater drinking pathway in some agricultural districts of Hamedan, west of Iran. Avicenna J Environ Health Eng 2018; 29;5(2):73-7. [ Google Scholar]
- Integrated Risk Information System (IRIS). Supplemental Information on the IRIS Toxicological Review of Benzo[a]pyrene. IRIS; 2022. Available at: https://cfpub.epa.gov/ncea/iris2/chemicallanding.cfm?substance_nmbr=136.
- Ramirez CE, Wang C, Gardinali PR. Fully automated trace level determination of parent and alkylated PAHs in environmental waters by online SPE-LC-APPI-MS/MS. Anal Bioanal Chem 2014; 406(1):329-44. doi: 10.1007/s00216-013-7436-6 [Crossref] [ Google Scholar]
- Sharifiarab G, Mehraie A, Arabameri M, Shariatifar N, Mortazavian AM, Moazzen M. Evaluation of polycyclic aromatic hydrocarbons (PAHs) in bottled water samples (non-carbonated, mineral, carbonated and carbonated flavored water) in Tehran with MSPE-GC/MS method: a health risk assessment. Appl Biol Chem 2022; 65(1):32. doi: 10.1186/s13765-022-00696-9 [Crossref] [ Google Scholar]
- Ngubo A, Mahlambi PN, Ojwach SO. Occurrence of polycyclic aromatic hydrocarbons in water and sediment samples from KwaZulu-Natal province, South Africa. Water Environ J 2021; 35(1):84-96. doi: 10.1111/wej.12598 [Crossref] [ Google Scholar]
- Shao J, Cheng Y, Yang C, Zeng G, Liu W, Jiao P. Efficient removal of naphthalene-2-ol from aqueous solutions by solvent extraction. J Environ Sci (China) 2016; 47:120-9. doi: 10.1016/j.jes.2016.03.010 [Crossref] [ Google Scholar]
- European Communities, the quality of water intended for human consumption. Official Journal of the European Communities, Council Directive 98/83/EC. 2019. http://data.europa.eu/eli/dir/1998/83/oj.
- World Health Organization (WHO). Guidelines for Drinking-Water Quality: First Addendum to the Fourth Edition. WHO; 2017. https://apps.who.int/iris/handle/10665/254637.
- Egilmez G, Süer GA, Huang J. Stochastic cellular manufacturing system design subject to maximum acceptable risk level. Comput Ind Eng 2012; 63(4):842-54. doi: 10.1016/j.cie.2012.05.006 [Crossref] [ Google Scholar]
- Gohlke JM, Doke D. Fish consumption advisory. In: Encyclopedia of Toxicology. 3rd ed. Oxford: Academic Press; 2014. p. 598-601. 10.1016/b978-0-12-386454-3.00385-7.