Avicenna J Environ Health Eng. 8(2):84-96.
doi: 10.34172/ajehe.2021.11
Original Article
Trace and Macro Element Contaminations in Tissues of Vimba persa and Alosa braschnikowi From the South Caspian Sea and Potential Human Health Risk Assessment
Masoud Sattari 1, 2  , Mehdi Bibak 1, * , Mohammad Forouhar Vajargah 1
Author information:
1Department of Fisheries, Faculty of Natural Resources, University of Guilan, Sowmeh Sara, Iran
2Department of Marine Sciences, Caspian Sea Basin Research Center, University of Guilan, Rasht, Iran
Abstract
Alosa braschnikowi and Vimba persa are commercially important fish species in the southern part of the Caspian Sea. However, little is known about the trace element (TE) concentrations in their muscles. To this end, a total of 82 pieces of V. persa and 74 A. braschnikowi were caught at three different fishing areas (Astara, Anzali, and Kiashahr) around the southwestern shorelines of the Caspian Sea from September 2017 through June 2018. An inductively coupled plasma optical emission spectrometry (ICP-OES) was used to measure the accumulation of 34 traces and macro elements in some tissues of the fish species. Then, comparisons of the element levels in these tissues were made for the three different fishing areas. Overall, in the case of A. braschnikowi, 30, 30, and 28 elements were detected in its skin, gonads, and kidneys, respectively, while in the case of V. persa, 27 and 28 elements were found in its muscle and liver, respectively. The majority of element levels measured in these tissues indicated no significant differences among the sampling areas (P>0.05) except for such elements as copper, lanthanum, and tungsten in skin, lanthanum, rubidium, and vanadium in gonads, as well as molybdenum and zinc in kidney (P<0.05). The capacity of observed elements put human health at risk were examined as well. The TE content in the tissues of A. braschnikowi and in the muscles of V. persa (P<0.05) differed significantly from the international standard levels (P<0.05). In this study, only lead indicated a target hazard quotient (THQ) index above 1. Therefore, high consumption of this fish (360 g per year) may be a matter of concern for the consumer. In the case of other evaluated elements, the THQ value was less than 1.
Keywords: Caspian Sea, Elements, ICP-OES, Fishing areas, Target hazard quotient
Copyright and License Information
© 2021 The Author(s); Published by Hamadan University of Medical Sciences.
This is an open-access article distributed under the terms of the Creative Commons Attribution License (
http://creativecommons.org/licenses/by/4.0), which permits unrestricted use, distribution, and reproduction in any medium provided the original work is properly cited.
1. Introduction
Heavy metals are considered as the important sources of hazardous pollutants in the aquatic ecosystems (1-5). These metals are usually discharged into the aquatic ecosystems and accumulate in water and sediments (6,7). A large quantity of metal ions is deposited in the sediment due to their adsorption, hydrolysis, and co-precipitation properties, while only a small amount of these elements can dissolve in water. The accumulated heavy metals in sediment can be chemically altered by organisms and converted into the organic complexes, some of which may put animal and human life at greater danger through the food chain (8-10). Industrial factories are constantly importing heavy metals from adjacent grounds into the coastal environments by river, inlets, and estuaries filled with run-off (10-14). The harmful effects of some metals are as follows:
Arsenic (As), similar to many elements, enters the environment through natural and anthropogenic sources (15). The World Health Organization (WHO), the Environmental Protection Agency (EPA), and several studies (16) have substantiated that inorganic As can increase the risk of lung, skin, bladder, liver, kidney, and prostate cancers in humans (17). Copper (Cu) is an essential element, high levels of which in the environment can cause accumulation in organisms (18-20) while lead (Pb) is one of the carcinogenic metals for humans. Children absorb Pb much more efficiently than adults do (4-5 times more), which affects their intelligence quotient (IQ) (17). Nickel (Ni) is not generally highly toxic, but high ingestion of it through contact can cause renal problems and skin allergies (21). Zinc (Zn) is also an essential micronutrient (22). The Caspian Sea is the largest continental water body in the world, and the Iranian coast stretches for nearly 700 km from Azerbaijan in the West to Turkmenistan in the East (Fig. 1). Sea currents transport entrapped pollutants, which are discharged locally or in adjacent Azerbaijan or even Russia, along the Iranian coast (23). Furthermore, more than 10 million people reside in the coastal provinces of Iran that border the Caspian Sea and frequently consume the Caspian Sea sturgeon and other types of fish (23,24). Trace metals accumulated by fish via local aquatic food chains have the potential to enter the human food chain (25). Given the biological, conservational, and commercial importance of members of the biological community of the Caspian Sea, it is necessary to understand how an increase in the bioavailability of toxic contaminants such as trace metals might markedly affect the biota of the Caspian.
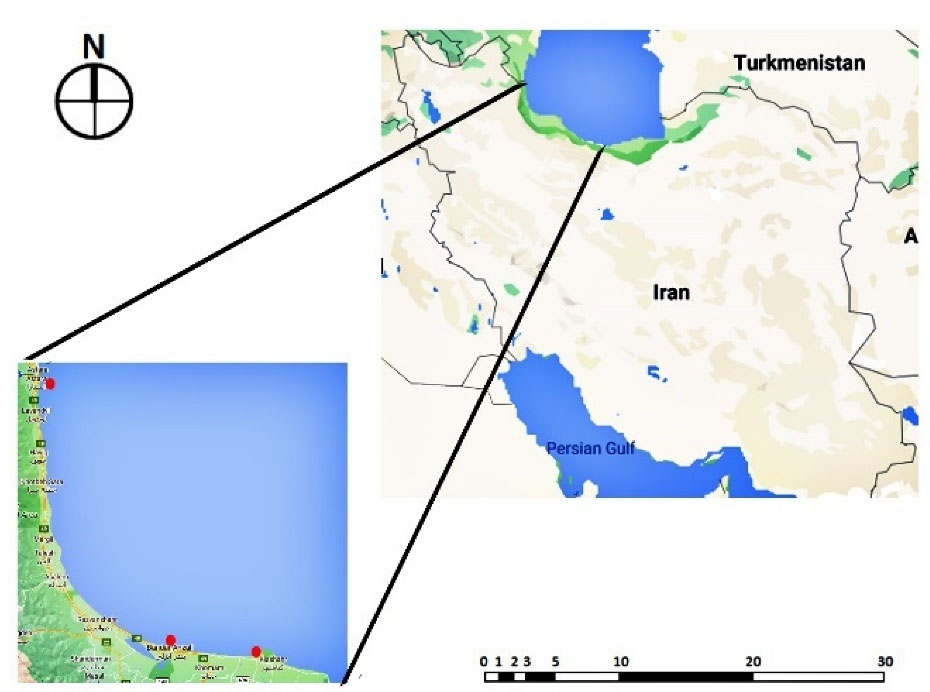
Figure 1.
Location of Fish Sampling Areas in the Southern Coasts of the Caspian Sea.
.
Location of Fish Sampling Areas in the Southern Coasts of the Caspian Sea.
According to Borodin (1904), Alosa braschnikowi is one of the economic fish that inhabits in the temperate regions. Its maximum length is reported to be 500 cm (9). Its diet is typically made up of mollusks, small crustaceans, and insects. These species spawn more frequently in the spring and summer, while their spawning pattern was shown to be different in the subspecies. Despite the small size, A. braschnikowi has a high nutritional value and is even more advantageous than red meat in some cases. This fish plays an important role in the food chain and the health of the Caspian Sea ecosystem. Owing to the important role of this fish in the food chain, it is extremely important to study its benefits for human consumption.
Vimba bream, Vimba persa (Pallas, 1814), Cypriniformes, Cyprinidae, Leuciscinae is a type of freshwater, brackish, benthopelagic, and anadromous fish living in the subtropical areas with temperature range of 10-20 °C (64°N - 35°N, 12°E - 53°E) reaching to maximum total length (TL) of 50.0 cm. Its common length is 20.0 cm, maximum published weight is 1.4 kg, and maximum age is reported to be 15 years. It feeds mainly on small molluscs and insect larvae. Distribution of this fish ranges from Eurasia, involving Caspian, Black, Marmara, and Baltic Sea basins, which flows in riffles in shallow fast-flowing streams and rivers on gravels. A number of studies were conducted on heavy metal pollution in Iran. For example, Bibak et al (26) measured heavy metal pollutions in sediments of Persian Gulf, and Eslami et al (27) explored metals in tissues of Perca fluviatilis and Tinca tinca in Wetland of Anzali. In another study, Alipour et al (28) investigated Rutilus rutilus caspicus from Miankaleh International Wetland, the Caspian Sea. Likewise, Heydari et al (29) conducted a study on Acipenser stellatus, Monsefrad et al (30) on Rutilus frisii kutum, and Khanipour et al (11) focused on Silurus glanis from Anzali Wetland, the Southwest Caspian Sea. There are also some reports on TE concentrations in R. kuum (30-34); however, there seems lack of studies on metal pollution in V. persa. Accordingly, the purpose of the present study was to report the levels of some elements (trace and major) in different tissues of V. persa and A. braschnikowi sampled from the Caspian Sea.
2. Materials and Methods
2.1. Sampling Location and Elements Measurement
Astara (38° 42ʹ 25ʺ N, 48° 86ʹ 87ʺ), Anzali (37° 46ʹ 39ʺ N, 49° 47ʹ 99ʺ), and Kiashahr (37° 42ʹ 20ʺ N, 49° 94ʹ 95ʺ) were the regions from which samples were taken. Sampling lasted one year from September 2017 to June 2018. A total of 156 fish pieces were caught (82 pieces of V. persa and 74 A. braschnikowi) and were then transferred to the laboratory at cool box of 4°C. The tissues were dissected in the laboratory. Liver and muscle tissues were isolated from V. persa, while askin, gonadal, and liver tissues were isolated from A. braschnikowi in the laboratory of Sowmehsara University, Guilan. Afterward, these tissues were dried in an oven (at 80°C for 18 hours). Then, samples were ground in a mortar. Subsequently, 1 g of powder was used for acid digestion, and nitric acid 65% was employed as a solvent for these tissues. The elements were assayed in Zarazma Company (Tehran, Iran) using an inductively coupled plasma-optical emission spectrometry (ICP-OES) device.
The metal selectivity index (MSI) was applied to explicit the concentration of elements in tissues as follows:
a = Absolute concentration of an element in a texture
t= Total absorption of all element in that texture
2.2. Statistical Analyses
The ICP-OES device was used to measure all elements in tissues (Tables 1 and 2). After examining the normality of the data and homogeneity of variances, analysis of covariance (ANCOVA) and Kruskal-Wallis tests were employed in this study. Finally, metal concentrations were compared with international standards (Tables 3 and 4) to determine the level of contamination and hazards of heavy metals in this study (36).
Table 1.
Morphometric Characteristics of Fish Sampling From the Three Regions of the South Caspian Sea
|
Values
|
Total Weight (g)
|
Total Length (cm)
|
Fork Length (cm)
|
Standard Length (cm)
|
Head Length (cm)
|
Snout Length (cm)
|
Eye Diameter(cm)
|
Body Height (cm)
|
Body Width (cm)
|
|
Alosa
braschnikowi
|
| Average |
252.72 |
30.23 |
27.19 |
25.74 |
6.68 |
1.94 |
1.28 |
6.36 |
2.96 |
| SD |
130.71 |
4.88 |
4.47 |
4.32 |
0.93 |
0.33 |
0.13 |
1.15 |
0.63 |
| Max. |
810 |
42 |
39 |
36.5 |
8.9 |
2.9 |
1.7 |
10.2 |
5 |
| Min. |
45 |
18 |
16 |
15 |
4.2 |
1.1 |
1 |
3.6 |
1.2 |
|
Vimba
persa
|
| Average |
65.61 |
18.04 |
16.21 |
14.90 |
3.55 |
1.01 |
0.93 |
3.99 |
1.91 |
| SD |
33.98 |
2.38 |
2.15 |
2.02 |
0.50 |
0.18 |
0.12 |
0.66 |
0.33 |
| Max. |
205 |
25 |
23 |
21.5 |
4.8 |
1.5 |
1.2 |
6.1 |
3 |
| Min. |
30 |
14 |
12.5 |
11.5 |
2.6 |
0.6 |
0.6 |
2.2 |
1.2 |
Note. SD: Standard deviation; Max: Maximum; Min: Minimum.
Table 2.
Maximum Permitted Concentration in Parts Per Million (ppm) Recommended by Codex Alimentarius Commission (FAO & WHO, 2018) and US Food and Drug Administration (2011)
|
Elements
|
Maximum Permitted Concentration (ppm)
|
| Pb |
0.5 |
| Cd |
2 |
| As |
0.1 |
| Cr |
1 |
| Al |
100 |
| Sb |
1 |
| Sn |
230 |
| Cu |
10 |
| Mn |
0.5 |
| Zn |
100 |
Note. FAO: Food and Agriculture Organization; WHO: World Health Organization; Pb: Lead; Cd: Cadmium; As: Arsenic; Cr: Chromium; Al: Aluminium; Sb: Antimony; Sn: Tin; Cu: Copper; Mn: Manganese; Zn: Zinc.
Table 3.
Concentration of Trace Elements in V. persa Muscle at Three Fisheries Regions Around the South Caspian Sea
Elemental
Variables (ppm)
|
Mean ± SE
Range
|
P
value
|
|
Anzali
|
Astara
|
Kiashahr
|
Total
|
| Ag |
BDL |
BDL |
BDL |
BDL |
- |
| Al |
2.27±0.77
0.96-2.96 |
1.56±0.64
0.65-2.45 |
2.02 |
1.87±0.72
0.65-2.96 |
0.26* |
| As |
0.09±0.03
0.05-0.14 |
0.06±0.02
0.04-0.1 |
BDL |
0.07±0.03
0.04-0.14 |
0.69* |
| Ba |
BDL |
BDL |
BDL |
BDL |
- |
| Be |
BDL |
BDL |
BDL |
BDL |
- |
| Bi |
BDL |
BDL |
BDL |
BDL |
- |
| Ca |
309±179.59
89.8-522.5 |
250.01±223.56
26.9-573.8 |
196.3 |
268.56±192.50
26.9-573.8 |
0.83* |
| Cd |
0.08±0
0.08-0.08 |
0.01±0
0.01-0.01 |
BDL |
0.04±0.04
0.01-0.08 |
0.85** |
| Ce |
BDL |
BDL |
BDL |
BDL |
- |
| Co |
BDL |
0.02±0.01
0.01-0.04 |
BDL |
0.02±0.01
0.01-0.04 |
0.21** |
| Cr |
0.07±0.01
0.05-0.09 |
0.07±0.01
0.06-0.11 |
0.07 |
0.07±0.01
0.05-0.11 |
0.97* |
| Cu |
0.08±0.02
0.05-0.11 |
0.07±0.03
0.03-0.13 |
BDL |
0.07±0.03
0.03-0.13 |
0.26* |
| Fe |
1.40±0.50
0.92-2.11 |
1.47±0.31
1.11-1.99 |
0.97 |
1.40±0.39
0.92-2.11 |
0.52* |
| K |
262.8±73.91
167.4-345.1 |
226±67.12
137.9-350 |
197.8 |
237.98±67.44
137.9-350 |
0.57* |
| La |
BDL |
BDL |
BDL |
BDL |
- |
| Li |
0.01±0
0.01-0.01 |
0.01±0
0.01-0.01 |
BDL |
0.01±0
0.01-0.01 |
0.81** |
| Mg |
27.76±9.29
14.3-35.6 |
33.17±9.61
21.7-45.7 |
22.8 |
30.29±9.33
14.3-45.7 |
0.47* |
| Mn |
0.08±0.07
0.03-0.13 |
0.12±0.02
0.08-0.14 |
BDL |
0.10±0.04
0.03-0.14 |
0.25** |
| Mo |
BDL |
0.02±0.02
0.01-0.04 |
BDL |
0.02±0.02
0.01-0.04 |
0.39** |
| Na |
57.06±19.42
35-77 |
74.15±26.35
41.2-124.1 |
54.0 |
66.03±23.60
35-124.1 |
0.44* |
| Ni |
BDL |
0.03±0.03
0.01-0.07 |
BDL |
0.03±0.03
0.01-0.07 |
0.22** |
| P |
326.62±130.28
164.1-464.3 |
380±108.74
241.7-542.6 |
250.9 |
349.53±114.63
164.1-542.6 |
0.52* |
| Pb |
0.04±0
0.04-0.04 |
0.02±0.01
0.01-0.03 |
BDL |
0.02±0.01
0.01-0.04 |
0.70** |
| Rb |
0.30±0.21
0.09-0.52 |
0.66±0.14
0.52-0.8 |
BDL |
0.48±0.25
0.09-0.8 |
0.67** |
| S |
194.26±68.43
106-261.3 |
211.97±68.11
134.1-297.4 |
164.9 |
201.53±63.86
107-297.4 |
0.78* |
| Sb |
0.06±0.02
0.02-0.09 |
0.05±0.04
0.01-0.11 |
0.09 |
0.05±0.03
0.01-0.11 |
0.64* |
| Si |
0.33±0.08
0.22-0.45 |
0.28±0.21
0.05-0.69 |
0.26 |
0.30±0.16
0.05-0.69 |
0.86* |
| Sn |
0.07±0
0.07-0.07 |
0.05±0.01
0.05-0.07 |
BDL |
0.06±0.01
0.05-0.07 |
0.66** |
| Sr |
2.68±1.92
0.05-4.9 |
2.31±2.02
0.34-5.41 |
1.73 |
2.41±1.83
0.05-5.41 |
0.89* |
| Th |
0.04±0
0.04-0.04 |
0.03±0.02
0.01-0.05 |
BDL |
0.03±0.01
0.01-0.05 |
0.63** |
| Ti |
0.02±0
0.02-0.02 |
0.02±0.02
0.01-0.05 |
BDL |
0.02-0.01
0.01-0.05 |
0.58** |
| V |
BDL |
BDL |
BDL |
BDL |
- |
| W |
BDL |
0.01±0
0.01-0.01 |
BDL |
0.01±0
0.01-0.01 |
0.65** |
| Zn |
0.97±0.39
0.47-1.39 |
1.04±0.26
0.63-1.41 |
0.69 |
0.99±0.31
0.47-1.41 |
0.59* |
Note. ANOVA: Analysis of variance; SE: Standard error; P is regarded as being significant if < 0.05. *Tested by one-way ANOVA; **Tested by Kruskal-Wallis.
BDL: Below detectable level; Ag: Silver; Al: Aluminium; As: Arsenic; Ba: Barium; Be: Beryllium; Bi: Bismuth; Ca: Calcium; Cd: Cadmium; Ce: Caesium; Co: Cobalt; Cr: Chromium; Cu: Copper; Fe: Iron; K: Potassium; La: Lanthanum; Li: Lithium; Mg: Magnesium; Mn: Manganese; Mo: Molybdenum; Na: Sodium; Ni: Nickel; P: Phosphorus; Pb: Lead; Rb: Rubidium; S: Sulphur; Sb: Antimony; Si: Silicon; Sn: Tin; Sr: Strontium; Th: Thorium; Ti: Titanium; V: Vanadium; W: Tungsten; Y: Yttrium; Zn: Zinc.
Table 4.
The Trace Element Levels in the V. persa Liver at Three Fishing Regions Around the South Caspian Sea
Elemental
Variables (ppm)
|
Mean ± SE
Range
|
P
Value
|
|
Anzali
|
Astara
|
Kiashahr
|
Total
|
| Ag |
BDL |
BDL |
BDL |
BDL |
- |
| Al |
1.60±0.64
0.91-2.35 |
2.21±1.51
0.38-4.68 |
1.76 |
1.94±1.17
0.38-4.68 |
0.70* |
| As |
0.04±0.01
0.03-0.05 |
0.03±0.01
0.02-0.06 |
BDL |
0.03±0.01
0.02-0.06 |
0.61** |
| Ba |
BDL |
0.02±0
0.02-0.02 |
BDL |
0.02±0
0.02-0.02 |
0.39** |
| Be |
BDL |
BDL |
BDL |
BDL |
- |
| Bi |
BDL |
BDL |
BDL |
BDL |
- |
| Ca |
35.18±23.16
13.9-76.3 |
62.7±39.01
15.8-125.8 |
22.1 |
50.14±34.9
13.9-125.8 |
0.34** |
| Cd |
0.01±0
0.01-0.01 |
0.01±0.005
0.01-0.02 |
- |
0.01±0.005
0.01-0.02 |
0.53** |
| Ce |
BDL |
BDL |
BDL |
BDL |
- |
| Co |
0.01±0.01
0.01-0.01 |
0.01±0.01
0.01-0.01 |
BDL |
0.01±0
0.01-0.01 |
0.81** |
| Cr |
0.35±0.58
0.05-1.4 |
0.09±0.04
0.04-0.17 |
0.09 |
0.19±0.36
0.04-1.4 |
0.93** |
| Cu |
0.25±0.12
0.12-0.45 |
0.48±0.36
0.2-1.17 |
0.47 |
0.39±0.29
0.12-1.17 |
0.30** |
| Fe |
11.88±8.31
5.35-24.1 |
12.37±7.47
5.92-27.84 |
23.22 |
13.01±7.77
5.35-27.84 |
0.42* |
| K |
138.9±40.80
95.9-204.2 |
136.22±53.84
91.6-247 |
187.4 |
141.19±46.89
91.6-247 |
0.62* |
| La |
BDL |
BDL |
BDL |
BDL |
- |
| Li |
BDL |
0.03±0.01
0.02-0.04 |
BDL |
0.03±0.01
0.02-0.04 |
0.39** |
| Mg |
14.26±6.64
7.1-23.4 |
25.11±12.28
13.5-48.6 |
19.6 |
20.51±10.90
7.1-48.6 |
0.25* |
| Mn |
0.12±0.02
0.11-0.14 |
0.09±0.06
0.05-0.19 |
0.11 |
0.10±0.05
0.05-0.19 |
0.61** |
| Mo |
0.01±0
0.01-0.01 |
0.01±0.005
0.01-0.02 |
BDL |
0.01±0.005
0.01-0.02 |
0.53** |
| Na |
59.92±37.48
24.1-122.6 |
78.45±44.11
47.4-174.9 |
81.5 |
71.56±39.16
24.1-176.9 |
0.30** |
| Ni |
0.08±0.07
0.02-0.17 |
0.02±0.02
0.01-0.06 |
BDL |
0.05±0.06
0.01-0.17 |
0.40** |
| P |
169.94±60.17
85.9-224.1 |
195.24±124.21
100-469.7 |
274.1 |
191.57±98.45
85.9-469.7 |
0.66* |
| Pb |
0.05±0
0.05-0.05 |
0.09±0.04
0.06-0.15 |
BDL |
0.08±0.04
0.05-0.15 |
0.45** |
| Rb |
0.45±0.26
0.27-0.64 |
0.56±0.46
0.18-1.44 |
BDL |
0.53±0.40
0.18-1.44 |
0.35* |
| S |
123.02±57.88
57.4-209.7 |
158.18±74.24
80.7-313 |
159.6 |
144.76±65.75
57.4-313 |
0.67* |
| Sb |
0.06±0.01
0.03-0.07 |
0.05±0.03
0.01-0.09 |
0.08 |
0.05±0.02
0.01-0.09 |
0.45** |
| Si |
0.44±0.25
0.27-0.88 |
0.35±0.14
0.18-0.55 |
0.38 |
0.39±0.18
0.18-0.88 |
0.77* |
| Sn |
0.06±0
0.06-0.06 |
0.06±0.02
0.04-0.09 |
BDL |
0.06±0.02
0.04-0.09 |
0.58** |
| Sr |
0.18±0.13
0.06-0.42 |
0.38±0.19
0.19-0.78 |
0.15 |
0.28±0.19
0.06-0.78 |
0.15* |
| Th |
0.03±0
0.03-0.03 |
0.06±0.02
0.05-0.08 |
BDL |
0.05±0.02
0.03-0.08 |
0.45** |
| Ti |
0.06±0
0.06-0.06 |
0.05±0.03
0.02-0.08 |
BDL |
0.05-0.02
0.02-0.08 |
0.63** |
| V |
BDL |
BDL |
BDL |
BDL |
- |
| W |
0.01±0
0.01-0.01 |
BDL |
BDL |
BDL |
0.44** |
| Zn |
1.38±0.36
1.03-1.85 |
1.67±1.24
0.9-4.35 |
1.17 |
1.56±0.91
0.9-4.35 |
0.64** |
Note. SE: Standard error; ANOVA: Analysis of variance; *Tested by one-way ANOVA; **Tested by Kruskal-Wallis.
BDL: Below detectable level; Ag: Silver; Al: Aluminium; As: Arsenic; Ba: Barium; Be: Beryllium; Bi: Bismuth; Ca: Calcium; Cd: Cadmium; Ce: Caesium; Co: Cobalt; Cr: Chromium; Cu: Copper; Fe: Iron; K: Potassium; La: Lanthanum; Li: Lithium; Mg: Magnesium; Mn: Manganese; Mo: Molybdenum; Na: Sodium; Ni: Nickel; P: Phosphorus; Pb: Lead; Rb: Rubidium; S: Sulphur; Sb: Antimony; Si: Silicon; Sn: Tin; Sr: Strontium; Th: Thorium; Ti: Titanium; V: Vanadium; W: Tungsten; Zn: Zinc.
2.3. Target Hazard Quotient (THQ)
THQ was calculated via the following equation:
where EF: Frequency of exposure (In this study,360 days per year were considered)
ED: Duration of exposure (In this study, 70 years were considered for adults)
FIR: Rate of fish ingestion, (25 g day-1 for adults)
C: Concentration of elements in the muscle of fish (mg kg-1)
RfD: Oral reference dose (mg kg-1 day 1)
W: Average body weight (kg, 70 kg for adults)
ATn: Mean exposure time for noncarcinogens (365 days year-1 ×ED).
3. Results and Discussion
3.1. Sampling and Studied Elements
In this study, fish specimens were dissected and their muscle and liver (for V. persa) as well as gonad, skin, and kidney (for A. braschnikowi) were examined for 34 elements including silver (Ag), aluminium (Al), As, barium (Ba), beryllium (Be), bismuth (Bi), calcium (Ca), cadmium (Cd), caesium (Ce), cobalt (Co), chromium (Cr), and Cu. The other elements were iron (Fe), potassium (K), lanthanum (La), lithium (Li), magnesium (Mg), manganese (Mn), molybdenum (Mo), sodium (Na), Ni, phosphorus (P), Pb, rubidium (Rb), sulphur (S), antimony (Sb), scandium (Sc), silicon (Si), tin (Sn), strontium (Sr), thorium (Th), titanium (Ti), vanadium (V), tungsten (W), yttrium (Y), and Zn.
3.2. Tissue Element Analyses in Vimba persa
Table 4 illustrates that the element levels in the fish gonads were not significantly different between the sampling areas. Table 5 also depicts the extent of MSI in all the sampling areas. According to this table, the rate of this index in Astara and Anzali was almost the same while different from Kiashahr. The amount of MSI for each element can be observed in Table 5.
Table 5.
Metal Selectivity Index in the Muscle of V. persaat Three Fisheries Regions of the South Caspian Sea
|
Elements
|
Astara
|
Anzali
|
Kiashahr
|
| Al |
2.12 |
3.07 |
3.62 |
| As |
0.09 |
0.13 |
0.09 |
| Ca |
338.32 |
417.02 |
351.88 |
| Cr |
0.10 |
0.10 |
0.13 |
| Cu |
0.09 |
0.11 |
0.00 |
| Fe |
2.00 |
1.89 |
1.74 |
| K |
305.82 |
354.67 |
354.57 |
| Mg |
44.89 |
37.46 |
40.87 |
| Mn |
0.16 |
0.11 |
0.00 |
| Na |
100.35 |
77.01 |
96.80 |
| P |
514.22 |
440.80 |
449.75 |
| S |
286.84 |
262.17 |
295.59 |
| Sb |
0.07 |
0.08 |
0.16 |
| Si |
0.38 |
0.45 |
0.47 |
| Sr |
3.13 |
3.63 |
3.10 |
| Zn |
1.42 |
1.31 |
1.24 |
Note. Ag: Silver; As: Arsenic; Ca: Calcium; Cr: Chromium; Cu: Copper; Fe: Iron; K: Potassium; Mg: Magnesium; Mn: Manganese; Na: Sodium; P: Phosphorus; S: Sulphur; Sb: Antimony; Si: Silicon; Sr: Strontium; Zn: Zinc.
Several information is available on elements in aquatic environments of the Caspian Sea; however, there is a few information about elements in V. persa. As such, this study is the first report about its contamination in Iran. It was found that the average concentrations of As, Ca, Cd, Co, K, Mg, Mo, P, S, and Sr in muscle tissue were higher than in liver, while Al, Cr, Cu, Fe, Li, Na, Ni, Pb, Rb, Si, Th, Ti, and Zn in liver were shown to be higher than in muscle even though the differences between these tissues were not significant (P > 0.05). The presence of higher levels of Cd, Pb, Cu, and Zn in liver compared with muscle may be due to some physiological functions, which form complexes in liver such as metallothionein, a protein formed in liver with higher affinity to bind with some elements such as Zn and Cu. The element levels in the liver, as an important organ in the element detoxification in the body, were measured as well. Various studies have shown that the liver stores these elements at high levels (37).
3.3. Tissue Element Analyses in Alosa braschnikowi
The level of 30 elements in the skin were examined, and the related data are provided in Tables 6-8. Some element levels including Ag, Ba, Be, Ce, and Y in the skin were less than detectable. It was also true for the fish gonads. In kidney, in addition to the aforementioned elements in the skin and liver, La and V were also lower than the detection limit. Only 28 elements were used in the statistical analyses of kidney. The levels of W, Cu, and L in the skin were significantly different in all three sampling areas (P < 0.05) while no significant difference was reported for the other elements (P > 0.05).
Table 6.
The Trace Element Levels in the Alosa braschnikowi Skin at Three Fishing Regions Around the South Caspian Sea
Elemental
Variables (ppm)
|
Mean ± SE
Range
|
P
Value
|
|
Anzali
|
Astara
|
Kiashahr
|
Total
|
| Al |
3.66±1.68
1.95-5.9 |
2.74±0.70
2.25-3.24 |
1.63±0.86
0.79-2.52 |
2.78±1.48
0.79-5.9 |
0.21* |
| As |
0.07±0.02
0.04-0.1 |
0.05±0.007
0.05-0.06 |
0.08±0.02
0.07-0.11 |
0.07±0.02
0.04-0.11 |
0.42* |
| Ba |
0.01±0.005
0.01-0.02 |
0.01±0.007
0.01-0.02 |
0.01±0
0.01-0.01 |
0.01±0.004
0.01-0.02 |
0.26** |
| Ca |
124.35±74.07
33.6-214.5 |
97.35±10.25
90.1-104.6 |
168.66±40.18
125-204.1 |
133.12±57.50
33.6-214.5 |
0.41* |
| Cd |
0.01±0
0.01-0.01 |
0.01±0
0.01-0.01 |
BDL |
0.01±0
0.01-0.01 |
0.31** |
| Co |
0.01±0.007
0.01-0.02 |
0.01±0.007
0.01-0.02 |
0.01±0
0.01-0.01 |
0.01±0.005
0.01-0.02 |
0.51* |
| Cr |
0.05±0.005
0.05-0.06 |
0.04±0.007
0.04-0.05 |
0.05±0.01
0.04-0.07 |
0.05±0.009
0.04-0.07 |
0.48* |
| Cu |
0.07±0.04
0.04-0.14 |
0.04±0
0.04-0.04 |
0.03±0
0.03-0.03 |
0.05±0.03
0.03-0.14 |
0.03** |
| Fe |
5.57±1.43
3.6-6.89 |
1.93±0.55
1.54-2.32 |
5.64±1.92
4.28-7.84 |
4.78±2.08
1.54-7.84 |
0.06* |
| K |
82.85±26.19
45.4-106 |
91.15±2.05
89.7-92.6 |
122.66±2.08
121-125 |
97.96±24.77
45.4-125 |
0.07* |
| La |
BDL |
0.01±0
0.01-0.01 |
BDL |
0.01±0
0.01-0.01 |
0.01** |
| Li |
0.02±0
0.02-0.02 |
0.02±0.02
0.01-0.04 |
BDL |
0.02±0.01
0.01-0.04 |
0.09** |
| Mg |
13.16±3.73
7.94-16.8 |
22.1±12.86
13-31.2 |
10.44±1.37
8.92-11.6 |
14.24±6.91
7.94-31.2 |
0.24** |
| Mn |
0.15±0.04
0.09-0.2 |
0.08±0.06
0.04-0.13 |
0.09±0.03
0.06-0.13 |
0.12±0.05
0.04-0.2 |
0.18* |
| Mo |
0.01±0
0.01-0.01 |
0.01±0
0.01-0.01 |
0.01±0
0.01-0.01 |
0.01±0
0.01-0.01 |
0.51** |
| Na |
29.8±11.91
14.4-42.2 |
30.6±9.61
23.8-37.4 |
26.63±4.67
21.4-30.4 |
28.92±8.56
14.4-42.2 |
0.88* |
| Ni |
0.01±0.005
0.01-0.02 |
0.02±0.02
0.01-0.04 |
0.01±0
0.01-0.01 |
0.01±0.01
0.01-0.04 |
0.11* |
| P |
108.77±61.05
55.4-190.1 |
151.65±92.84
86-217.3 |
115.4±23.56
94.8-141.1 |
120.51±54.18
55.4-217.3 |
0.70* |
| Pb |
0.04±0.02
0.01-0.08 |
0.04±0.02
0.03-0.06 |
0.06±0.02
0.05-0.09 |
0.05±0.02
0.01-0.09 |
0.57* |
| Rb |
1.06±0.57
0.74-1.92 |
0.68±0.17
0.56-0.81 |
0.73±0.18
0.53-0.88 |
0.87±0.41
0.53-1.92 |
0.88** |
| S |
329.75±406.94
113-940 |
115.5±4.94
112-119 |
398±491.95
107-966 |
304.88±367.60
107-966 |
0.44** |
| Sb |
0.03±0.01
0.01-0.04 |
0.03±0.02
0.01-0.05 |
0.01±0.005
0.01-0.02 |
0.02±0.01
0.01-0.05 |
0.38* |
| Si |
0.32±0.22
0.12-0.54 |
0.18±0.01
0.17-0.19 |
0.38±0.04
0.36-0.44 |
0.31±0.16
0.12-0.54 |
0.42* |
| Sn |
0.07±0.04
0.02-0.11 |
0.13±0.07
0.08-0.18 |
0.08±0.01
0.08-0.1 |
0.09±0.04
0.02-0.18 |
0.34* |
| Sr |
0.14±0.04
0.09-0.2 |
0.12±0.05
0.08-0.16 |
0.10±0.02
0.09-0.13 |
0.12±0.04
0.08-0.2 |
0.50* |
| Th |
0.08±0.05
0.04-0.16 |
0.06±0.007
0.06-0.07 |
0.11±0.01
0.09-0.12 |
0.08±0.03
0.04-0.16 |
0.46* |
| Ti |
0.24±0.09
0.11-0.33 |
0.08±0.02
0.07-0.1 |
0.18±0.12
0.06-0.31 |
0.18-0.10
0.06-0.33 |
0.25* |
| V |
0.01±0
0.01-0.01 |
BDL |
BDL |
0.01±0
0.01-0.01 |
0.45** |
| W |
0.02±0.01
0.01-0.03 |
BDL |
0.03±0.005
0.03-0.04 |
0.02±0.01
0.01-0.04 |
0.01* |
| Zn |
2.17±0.96
1.22-3.29 |
0.56±0.09
0.5-0.63 |
3.57±0.19
3.34-3.69 |
2.28±1.31
0.5-3.69 |
0.09* |
Note. SE: Standard error; ANOVA: Analysis of variance; P is regarded as being significant (*) if < 0.05. *Tested by one-way ANOVA; **Tested by Kruskal–Wallis; BDL: Below detectable level.
Ag: Silver; Al: Aluminium; As: Arsenic; Ba: Barium; Be: Beryllium; Bi: Bismuth; Ca: Calcium; Cd: Cadmium; Ce: Caesium; Co: Cobalt; Cr: Chromium; Cu: Copper; Fe: Iron; K: Potassium; La: Lanthanum; Li: Lithium; Mg: Magnesium; Mn: Manganese; Mo: Molybdenum; Na: Sodium; Ni: Nickel; P: Phosphorus; Pb: Lead; Rb: Rubidium; S: Sulphur; Sb: Antimony; Si: Silicon; Sn: Tin; Sr: Strontium; Th: Thorium; Ti: Titanium; V: Vanadium; W: Tungsten; Zn: Zinc.
Table 7.
The Trace Element Levels in the Alosa braschnikowi Gonads at Three Fishing Regions Around the South Caspian Sea
Elemental
Variables (ppm)
|
Mean ± SE
Range
|
P
Value
|
|
Anzali
|
Astara
|
Kiashahr
|
Total
|
| Al |
1.01±0.55
0.62-1.83 |
3.03 |
0.69±0.25
0.54-0.98 |
1.14±0.86
0.54-3.03 |
0.20** |
| As |
0.03±0.01
0.02-0.05 |
0.02 |
0.05±0.01
0.04-0.06 |
0.04±0.01
0.02-0.06 |
0.17* |
| Ba |
0.01±0.005
0.01-0.02 |
0.01 |
0.01±0.005
0.01-0.02 |
0.01±0.004
0.01-0.02 |
0.78** |
| Ca |
125.3±3.61
120.8-129.6 |
97.5 |
88.63±63.16
42.9-160.7 |
108.07±38.63
42.9-160.7 |
0.51* |
| Cd |
0.01±0.007
0.01-0.02 |
BDL |
0.01±0
0.01-0.01 |
0.01±0.004
0.01-0.02 |
0.54* |
| Co |
0.01±0
0.01-0.01 |
BDL |
0.01±0
0.01-0.01 |
0.01±0
0.01-0.01 |
0.55** |
| Cr |
0.05±0.008
0.04-0.06 |
0.04 |
0.05±0.01
0.04-0.07 |
0.05±0.01
0.04-0.07 |
0.63* |
| Cu |
0.06±0.005
0.06-0.07 |
0.04 |
0.05±0.01
0.04-0.06 |
0.05±0.01
0.04-0.07 |
0.13** |
| Fe |
1.87±0.07
1.79-1.95 |
1.47 |
3±1.43
2.14-4.66 |
2.24±1.0001
1.47-4.66 |
0.05** |
| K |
288.25±44.02
239-335 |
156 |
271.66±54.37
211-316 |
265.25±61.34
154-335 |
0.13* |
| La |
BDL |
0.1 |
BDL |
0.1±0
0.1-0.1 |
0.03** |
| Li |
0.02±0
0.02-0.02 |
0.02 |
BDL |
0.02±0
0.02-0.02 |
0.17** |
| Mg |
15.77±3.20
12.3-19.9 |
18.7 |
16.66±4.40
11.7-20.1 |
16.47±3.30
11.7-20.1 |
0.78* |
| Mn |
0.06±0.01
0.05-0.08 |
0.02 |
0.04±0.03
0.02-0.08 |
0.05±0.02
0.02-0.08 |
0.22* |
| Mo |
0.01±0
0.01-0.01 |
0.01 |
0.01±0
0.01-0.01 |
0.01±0
0.01-0.01 |
0.82** |
| Na |
39.27±2.98
36.8-43.4 |
27.8 |
50.63±13.78
37.8-65.2 |
42.1±11.09
27.8-65.2 |
0.15* |
| Ni |
0.02±0.01
0.01-0.03 |
BDL |
0.01±0.005
0.01-0.02 |
0.01±0.008
0.01-0.03 |
0.63* |
| P |
232.75±36.83
190-279 |
137 |
227.66±47.60
173-260 |
218.87±48.26
137-279 |
0.20* |
| Pb |
0.05±0.03
0.01-0.09 |
0.08 |
0.07±0.03
0.05-0.11 |
0.06±0.03
0.01-0.11 |
0.57* |
| Rb |
0.92±0.02
0.89-0.95 |
0.9 |
0.73±0.07
0.66-0.8 |
0.85±0.10
0.66-0.95 |
0.00* |
| S |
125.75±19.06
103-142 |
134 |
160.66±43.50
111-192 |
139.87±31.63
103-192 |
0.40* |
| Sb |
0.02±0.005
0.02-0.03 |
0.01 |
0.01±0
0.01-0.01 |
0.01±0.007
0.01-0.03 |
0.41** |
| Si |
0.25±0.03
0.22-0.3 |
0.11 |
0.18±0.13
0.08-0.33 |
0.20±0.08
0.08-0.33 |
0.36* |
| Sn |
0.08±0.04
0.02-0.12 |
0.06 |
0.05±0.03
0.02-0.09 |
0.06±0.03
0.02-0.12 |
0.63* |
| Sr |
0.07±0.03
0.05-0.11 |
0.05 |
0.07±0.01
0.06-0.08 |
0.07±0.02
0.05-0.11 |
0.67* |
| Th |
0.05±0.01
0.03-0.06 |
0.02 |
0.05±0.02
0.03-0.07 |
0.04±0.01
0.02-0.07 |
0.30* |
| Ti |
0.02±0.01
0.02-0.04 |
0.03 |
0.02±0.01
0.01-0.04 |
0.02±0.01
0.01-0.04 |
0.93* |
| U |
BDL |
BDL |
BDL |
BDL |
- |
| V |
BDL |
0.1 |
BDL |
0.1±0
0.1-0.1 |
0.03** |
| W |
0.05±0.02
0.03-0.09 |
0.03 |
0.04±0.01
0.3-0.05 |
0.04±0.02
0.03-0.09 |
0.41* |
| Zn |
5.01±1.64
3.39-7.24 |
2.66 |
3.81±0.71
3-4.37 |
4.27±1.44
2.66-7.24 |
0.31* |
Note. SE: Standard error; ANOVA: Analysis of variance; P is regarded as being significant (*) if < 0.05. *Tested by ANOVA; **Tested by Kruskal-Wallis.
BDL: Below detectable level. Ag: Silver; Al: Aluminium; As: Arsenic; Ba: Barium; Be: Beryllium; Bi: Bismuth; Ca: Calcium; Cd: Cadmium; Ce: Caesium; Co: Cobalt; Cr: Chromium; Cu: Copper; Fe: Iron; K: Potassium; La: Lanthanum; Li: Lithium; Mg: Magnesium; Mn: Manganese; Mo: Molybdenum; Na: Sodium; Ni: Nickel; P: Phosphorus; Pb: Lead; Rb: Rubidium; S: Sulphur; Sb: Antimony; Si: Silicon; Sn: Tin; Sr: Strontium; Th: Thorium; Ti: Titanium; V: Vanadium; W: Tungsten; Zn: Zinc.
Table 8.
Concentrations of Trace Elements in A. braschnikowi Kidney at Three Fishing Regions of the South Caspian Sea
Elemental
Variables (ppm)
|
Mean ± SE
Range
|
P
Value
|
|
Anzali
|
Astara
|
Kiashahr
|
Total
|
| Al |
1.35±0.78
0.61-2.12 |
0.9 |
1.81±1.39
0.92-3.42 |
1.46±0.96
0.61-3.42 |
0.74* |
| As |
0.03±0.01
0.02-0.05 |
0.04 |
0.03±0.01
0.02-0.04 |
0.03±0.01
0.02-0.05 |
0.52** |
| Ba |
0.01±0.005
0.01-0.02 |
0.02 |
0.01±0
0.01-0.01 |
0.01±0.004
0.01-0.02 |
0.17** |
| Ca |
81.6±21.11
56.4-105.3 |
63.4 |
85.53±25.37
62.6-112.8 |
80.8±20.69
56.4-112.8 |
0.71* |
| Cd |
0.06±0.06
0.01-0.13 |
0.02 |
0.01±0
0.01-0.01 |
0.04±0.04
0.01-0.13 |
0.15** |
| Co |
0.02±0.008
0.01-0.03 |
0.02 |
0.01±0
0.01-0.01 |
0.01±0.007
0.01-0.03 |
0.14** |
| Cr |
0.05±0
0.05-0.05 |
0.04 |
0.04±0.01
0.03-0.05 |
0.04±0.007
0.03-0.05 |
0.13** |
| Cu |
0.10±0.02
0.07-0.12 |
0.12 |
0.07±0.04
0.04-0.12 |
0.09±0.03
0.04-0.12 |
0.37** |
| Fe |
4.91±0.75
4.32-6 |
5.6 |
4.7±3.60
2.54-8.86 |
4.92±2.009
2.54-8.86 |
0.94* |
| K |
136.25±28.07
100-166 |
146 |
123.96±85.56
67.4-222.4 |
132.86±49.94
67.4-222.4 |
0.93* |
| Li |
BDL |
BDL |
0.03±0
0.03-0.03 |
0.03±0
0.03-0.03 |
0.43** |
| Mg |
7.01±1.33
5.25-8.45 |
9.18 |
14.05±9.78
4.55-24.1 |
9.92±6.35
4.55-24.1 |
0.49** |
| Mn |
0.04±0.008
0.03-0.05 |
0.02 |
0.03±0.01
0.02-0.05 |
0.03±0.01
0.02-0.05 |
0.37* |
| Mo |
0.01±0
0.01-0.01 |
0.02 |
0.01±0
0.01-0.01 |
0.01±0.003
0.01-0.02 |
0.03** |
| Na |
60.8±18.64
48.3-88.5 |
56.4 |
41.93±31.70
20.1-78.3 |
53.17±22.91
20.1-88.5 |
0.62* |
| Ni |
0.01±0.005
0.01-0.02 |
BDL |
0.01±0
0.01-0.01 |
0.01±0.005
0.01-0.02 |
0.06* |
| P |
117.5±20.04
89-132 |
116 |
102.66±74.96
54-189 |
111.75±42.83
54-189 |
0.92* |
| Pb |
0.07±0.01
0.06-0.1 |
0.08 |
0.07±0.02
0.05-0.09 |
0.07±0.01
0.05-0.1 |
0.93* |
| Rb |
0.86±0.07
0.78-0.97 |
1.96 |
0.89±0.25
0.61-1.09 |
1.01±0.40
0.61-1.96 |
0.25** |
| S |
146.75±11.44
131-157 |
153 |
137.66±47.92
110-193 |
144.12±27.29
110-193 |
0.89* |
| Sb |
0.02±0.02
0.01-0.06 |
0.02 |
0.02±0.02
0.01-0.05 |
0.02±0.01
0.01-0.06 |
0.94** |
| Si |
1.45±2.53
0.11-5.26 |
0.14 |
0.33±0.32
0.09-0.7 |
0.87±1.78
0.09-5.26 |
0.95** |
| Sn |
0.04±0.01
0.03-0.05 |
0.04 |
0.04±0.02
0.03-0.07 |
0.04±0.01
0.03-0.07 |
0.93* |
| Sr |
0.03±0.005
0.03-0.04 |
0.02 |
0.04±0.02
0.02-0.07 |
0.03±0.01
0.02-0.07 |
0.48* |
| Th |
0.05±0.03
0.01-0.1 |
0.1 |
0.04±0.01
0.04-0.06 |
0.05±0.03
0.01-0.1 |
0.36* |
| Ti |
0.02±0.008
0.01-0.03 |
BDL |
0.04±0.03
0.01-0.08 |
0.02±0.02
0.01-0.08 |
0.24** |
| W |
0.01±0
0.01-0.01 |
BDL |
0.01±0
0.01-0.01 |
0.01±0
0.01-0.01 |
0.82** |
| Zn |
0.98±0.17
0.74-1.12 |
0.92 |
0.32±0.16
0.13-0.43 |
0.72±0.36
0.13-1.12 |
0.00* |
Note. SE: Standard error; P is considered significant (*) if < 0.05. *Tested by ANOVA; **Tested by Kruskal-Wallis.
BDL: Below detectable level. Ag: Silver; Al: Aluminium; As: Arsenic; Ba: Barium; Be: Beryllium; Bi: Bismuth; Ca: Calcium; Cd: Cadmium; Ce: Caesium; Co: Cobalt; Cr: Chromium; Cu: Copper; Fe: Iron; K: Potassium; La: Lanthanum; Li: Lithium; Mg: Magnesium; Mn: Manganese; Mo: Molybdenum; Na: Sodium; Ni: Nickel; P: Phosphorus; Pb: Lead; Rb: Rubidium; S: Sulphur; Sb: Antimony; Si: Silicon; Sn: Tin; Sr: Strontium; Th: Thorium; Ti: Titanium; V: Vanadium; W: Tungsten; Zn: Zinc.
Table 7 depicts that Rb, La, and V levels were significantly different in the sampling areas (P < 0.05) while other elements did not exhibit significant differences in these areas (P > 0.05).
Table 8 illustrates that the Mo and Zn levels were significantly different in the sampling areas (P < 0.05), while other elements did not show significant differences in the sampling areas (P > 0.05).
Visnjic et al studied elements in the Alosa tissues, reporting that the element levels in its liver were significantly higher than in its other tissues. In their study, Zn, Cu, Ca, and iron were reported to be at higher levels of accumulation in the fish liver (38), similar to the results obtained for the Cu and Fe in the present study. The results of the present study are also consistent with the results of a study conducted by Yilmaz et al (39) who investigated the element accumulations in the tissue of Tinca tinca. They found that the Cu and Fe levels in the fish liver were higher than in other tissues. In addition, they reported that Zn, Cu, Ca, and Fe had a higher level of accumulation in the fish liver, similar to the results obtained regarding the Cu and Fe in the present study. Other studies can be seen in Table 9.
Table 9.
The Comparison Between the Results of the Present Study and Results in the Literature
Element
Fish Species
|
As
(Mean ± SD)
|
Cu
(Mean ± SD)
|
Pb
(Mean ± SD)
|
Mn
(Mean ± SD)
|
Ni
(Mean ± SD)
|
Fe
(Mean ± SD)
|
Zn
(Mean ± SD)
|
Reference
|
|
Rutilus caspius
|
0.25±0.08 |
0.69±0.40 |
|
|
|
5.38±2.29 |
7.15±1.5 |
Alipour et al (40) |
|
Neogobius gorlap
|
0.24±0.09 |
2.37±1.01 |
|
|
|
7.88±2.64 |
10.21±2.25 |
Alipour et al (40) |
|
Esox lucius
|
|
0.21±0.02 |
0.004 ±0.0001 |
|
|
|
2.55±0.18 |
Imanpour Namin et al (41) |
|
Alosa caspia
|
|
|
0.34±0.09 |
|
|
1118±128.9 |
|
Alipour and Banagar (42) |
|
Clupeonella engraulformis
|
|
|
0.015±0.007 |
|
|
|
|
Taghvai Jelodar et al (16) |
|
Alburnus chalcoides
|
|
1.46±1.97 |
|
3.2±4.1 |
0.42 |
80.9±66.5 |
38.5±30.4 |
Mirzajani et al (43) |
|
Vimba persa
|
|
|
|
|
|
|
|
Present study |
Permitted by
FAO/WHO |
0.1 |
10 |
0.5 |
0.5 |
|
|
100 |
FAO/WHO 2018 (44) |
Note. SD: Standard deviation; As: Arsenic; Cu: Copper; Pb: Lead; Mn: Manganese; Ni: Nickel; Fe: Iron; Zn: Zinc; FAO: Food and Agriculture Organization; WHO: World health Organization.
The obtained results from THQ are presented in Table 10.
Table 10.
Estimated THQ of Some Elements due to the Consumption of Fish Species
|
|
|
Vimba
persa
|
|
|
|
Astara
|
Anzali
|
Kiyashahr
|
|
|
RFD
|
|
THQ
|
|
| Cd |
0.001 |
1.20 |
1.02 |
- |
| Cr |
1.5 |
0.006 |
0.006 |
0.006 |
| Cu |
40 |
0.002 |
0.002 |
- |
| Pb |
0.002 |
1.20 |
1.54 |
- |
| Fe |
0.7 |
0.027 |
0.025 |
0.017 |
| Zn |
300 |
0.004 |
0.004 |
0.002 |
Note. THQ: Target hazard quotient; Cd: Cadmium; Cr: Chromium; Cu: Copper; Pb: Lead; Fe: Iron; Zn: Zinc; RFD: Oral reference dose (mg/kg-day).
In the case of THQ higher than 1, the exposure is potentially cause for concern. Albeit, it should not be considered as a direct risk estimate (Table 10).
In this study, only Pb exhibited a THQ index above 1. Therefore, high consumption of this fish (360 days annually) may cause concern for the consumer. In the case of other assayed elements, the THQ value was less than 1 (Table 10). Alipour et al studied the level of THQ in Sander lucioperca, Liza auratus, Alosa caspia, Cyprinus carpio, and Liza saliens in the Gorgan bay, reporting that the THQ level was less than 1 (THQ < 1). Storelli (45) measured the Cd, Hg, and Pb levels in fish from the Adriatic Sea, reporting that, except for Pb, THQ of these elements was below 1 (THQ < 1), similar to the results obtained in the present study. Likewise, Majlesi et al (46) examined Pb levels in Esox Lucius, Oncorhynchus mykiss, and Cyprinus carpio, reporting that THQ level of Pb was lower than 1 (THQ < 1), which was not in line with the results obtained in the present study.
The study of element levels in the marine environments is extremely important, especially in fish as an important human food item. Biomonitoring should be done annually to monitor the entry of these metals into the environment. In this study, two commercially-important fish species in the Caspian Sea were examined in terms of the element accumulations.
4. Conclusion
In the north of Iran, skin and gonads of some fish species are consumed by people. It is of great importance study the amount of heavy metals in these tissues as well as in liver and muscle. In the present study, the mean element levels in fish muscles were lower than the provisional tolerable daily/weekly/monthly intake of the TEs, as permitted by the United States Environmental Protection Agency (USEPA, 2006) and the FAO and WHO (2018). The element levels in the V. persa muscles were lower than the levels reported in the previous studies from the Caspian Sea. Further, in this study, element levels in the gonad in the skin and kidney tissues of A. braschnikowi were lower than those permitted by Codex Alimentarius Commission. These levels could not pose any threats to human health. As such, it is recommended that TEs monitoring in aquatic organisms and the Caspian environment should be regularly conducted to find out the TE trends over time.
Authors’ Contributions
MS: Supervision, writing, reviewing, and editing; MB: Methodology, sample analysis, sampling, sample perpetration, investigation, and writing; MFV: Methodology, sample analysis, sampling, sample perpetration, and investigation.
Conflict of Interest Disclosures
The authors declare that they have no conflict of interests.
Acknowledgements
This study was financially supported by the Caspian Basin Research Center, University of Guilan, Rasht, Iran (File number: 21195170).
References
- Sattari M, Bibak M, Bakhshalizadeh S, Forouhar Vajargah M. Element accumulations in liver and kidney tissues of some bony fish species in the southwest Caspian Sea. J Cell Mol Res 2020; 12(1):33-40. doi: 10.22067/jcmr.v12i1.85975 [Crossref] [ Google Scholar]
- Sattari M, Majidi S, Imanpour Namin J, Bibak M, Forouhar Vajargah M. Investigating the relationship between some element concentrations in liver and muscle of Vimba persa and growth indices during different seasons in the southwest coasts of the Caspian Sea. Journal of Aquaculture Development 2020; 14(3):43-53. [ Google Scholar]
- Mohamadi Yalsuyi A, Hedayati A, Forouhar Vajargah M, Mousavi‐Sabet H. Examining the toxicity of cadmium chloride in common carp (Cyprinus carpio) and goldfish (Carassius auratus). J Environ Treat Tech 2017; 5(2):83-6. [ Google Scholar]
- Forouhar Vajargah M, Sattari M, Imanpour Namin J, Bibak M. Evaluation of trace element contaminations in the skin tissue of Rutilus kutum (Kamensky, 1901) from the south of the Caspian Sea. J Adv Environ Health Res 2021; 9(2):139-48. doi: 10.32598/jaehr.9.2.1201 [Crossref] [ Google Scholar]
- Forouhar Vajargah M, Sattari M, Imanpour Namin J, Bibak M. Predicting the trace element levels in Caspian kutum (Rutilus kutum) from south of the Caspian Sea based on locality, season and fish tissue. Biol Trace Elem Res. 2021. 10.1007/s12011-021-02622-4.
- Forouhar Vajargah M, Hossaini SA, Hedayati A. Acute toxicity test of two pesticides diazinon and deltamethrin on spirlin (Alburnoides bipunctatus) larvae and fingerling. J Toxicol Environ Health Sci 2013; 5(6):106-10. doi: 10.5897/jtehs2013.0270 [Crossref] [ Google Scholar]
- Forouhar Vajargah M, Hedayati A. Acute toxicity of trichlorofon on four viviparous fish: Poecilia latipinna, Poecilia reticulata, Gambusia holbrooki and Xiphophorus helleri (Cyprinodontiformes: Poeciliidae). J Coast Life Med 2014; 2(7):511-4. doi: 10.12980/jclm.2.2014j11 [Crossref] [ Google Scholar]
- Sattari M, Forouhar Vajargah M, Bibak M, Bakhshalizadeh S. Relationship between trace element content in the brain of bony fish species and their food items in the southwest of the Caspian Sea due to anthropogenic activities. Avicenna J Environ Health Eng 2020; 7(2):78-85. doi: 10.34172/ajehe.2020.12 [Crossref] [ Google Scholar]
- Sattari M, Imanpour Namin J, Bibak M, Forouhar Vajargah M, Mazareiy MH. Trace elements contamination in Alosa braschnikowi of the southern basins of Caspian Sea-Guilan province. J Anim Environ 2020; 12(3):115-22. [ Google Scholar]
- Bibak M, Sattari M, Tahmasebi S, Kafaei R, Sorial GA, Ramavandi B. Trace and major elements concentration in fish and associated sediment-seawater, northern shores of the Persian Gulf. Biol Trace Elem Res 2021; 199(7):2717-29. doi: 10.1007/s12011-020-02370-x [Crossref] [ Google Scholar]
- Khanipour AA, Ahmadi M, Seifzadeh M. Study on bioaccumulation of heavy metals (cadmium, nickel, zinc and lead) in the muscle of wels catfish (Silurus glanis) in the Anzali wetland. Iran J Fish Sci 2018; 17(1):244-50. doi: 10.22092/ijfs.2018.118782 [Crossref] [ Google Scholar]
- Sattari M, Imanpour Namin J, Bibak M, Forouhar Vajargah M, Bakhshalizadeh S, Faggio C. Determination of trace element accumulation in gonads of Rutilus kutum (Kamensky, 1901) from the south Caspian Sea trace element contaminations in gonads. Proc Natl Acad Sci India Sect B Biol Sci 2020; 90(4):777-84. doi: 10.1007/s40011-019-01150-5 [Crossref] [ Google Scholar]
- Bibak M, Tahmasebi S, Sattari M, Kafaei R, Ramavandi B. Empirical cumulative entropy as a new trace elements indicator to determine the relationship between algae-sediment pollution in the Persian Gulf, southern Iran. Environ Sci Pollut Res Int 2021; 28(4):4634-44. doi: 10.1007/s11356-020-10838-5 [Crossref] [ Google Scholar]
- Bibak M, Sattari M, Tahmasebi S, Agharokh A, Imanpour Namin J. Marine macro-algae as a bio-indicator of heavy metal pollution in the marine environments, Persian Gulf. Indian J Geo-Mar Sci 2020; 49(3):357-63. [ Google Scholar]
- United States Environmental Protection Agency (USEPA). Guidance for Assessing Chemical Contaminant Data for Use in Fish Advisories. Volume 1: Fish Sampling and Analysis. 3rd ed. Washington, DC: USEPA; 2006.
- Taghavi Jelodar H, Fazli H, Salman Mahiny A. Study on heavy metals (chromium, cadmium, cobalt and lead) concentration in three pelagic species of kilka (genus Clupeonella) in the southern Caspian Sea. Iran J Fish Sci 2016; 15(1):567-74. [ Google Scholar]
- FAO, WHO. Summary of Evaluations Performed by the Joint FAO/WHO Expert Committee on Food Additives (JECFA 1956-2003). International Life Sciences Institute (ILSI); 2004.
- Sattari M, Bibak M, Forouhar Vajargah M. Evaluation of trace elements contaminations in muscles of Rutilus kutum (Pisces: Cyprinidae) from the southern shores of the Caspian Sea. Environ Health Eng Manag 2020; 7(2):89-96. doi: 10.34172/ehem.2020.11 [Crossref] [ Google Scholar]
- Sattari M, Bibak M, Forouhar Vajargah M, Faggio C. Trace and major elements in muscle and liver tissues of Alosa braschnikowy from the south Caspian Sea and potential human health risk assessment. J Mater Environ Sci 2020; 11(7):1129-40. [ Google Scholar]
- Sattari M, Imanpour J, Bibak M, Forouhar Vajargah M, Khosravi A. Investigation of metal element concentrations in tissue of Rutilus frisii in the southwest Caspian Sea. Iran J Fish Sci 2019; 28(3):149-61. doi: 10.22092/isfj.2019.119162 [Crossref] [ Google Scholar]
- WHO. Cadmium. Environmental Health Criteria. Vol 134. Geneva: WHO; 1992. p. 280.
- FAO/WHO, Expert Committee on Food Additives, Arsenic. 2005. Available from http://www.inchem.org/documents/jecfa/jeceval/jec159.htm.
- Yalsuyi AM, Vajargah Vajargah, MF MF. Recent advance on aspect of fisheries: a review. J coast Life med 2017; 5(4):141-148. [ Google Scholar]
- Sattari M, Imanpour Namin J, Bibak M, Forouhar Vajargah M, Faggio C, Soroush Haddad M. Trace and macro elements bioaccumulation in the muscle and liver tissues of Alburnus chalcoides from the south Caspian Sea and potential human health risk assessment. J Energy Environ Chem Eng 2019; 4(1):13-20. [ Google Scholar]
- Ibrayev RA, Özsoy E, Schrum C, Sur HI. Seasonal variability of the Caspian Sea three-dimensional circulation, sea level and air-sea interaction. Ocean Sci 2010; 6(1):311-29. doi: 10.5194/os-6-311-2010 [Crossref] [ Google Scholar]
- Bibak M, Sattari M, Agharokh A, Tahmasebi S, Imanpour Namin J. Assessing some heavy metals pollutions in sediments of the northern Persian Gulf (Bushehr province). Environ Health Eng Manag 2018; 5(3):175-9. doi: 10.15171/ehem.2018.24 [Crossref] [ Google Scholar]
- Eslami S, Hajizadeh Moghaddam A, Jafari N, Nabavi SF, Nabavi SM, Ebrahimzadeh MA. Trace element level in different tissues of Rutilus frisii kutum collected from Tajan River, Iran. Biol Trace Elem Res 2011; 143(2):965-73. doi: 10.1007/s12011-010-8885-9 [Crossref] [ Google Scholar]
- Alipour H, Pourkhabbaz A, Hassanpour M. Assessing of heavy metal concentrations in the tissues of Rutilus rutilus caspicus and Neogobius gorlap from Miankaleh international wetland. Bull Environ Contam Toxicol 2013; 91(5):517-21. doi: 10.1007/s00128-013-1105-5 [Crossref] [ Google Scholar]
- Heydari S, Imanpour Namin J, Mohammadi M, Monsefrad F. Cadmium and lead concentrations in muscles and livers of stellate sturgeon (Acipenser stellatus) from several sampling stations in the southern Caspian Sea. J Appl Ichthyol 2011; 27(2):520-3. doi: 10.1111/j.1439-0426.2011.01672.x [Crossref] [ Google Scholar]
- Monsefrad F, Imanpour Namin J, Heidary S. Concentration of heavy and toxic metals Cu, Zn, Cd, Pb and Hg in liver and muscles of Rutilus frisii kutum during spawning season with respect to growth parameters. Iran J Fish Sci 2012; 11(4):825-39. [ Google Scholar]
- Mohamadi Yalsuyi A, Forouhar Vajargah M. Acute toxicity of silver nanoparticles in roach (Rutilus rutilus) and goldfish (Carassius auratus). J Environ Treat Tech 2017; 5(1):1-4. [ Google Scholar]
- Forouhar Vajargah M, Hedayati A, Mohamadi Yalsuyi A, Abarghoei S, Gerami MH, Ghaffari Farsani H. Acute toxicity of butachlor to Caspian kutum (Rutilus frisii kutum Kamensky, 1991). J Environ Treat Tech 2014; 2(4):155-7. [ Google Scholar]
- Forouhar Vajargah M, Sattari M, Imanpour Namin J, Bibak M. Length-weight, length-length relationships and condition factor of Rutilus kutum (Actinopterygii: Cyprinidae) from the southern Caspian Sea, Iran. J Animal Divers 2020; 2(2):56-61. doi: 10.29252/jad.2020.2.2.6 [Crossref] [ Google Scholar]
- Forouhar Vajargah M, Hedayati A. Acute toxicity of butachlor to Rutilus rutilus caspicus and Sander lucioperca in vivo condition. Transylv Rev Syst Ecol Res 2017; 19(3):85-92. [ Google Scholar]
- Forouhar Vajargah M, Mohamadi Yalsuyi A, Hedayati A, Faggio C. Histopathological lesions and toxicity in common carp (Cyprinus carpio L 1758) induced by copper nanoparticles. Microsc Res Tech 2018; 81(7):724-9. doi: 10.1002/jemt.23028 [Crossref] [ Google Scholar]
- Zar JH. Biostatistical Analysis. 3rd ed. Upper Saddle River: Prentice Hall, Inc; 1996.
- Forouhar Vajargah M, Mohamadi Yalsuyi A, Sattari M, Hedayati A. Acute toxicity effect of glyphosate on survival rate of common carp, Cyprinus carpio. Environ Health Eng Manag 2018; 5(2):61-6. doi: 10.15171/ehem.2018.09 [Crossref] [ Google Scholar]
- Visnjic-Jeftic Z, Jaric I, Jovanovic L, Skoric S, Smederevac-Lalic M, Nikcevic M. Heavy metal and trace element accumulation in muscle, liver and gills of the Pontic shad (Alosa immaculata Bennet 1835) from the Danube River (Serbia). Microchem J 2010; 95(2):341-4. doi: 10.1016/j.microc.2010.02.004 [Crossref] [ Google Scholar]
- Yilmaz TI, Duschl F, Di Genova D. Feathery and network-like filamentous textures as indicators for the re-crystallization of quartz from a metastable silica precursor at the Rusey Fault Zone, Cornwall, UK. Solid Earth 2016 Nov 7; 7(6):1509-19. doi: 10.5194/se-7-1509-2016 [Crossref] [ Google Scholar]
- Alipour H, Pourkhabbaz A, Hassanpour M. Determination of metals (As, Cu, Fe, and Zn) in two fish species from the Miankaleh wetland. Arch Polish Fish 2016; 24(2):99-105. doi: 10.1515/aopf-2016-0011 [Crossref] [ Google Scholar]
- Imanpour Namin J, Mohammadi M, Heydari S, Monsefrad F. Heavy metals Cu, Zn, Cd and Pb in tissue, liver of Esox lucius and sediment from the Anzali international lagoon-Iran. Caspian J Environ Sci 2011; 9(1):1-8. [ Google Scholar]
- Alipour H, Banagar GR. Health risk assessment of selected heavy metals in some edible fishes from Gorgan Bay, Iran. Iran J Fish Sci 2018; 17(1):21-34. [ Google Scholar]
- Mirzajani AR, Hamidian AH, Karami M. Metal bioaccumulation in representative organisms from different trophic levels of the Caspian Sea. Iran J Fish Sci 2016; 15(3):1027-43. [ Google Scholar]
- FAO/WHO. General standard for contaminants and toxins in food and feed CXS 193-1995, amended in 2018, 65 p.
- Storelli MM. Potential human health risks from metals (Hg, Cd, and Pb) and polychlorinated biphenyls (PCBs) via seafood consumption: estimation of target hazard quotients (THQs) and toxic equivalents (TEQs). Food Chem Toxicol 2008; 46(8):2782-8. doi: 10.1016/j.fct.2008.05.011 [Crossref] [ Google Scholar]
- Majlesi M, Pashangeh S, Salehi SO, Berizi E. Human health risks from heavy metals in fish of a fresh water river in Iran. Int J Nut Sci 2018; 3(3):157-63. [ Google Scholar]