Avicenna J Environ Health Eng. 7(2):55-65.
doi: 10.34172/ajehe.2020.09
Original Article
Removal of Lead Ions From Aqueous Solutions Using Melamine-Modified Nano Graphene Oxide
Nazanin Parsa 1, *, Hassan Rezai 2
Author information:
1Department of Environmental Pollution, Gorgan University of Agricultural Sciences and Natural Resources, Gorgan, Iran
2Department of Environment, Gorgan University of Agricultural Sciences and Natural Resources, Gorgan, Iran
Abstract
Today, due to the industrialization of societies, the existence of heavy metals has created many problems for humans, other organisms, and the environment. Lead (Pb) is highly toxic and the second most commonly used metal. The aim of this study was to evaluate the efficiency of melamine-modified nanographene oxide in the removal of Pb from aqueous media. To increase the efficiency of graphene oxide, it was mechanically converted to nano graphene oxide and melamine (4, 2 and 6-triazine, 3, 1 and 5 triamine). Experiments were performed at pH value of 3-8, temperature of 15-50°C, Pb concentration of 5-200 mg/g, adsorbent dose of 0.01-0.06 g, and contact time of 15- 150 minutes. The mechanism of the adsorption process was investigated using two Langmuir and Freundlich isotherm models, pseudo-first order and pseudo-second order kinetic equations, and thermodynamic equations. The results showed that the adsorption rate corresponds to the Freundlich isotherm model and pseudo-second order kinetic equation. Thermodynamic studies also showed that the adsorption process is associated with increasing irregularities and it is endothermic. In constant conditions (pH of 6, contact time of 60 minutes, ambient temperature of 22°C, Pb concentration of 20 mg/L, and adsorbent dose of 0.01 g), the adsorption capacity was 191.65 mg/g. The highest adsorption occurs at the concentration of 5 mg/L and the highest adsorption capacity and removal percentage was observed at a concentration of 200 mg/L, which were 1896.3 mg/g and 98.8%, respectively. Due to the high adsorption capacity, the adsorbent was able to remove lead from the contaminated environment.
Keywords: Lead, Graphene oxide, Isotherms, Thermodynamics, Kinetics
Copyright and License Information
© 2020 The Author(s); Published by Hamadan University of Medical Sciences.
This is an open-access article distributed under the terms of the Creative Commons Attribution License (
http://creativecommons.org/licenses/by/4.0), which permits unrestricted use, distribution, and reproduction in any medium provided the original work is properly cited.
1. Introduction
One of the most important environmental issues is heavy metal pollution due to its toxic nature and other negative effects (1). The most common toxic heavy metal pollutants include mercury, cadmium, lead, cobalt, zinc, nickel, and manganese. Of these heavy metal ions, lead (Pb) is the most toxic heavy metal used in the production of colors, coatings, glass, and batteries. It may be toxic to humans and the environment (2). This metal accumulates in the bones of humans (half-life of more than 20 years) and affects the nervous and reproductive systems, erythrocytes, and kidneys, and due to its enzymatic inhibitory effects, it is likely to be carcinogenic (3). Lead is one of the most durable heavy metals that has a number of long-term effects on the body, such as lowered IQ and neurodevelopment in children and affects the central nervous system. If a person becomes Pb poisoned, even if he/she is saved from death, trauma and brain injury will be with the person for the rest of their lives. There are various methods for the removal of heavy metals such as reverse osmosis, evaporation, ion exchange, electrodialysis, biological removal, solvent extraction, clotting, continuous dissociation, and adsorption processes. Many of the methods mentioned are not very welcomed due to their low efficiency and high cost. Surface adsorption has been of interest to researchers in recent years due to its ease of use and high capacity. The process of removal of heavy metals depends on various factors such as pH, concentration, adsorbent dose, temperature, and contact time (4,5). Due to the inherent advantages of the large surface area and numerous functional groups, graphene oxide and its large-scale nanomaterials are effective in treating pollution (6). Graphene sheets are composed of carbon atoms linked together. Each sheet of graphene is only one atom thick, which is called single layer graphene. Two-dimensional sheet graphene is in a hexagonal shape containing carbon atoms. On a graphene sheet, each carbon atom has a free off-sheet bond, which is a suitable site for the bonding of functional groups and hydrogen atoms (4). The oxidized graphene is well dispersed in water due to the presence of hydrophilic groups, which are considered to be responsible for the adsorption of lead ions. Some researchers mentioned the existence of fe3O4 on the surface of graphene oxide, which gives a magnetic property to the adsorbent. In such a way, after the adsorption operation, the adsorbent can be collected using the external magnetic field (7,8). Increasing the use of nanosorbents can increase the risks of their accumulation in the environment, and sometimes the toxicity of these residual nanoparticles may be even greater than metals (9). Zolfaghari et al investigated the efficiency of magnetic halloysite nanotubes/graphene oxide nanocomposites (M-HNT/GO) in removing zinc ions from aqueous solutions. The results showed that synthesized nano-adsorbents could be used for the removal of zinc from wastewater with the removal percentage of 95.2±0.41% (10). Fan et al used graphene oxide and magnetic chitosan mixtures as adsorbents and eliminated the Pb ion. The effect of pH, contact time, and concentration on the adsorption of Pb (II) ions was investigated. The maximum adsorption capacity for Pb (II) was estimated to be 76.94 mg/g (6). Kiani and Mirzaei removed phosphate from water by adsorption onto graphene oxide nanoparticles. The highest adsorption was equal to 75% at pH = 3 after 3 hours of contact with the adsorbent. The results show that the pseudo-second-order kinetic model fitted the data (11). The present research was carried out to investigate the removal of Pb from aqueous solutions by melamine modified nano graphene oxide. The primary purpose was to investigate the effect of modified graphene oxide on the removal of heavy metals. The secondary purpose was to investigate the effect of pH, initial concentration, adsorbent dose, temperature, and time on the adsorption of lead from aqueous solution.
For the first time, melamine has been used as a modifier in this research, which improves the adsorption of metals having a positive cation due to the negative charge of melamine groups.
2. Materials and Methods
2.1. Materials
Instruments used for testing were: pH meter model AZ 8653 made in Taiwan to check the pH value, digital scale model (Bands Bs-3003) with accuracy of 0.001 for weighing, shaker incubator model Ikaks model (4000 IC) made in Germany, it was used to mix adsorbents and solvent pollutants, and a US-made (Hermle Z300) centrifuge at 4000 rpm was used to separate suspended particles from the solution, and a British-made Uniam919 flame atomic absorption device (AAS) was used. To investigate and identify melamine-modified nano-graphene oxide, the field emission microscope (FESEM), the Tensor Fourier transform infrared spectroscopy (FTIR) and the X-ray diffraction (XRD) were used.
Pb (NO3)2, 0.1 HCl and NaOH solutions, and graphite which were used for the preparation of Pb-containing solutions and pH adjustment were purchased from Merck Company, Germany. Double-ionized distilled water was used to dilute the solutions.
2.2. Preparation of Modified Nano Graphene Oxide
Graphene nanostructure synthesis was performed by Hummer method. First, 360 mL of sulfuric acid, 40 mL of phosphoric acid, and 4 g of graphite were mixed and stirred slowly. Then, 18 g of potassium permanganate was gradually added to the reaction. When the reaction temperature reached about 35 to 40°C, the container was then transferred to a Bécher containing 3 ml of hydrogen peroxide and 400 ml of ice water to remove unreacted potassium permanganate. The solids were removed using a centrifuge and washed with 200 mL of water. Then, they were washed with 200 mL of ethanol and 200 mL of 30% chloride acid twice to remove all metal ions and acids. The material was dried by freeze-drying and was placed in vacuum oven at 50°C overnight to remove residual moisture and the obtained product was graphene oxide (12). To increase the efficiency of graphene oxide, it was mechanically converted to nano graphene oxide and melamine (2, 4 and 6-triazine, 1, 3 and 5 triamine) as as precipitators was used as modifier.
2.3. Preparation of Standard Pb Solution
First, a stock solution of 1000 mg/L of Pb was obtained by dissolving 1.6853 g of Pb (NO3)2 salt in deionized water. The calculated salt value of Pb (NO3)2 was weighed with a precision of 0.001 g and poured into a volumetric flask of 1000 mL which was filled with deionized distilled water. Then, 5, 10, 20, 50, 100 and 200 mg/L of this solution was used to make the desired concentrations of Pb. All adsorption experiments were performed in a discontinuous system and repeated twice.
2.4. General Procedure for Pb Adsorption Experiment by Nano Graphene Oxide Adsorbent in a Discontinuous System
According to the literature and previous studies done on heavy metal adsorption, 5 parameters including temperature, contact time, adsorbent dose, initial concentration, and pH have important roles in the removal of pollutants. Experiments were performed at the pH value of 3-8, temperature of 15-50°C, Pb concentration of 5-200 mg/L, adsorbent dose of 0.01-0.06 g, and contact time of 15-150 minutes. The effect of each parameter on the removal of heavy metals was investigated by graphene oxide nano-adsorbent. One parameter was considered variable at each stage and the others were considered constant. Experiments were performed in a discontinuous system and repeated twice. Initial conditions for each parameter included pH value of 6, initial metal concentration of 20 mg/L, contact time of 60 minutes, adsorbent dose of 0.01 g, and temperature of 22°C. First, the desired volume was extracted from the made solution and filled with deionized distilled water in a 100 mL balloon and then transferred to a 250 mL Becher. Next, pH was measured using a pH meter and the adsorbent was weighed using the scales. Afterwards, the solution was transferred to a 250-mL Erlenmeyer flask, which was placed in the shaker at 120 rpm and specific time and temperature. It was then poured into 50 mL falcons and centrifuged at 3000 rpm for 5 minutes and the solution was filtered through Whatman filter paper 42. Afterwards, 1 mL of 32% nitric acid was added to prevent the deposition of metal ions and stored in the refrigerator. The final concentration of the solution was determined by AAS. Excel version 2013 and SPSS software were used for data analysis and calculation of removal percentage. Data were analyzed using the formulas of removal percentage, adsorption capacity, kinetic and thermodynamic studies, and adsorption isotherms.
2.5. Calculation of the Adsorption Percentage and Adsorption Capacity
The removal percentage for each experiment was calculated using (equation 1):
In this relation, Ci, Ce, and A are the initial metal concentration in mg/L, the final metal concentration in mg/L, and the removal percentage, respectively.
The amount of adsorption or equilibrium adsorption capacity is calculated from (equation 2):
which M is mass of adsorbent (g); V is sample volume and qe is equilibrium adsorption capacity in mg/g, that is, the amount of metal adsorbed per gram of adsorbent (13).
2.6. Adsorption Isotherms
The isotherm is an important parameter in the design of adsorption systems and the relationship between the adsorbed material concentration and the adsorption capacity of the adsorbent. Langmuir and Freundlich isotherm models were used to investigate the equilibrium state of the adsorbed material between the solid and liquid phases. Langmuir and Freundlich isotherms are used to describe the data. Langmuir isotherm is based on the assumption that the adsorption process remains on homogeneous adsorbent surfaces with constant energy, and Freundlich isotherm assumes that the adsorption process occurs on heterogeneous surfaces with an asymmetric distribution of adsorption heat (14).
2.6.1. Langmuir Adsorption Isotherm
Langmuir isotherm is based on single layer and homogeneous adsorption of the adsorbed material with the same energy on the entire adsorbent surface (15). The final adsorption capacity is obtained from equation 3 by the Langmuir, which takes the form of equation 4 after it has been ordered.
In the above equation:
Ce = Final equilibrium concentration of the metal
qe = Equilibrium adsorption capacity equal to the amount of adsorbed metal per gram of adsorbent
b = Langmuir adsorption equilibrium constant
qmax = maximum equilibrium adsorption capacity (13).
One of the features of the Langmuir equation is the dimensionless constant separation factor RL. With this parameter, the type of process can be determined, and the adsorption state can be determined using this relation:
In the above relation, c is the initial concentration before adsorption.
In modes of RL>1, RL = 1, RL = 0, and 0<RL<1, the adsorption is undesirable, linear, irreversible, and desirable, respectively (16).
2.6.2. Freundlich Isotherm
Freundlich isotherm is based on the multilayer and heterogeneous adsorption on the adsorbent and its linear relation is as follows:
Kf = Freundlich isotherm constant
n = Adsorption intensity
Ce = Final equilibrium concentration of the metal (mg/L)
qe = Amount of metal adsorbed on adsorbent in equilibrium (mg/g)
The values of n and Kf parameters are obtained from the slope and y-intercept of the linear plot of ln Ce against ln qe, respectively. In this model, n values of less than 1 represent weak adsorption and a value between 1 and 10 is considered desirable (17).
2-7. Model of Adsorption Kinetics
The reaction rate of a chemical reaction is defined as the change in the concentration of a reactant or product per unit time. The concentration of these products does not appear in the rate laws because the reaction rate is studied in conditions that do not contribute to the overall reaction.
Kinetics is necessary to collect data on the parameters affecting the reaction rate as well as to determine the mechanisms controlling the adsorption process such as adsorption in the chemical reaction and the mechanism of diffusion in the kinetics evaluation. The pseudo-first order and pseudo-second order kinetic models are used for the adsorption process. The pseudo-first order kinetic model is used for diffusion from a single layer based on solid capacity, and the pseudo-second order kinetic model shows that the chemical adsorption is a deceleration step and it is a surface adsorption controller based on the solid phase adsorption. The pseudo-first order and pseudo-second order kinetic models are frequently used in investigating the adsorption mechanisms of most heavy metals (18). This is because both kinetic models are involved in chemical processes. The linear form of the pseudo-first order kinetic model is as follows:
(8)
qe = The amount of metal adsorbed on the adsorbent in equilibrium in mg/g
qt = The amount of metal adsorbed per unit time in mg/g
k = adsorption rate constant of pseudo first order (min-1)
The linear form of the pseudo-second order kinetic model is as follows:
qe = The amount of metal adsorbed in equilibrium
q(t) = The amount of metal adsorbed at time t
k2 = Adsorption rate constant of pseudo-second-order (g.mg-1.min-1) (19).
2.8. Thermodynamic Parameter
For the thermodynamic study, the adsorption process of three main parameters of Gibbs free energy (kJ.mol-1) as ΔG0, enthalpy change (kJ.mol-1) as ΔH0, and entropy change (kJ.mol-1.K-1) as ΔS0 are required.
T = System temperature in Kelvin
R = General gas constant 8.314 J. mol-1.K-1
K0 = equilibrium constant
The value of k can be determined by the tracing line of diagram as ln (qe/Ce) versus qe.
In addition, ΔS and ∆H0 are determined by the y-intercept and the slope of the L/K0 regression corresponding to 1/T (14).
The thermodynamic parameters are accurate and are used to characterize the exact information of inherent energy changes. Usually, negative ΔG0 and ΔH0 values indicate that the adsorption that occurred is spontaneous and endothermic, whereas negative values indicate an opposite mechanism. ΔH0 indicates the type of adsorption process such as physical or chemical adsorption. Many physical adsorption processes are observed in the range below 20 kJ/mol, while the dominant physical-chemical adsorption processes are observed in the 20-80 kJ/mol range and chemical processes occur in the 80-400 kJ.mol-1 range (20).
3. Results and Discussion
3.1. Adsorbent Properties
3.1.1. FTIR
To determine the structure of the functional groups in the adsorbent, FTIR (Tensor 27 Model, Bruker Company, Germany) was used. Fig. 1 shows the FTIR spectra before and after the adsorption of Pb. As shown in the spectra (Fig. 1), the hydroxyl or amino, carbonyl as well as carbon-carbon double bonds groups show good conditions for the Pb adsorption.
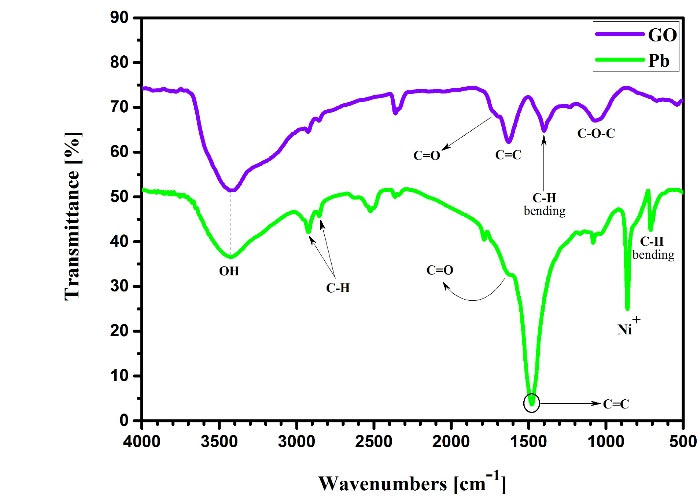
Figure 1.
FTIR Spectroscopy of Graphene Oxide Nanoparticles before and after Adsorption.
.
FTIR Spectroscopy of Graphene Oxide Nanoparticles before and after Adsorption.
3.1.2. X-Ray Diffraction Analysis
X-ray diffraction(XRD, Ultima IV Model, Japan) was used to investigate the crystalline structure of graphene oxide nano-adsorbent. The spectra in the range of 5 to 15 and 25 to 35 indicate the crystalline and non-amorphous structure of the adsorbent, respectively. Fig. 2 shows the XRD image of the adsorbent.
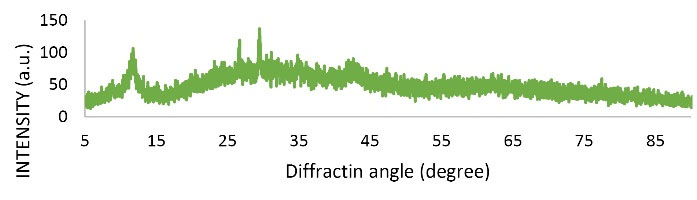
Figure 2.
X-ray Diffraction Analysis (XRD) of Modified Nano Graphene Oxide.
.
X-ray Diffraction Analysis (XRD) of Modified Nano Graphene Oxide.
3.1.3. Field-Emission Scanning Electron Microscopes
The homogeneity and heterogeneity of the adsorbents were investigated using morphological analysis. To determine the morphology of graphene oxide, field-emission scanning electron microscopes (FE-SEM) (FEI NOVA NanoSEM 450 Model, Japan) was used. Fig. 3 shows FE-SEM images before and after the adsorption by nano graphene oxide. There are pores before adsorption, indicating that it can adsorb lead ions. The porous structure indicates the high adsorption property of this adsorbent. The deep and irregular cavities seen in the figure also indicate an increase in the specific adsorbent surface, a heterogeneous energy distribution on the adsorbent surface, and better adsorption of lead. Additionally, in post-adsorption images, many active sites are still available that have not yet been filled, so the adsorbent can be reused several times without any reduction in adsorption efficiency.
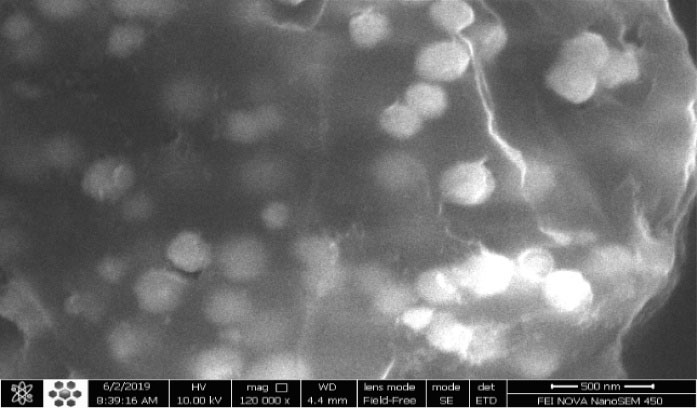
Figure 3.
FE-SEM (A) Graphene Oxide Nanoparticles Prior to Adsorption. (B) Graphene Oxide Nanoparticles after Pb Adsorption.
.
FE-SEM (A) Graphene Oxide Nanoparticles Prior to Adsorption. (B) Graphene Oxide Nanoparticles after Pb Adsorption.
3.2. Measurement of Effective Parameters in Removal of Heavy Metals by Graphene Oxide Nano Adsorbent
3.2.1. Effect of Initial pH on Pb Removal
In this study, the effects of pH in the range of 3 to 8 on the adsorption rate of Pb ions at the initial concentration of 20 mg/L, adsorbent amount of 0.01 g, temperature of 22°C, and contact time of 60 minutes were investigated. As shown in Fig. 4, it was found that with increasing pH, the removal percentage and the adsorption capacity of Pb ion increased; therefore, the highest value was obtained at pH 6. Then, by increasing the pH from 6 to 8, the removal percentage and adsorption capacity decreased. The lowest removal percentage was 57.475% and the lowest adsorption capacity was 114.95 mg/g at pH 3. Statistical analysis of data by one-way ANOVA showed that different pH levels had a significant effect on removal percentage and adsorption capacity (P < 0.05). Duncan’s test showed no significant difference in removal percentage between pH 6 and 7 as well as pH 5 and 8, but there was a significant difference in adsorption capacity between parameters.
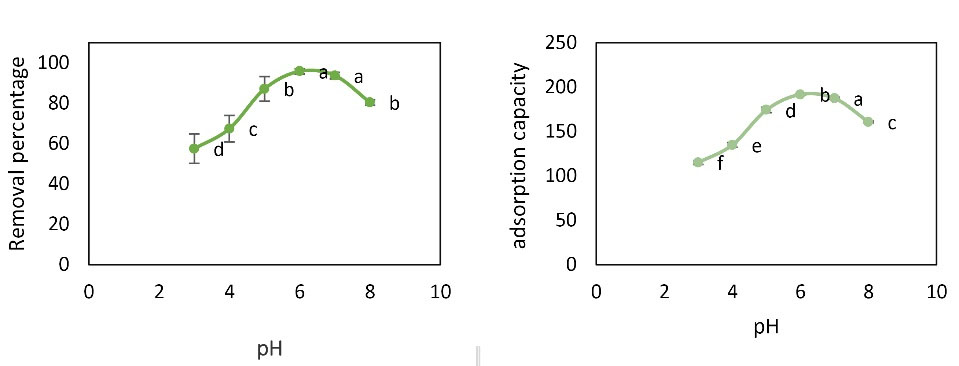
Figure 4.
Effect of pH Changes on Pb Removal Percentage and Adsorption Capacity (Initial Concentration: 20 mg/L, Contact Time: 60 minutes, Adsorbent Dose: 0.01 g, and Temperature of 22°C). Note: Different English letters indicate significant difference.
.
Effect of pH Changes on Pb Removal Percentage and Adsorption Capacity (Initial Concentration: 20 mg/L, Contact Time: 60 minutes, Adsorbent Dose: 0.01 g, and Temperature of 22°C). Note: Different English letters indicate significant difference.
The purpose of investigating the effects of different pH values is to determine the optimum pH value for adsorption, which is one of the most important parameters for the removal of heavy metals by the adsorbent. Physicochemical interactions affect the adsorption process and the electrostatic effect of ion binding is similar to the functional groups which are very important in the metal removal reactions (21).
Hosseini et al investigated Nickel and chromium adsorption from aqueous solutions using copper oxide nanoparticles and found that e maximum adsorption of chromium and nickel occurred at pH 8. It precipitates at pH values above 8 (22). This is consistent with the results of the study in which higher adsorption occurred at neutral pH. The reason for this phenomenon is that there is a repulsion between the adsorbent and the adsorbate, which reduces the amount of adsorption.
3.2-2. Effect of Adsorbent Dose on Pb Removal
To investigate the effect of adsorbent on adsorption of Pb metal ions, the experiment was performed at the pH value of 6, initial concentration of 20 mg/L, contact time of 60 minutes, temperature of 22°C, and adsorbent dose of 0.01-0.06 g. As shown in Fig. 5, as the adsorbent dose increased, the adsorption capacity of nano graphene oxide for Pb adsorption decreased. The removal percentage had an increasing trend at the adsorbent dose of 0.01-0.03 g and it decreases at the adsorbent dose of 0.03-0.06 g. Analysis by one-way ANOVA test showed that different amounts of graphene oxide nanoparticles had a significant effect on the rate of Pb removal and adsorption capacity (P < 0.05). Duncan’s test showed that there was no significant difference between the adsorbent dose of 0.01 and 0.04. The adsorbent dose of 0.01 g was selected as optimum.
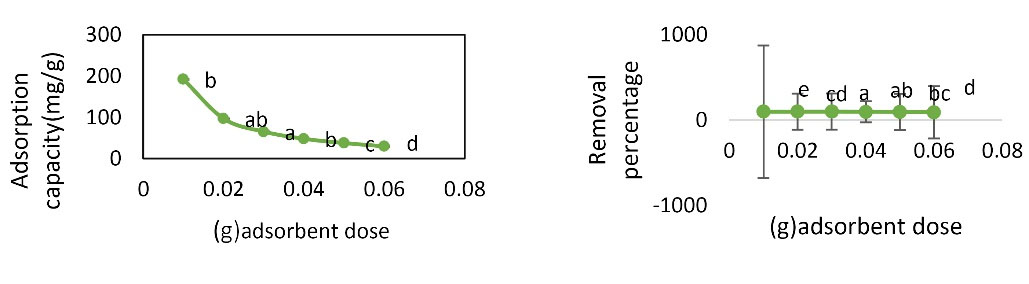
Figure 5.
Effect of Adsorbent Dose Changes on Pb Removal Percentage and Adsorption Capacity (Initial Concentration: 20 mg/L, Contact Time: 60 Minutes, pH: 6, and Temperature of 22°C).
.
Effect of Adsorbent Dose Changes on Pb Removal Percentage and Adsorption Capacity (Initial Concentration: 20 mg/L, Contact Time: 60 Minutes, pH: 6, and Temperature of 22°C).
As the adsorbent dose increases, the number of active sites available in the adsorbent increases, due to dynamic factors such as the increase in impact rate and the increase of free bands on the adsorbent as well as the active surface area of the adsorbent (24). As the amount of adsorbent increases, the adsorption capacity decreases, but the removal percentage increases initially with increasing adsorbent but then decreases. As a result, the removal percentage decreases as the adsorbent dose increases too much. Mahmydy and Tabatabai Ghamsheh studied the effect of adsorbent dose on cadmium removal with graphene adsorbent. It was observed that as the adsorbent increased, the adsorption surface increased and the amount of cadmium adsorption increased but as the adsorbent dose increased, the removal percentage decreased and the amount of cadmium removed from the effluent did not change much. The reason for this trend is that as the adsorbent mass in the solution increases, the particles collide with each other and increase in density, eventually leading to a decrease in the contact of the adsorbent surface with the solution and when the surface area decreases, the rate of removal also decreases, indicating the accuracy of the results (25).
3.2.3. Effect of Initial Concentration on Pb Removal
The initial concentration is another parameter influencing the adsorption of Pb. Experiments were performed at pH value of 6, contact time of 60 minutes, temperature of 22°C, adsorbent dose of 0.01 g, and concentration of 5-200 mg/L. According to Fig. 6, with increasing initial concentration, the removal percentage decreases and the adsorption capacity increases. The highest removal percentage was 98.8% at 5 mg/L concentration and the highest adsorption rate was 1896.3 mg/g at 200 mg concentration. Analysis by one-way ANOVA showed that initial concentration had a significant effect on Pb removal percentage and adsorption capacity.
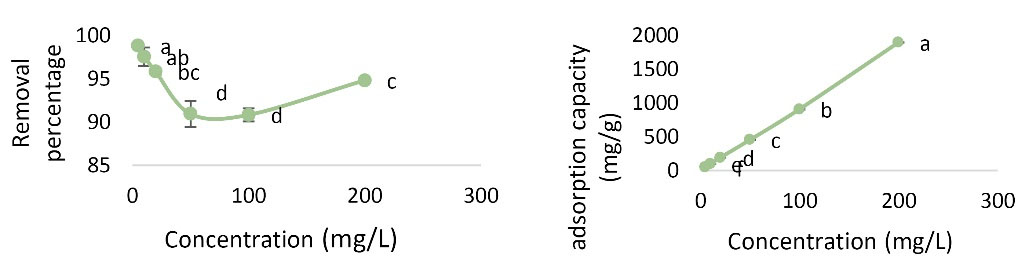
Figure 6.
Effect of Concentration Changes on Pb Removal Percentage and Adsorption Capacity (pH: 6, Contact Time: 60 Minutes, Adsorbent Dose: 0.01 g, and Temperature of 22°C).
.
Effect of Concentration Changes on Pb Removal Percentage and Adsorption Capacity (pH: 6, Contact Time: 60 Minutes, Adsorbent Dose: 0.01 g, and Temperature of 22°C).
As the initial concentration increases, the removal percentage decreases but the adsorption capacity increases. Eslami et al investigated the removal of chlorophenol by graphene nano oxide and the effect of concentration on removal percentage. It was observed that when the concentration of 4-chlorophenol reached from 10 to 100, the removal percentage decreased. Therefore, it can be concluded that by increasing the concentration of removal percentage, the active surfaces for adsorption and pore size limitation and electrostatic repulsion between the positive adsorbed loads are due to this decrease. The results are consistent with the present research (26).
3.2.4. Effect of Contact Time on Pb Removal
To investigate the effect of contact time on the adsorption of Pb metal ions, experiments were performed at pH value of 6, initial concentration of 20 mg/L, temperature of 22°C, adsorbent dose of 0.02 g, and contact time of 15-150 minutes. As shown in Fig. 7, it was found that with increasing time, removal percentage and adsorption capacity increased. For Pb, the highest removal percentage was 97.625% and the highest adsorption capacity (195.25 mg/g) was observed at 150 minutes. Analysis by one-way ANOVA showed that different amounts of time had a significant effect on Pb removal percentage and adsorption capacity (P< 0.05). The results of Duncan’s test showed no significant difference in Pb removal percentage at 60, 90, 120, and 150 minutes, and the contact time of 60 minutes was selected as the optimum time.
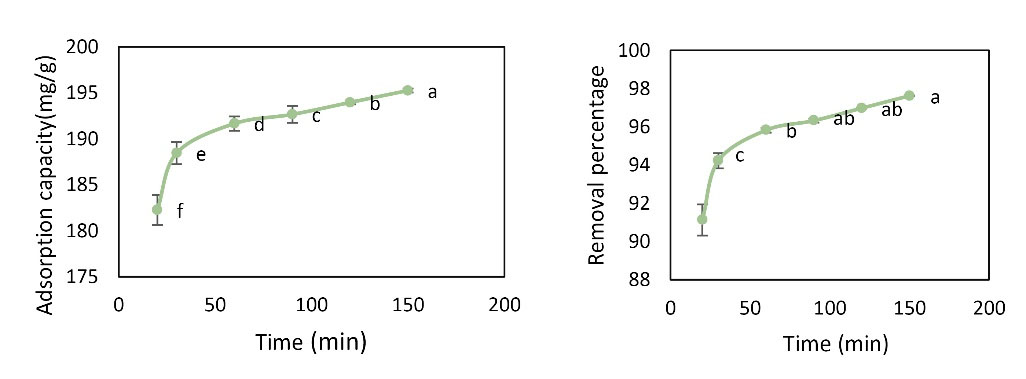
Figure 7.
Effect of Time Changes on Pb Removal Percentage and Adsorption Capacity (Initial Concentration: 20 mg/L, pH = 6, Adsorbent Dose: 0.01 g, and Temperature of 22°C).
.
Effect of Time Changes on Pb Removal Percentage and Adsorption Capacity (Initial Concentration: 20 mg/L, pH = 6, Adsorbent Dose: 0.01 g, and Temperature of 22°C).
As the contact time increases, the removal percentage and adsorption capacity increase. The contact times of 60 to 150 minutes were not significantly different and the contact time of 60 minutes was selected as the optimum contact time. Momeni et al investigated the effect of contact time on the rate of Pb removal by graphene and found that the highest adsorption occurred at 60 minutes and with increasing time, the adsorption rate increased. It followed pseudo-second order equation, which is in line with the findings of the study (27).
3.2.5.Effect of Temperature Changes on Pb Removal
To investigate the effects of temperature on the rate of Pb adsorption, the experiment was performed at pH value of 6, an initial concentration of 20 mg, adsorbent dose of 0.01 g, contact time of 60 minutes, and temperature range of 15-50°C. As shown in Fig. 8, it was found that with increasing temperature, removal percentage and adsorption capacity increased and for Pb, the highest removal percentage was 97.8% and the maximum adsorption capacity (196 mg/g) was observed at 50°C. Analysis by one-way ANOVA showed that different temperatures had a significant effect on Pb removal percentage and adsorption capacity.
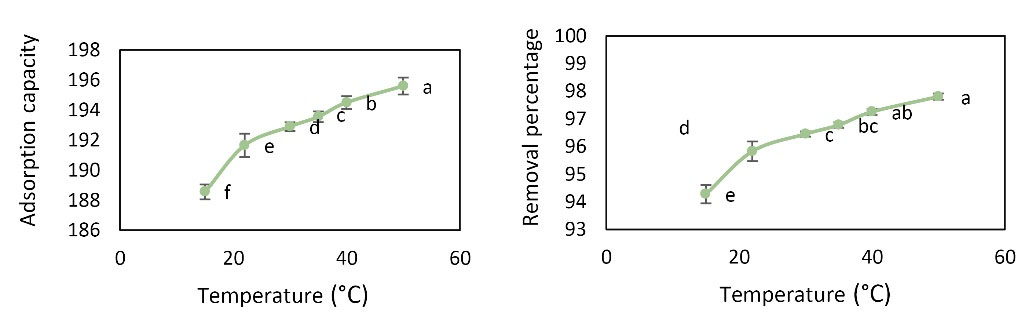
Figure 8.
Effect of Temperature Changes on Pb Removal Percentage and Adsorption Capacity (Initial Concentration: 20 mg/L, Contact Time: 60 min, Adsorbent Dose: 0.01 g, and pH value: 6)
.
Effect of Temperature Changes on Pb Removal Percentage and Adsorption Capacity (Initial Concentration: 20 mg/L, Contact Time: 60 min, Adsorbent Dose: 0.01 g, and pH value: 6)
As the temperature increased, the removal percentage and adsorption capacity increased. The results showed that there was no significant difference between temperatures of 22°C to 50°C and the ambient temperature of 22°C was selected as the optimum temperature. Temperature affects the efficiency and speed of adsorption. Due to the increase in the collision between the adsorbent and the adsorbate, the adsorption rate increased with increasing temperature
3.3. Determination of Adsorption Isotherm Model
Langmuir and Freundlich adsorption isotherm models were performed. Figs. 9 and Figs. 10 show the linear curves of the Langmuir and Freundlich isotherm models for the nano graphene oxide adsorbent for Pb removal. According to Figs. 9 and Figs. 10 and Table 1, R2 value of Freundlich model (R2 = 0.9486) was higher than that of Langmuir (R2 = 0.448) and Freundlich model can explain the adsorption of Pb ions better than Langmuir model. Since the Freundlich model is used to describe heterogeneous adsorbent surfaces, it can be concluded that the adsorption of Pb by graphene oxide nanoparticles is multilayer.
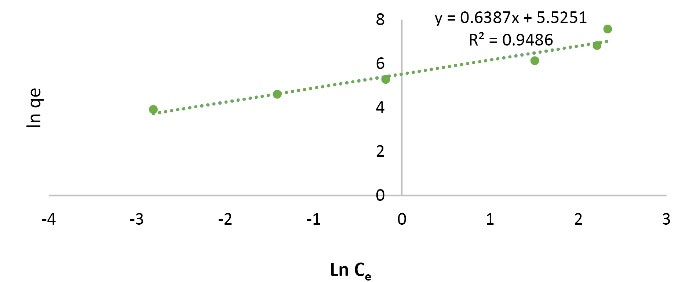
Figure 9.
Freundlich Isotherm Curve.
.
Freundlich Isotherm Curve.
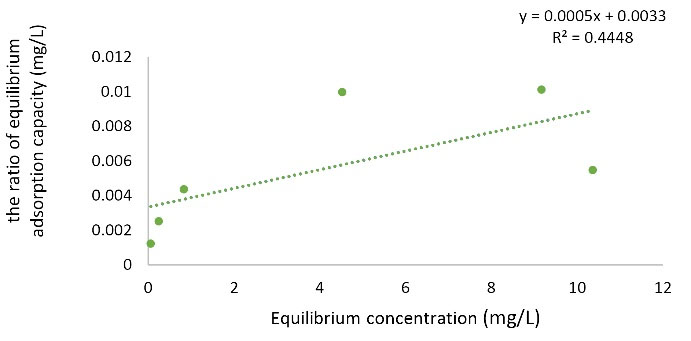
Figure 10.
Langmuir Isothermal Curve of Pb.
.
Langmuir Isothermal Curve of Pb.
Table 1.
Langmuir and Freundlich Isotherm Model Parameters
|
Model
|
R
L
|
n
|
K
f
(I/mg)
|
q
max
(mg/g)
|
b (I/mg)
|
R
2
|
| Langmuir |
0.56899 |
- |
- |
2000 |
0.151515 |
0.4448 |
| Freundlich |
- |
1.5656 |
250.9114 |
- |
- |
0.9486 |
3.4. Evaluation of Adsorption Kinetics
Kinetics study was performed to find the factors affecting the reaction rate. Figs. 11 and Figs. 12 and Table 2 show the results of fitting the experimental data with pseudo-first order and pseudo-second order kinetics models. The coefficient of explanation for the pseudo-first order kinetics is equal to 0.4915 and for the pseudo-second order kinetics, it is equal to 1. Due to the higher pseudo-second order kinetics value, it is concluded that the pseudo-second order kinetic model fitted the experimental data well.
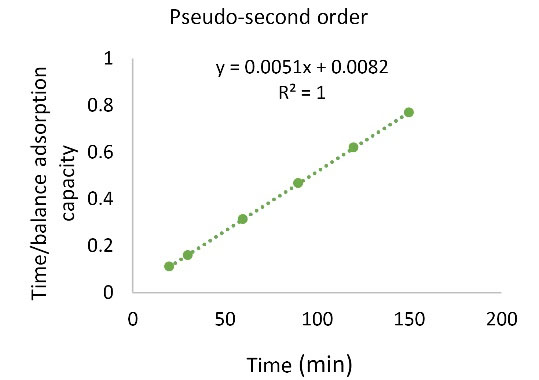
Figure 11.
The Pseudo-second-order Kinetic Model.
.
The Pseudo-second-order Kinetic Model.
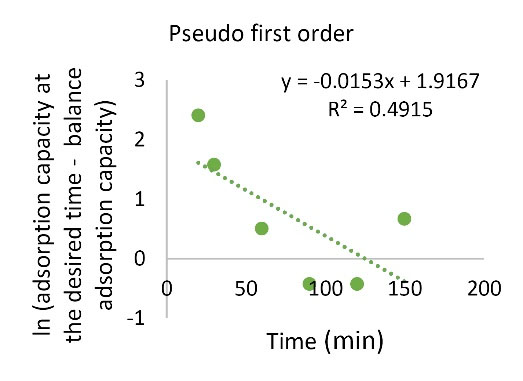
Figure 12.
The Pseudo-first-order Kinetic Model
.
The Pseudo-first-order Kinetic Model
Table 2.
Parameters Used in the Pb Kinetic Model
|
Kinetic models
|
K
2
|
K
1
|
R
2
|
| Pseudo-first order |
- |
0.0153 |
0.4915 |
| Pseudo-second order |
0.003172 |
- |
1 |
3.5. Determination of Thermodynamic Parameters of Adsorption
The thermodynamic parameters of the Pb adsorption process were determined. According to Fig. 13 and Table 3, the enthalpy of the ΔH reaction is positive, that is, the endothermic process, and the positive ΔS value indicates that by conducting a reaction, irregularity is increased and the negative ΔG value at high temperature indicates the spontaneous reaction with increasing temperature. ΔG is positive at 15°C which means that the reaction is non-spontaneous and at a higher temperature, it is negative and spontaneous.
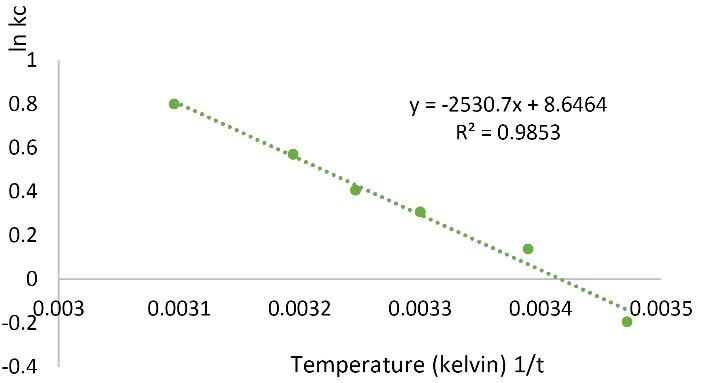
Figure 13.
Thermodynamics for Pb Adsorption on Modified Nano Graphene Oxide.
.
Thermodynamics for Pb Adsorption on Modified Nano Graphene Oxide.
Table 3.
Thermodynamic Parameters of Pb Adsorption
|
Thermodynamic Parameters
|
∆S (j mol
-1
k
-1
)
|
∆H (kjmol
-1
)
|
∆G (kjmol
-1
)
|
T (k)
|
T (°C)
|
|
|
71.88617 |
21040.24 |
465.3789 |
288 |
15 |
| -337.671 |
295 |
22 |
| -771.726 |
303 |
30 |
| -1038.94 |
308 |
35 |
| -1483.18 |
313 |
40 |
| -2144.94 |
323 |
50 |
Thermodynamic analysis showed that the amount of negative ΔG, positive ΔH, and positive ΔS indicates that the reaction is spontaneous, endothermic, and irregular with increasing temperature. ΔG is initially positive at 15°C but becomes negative at later temperatures. Therefore, it is non-spontaneous at 15°C and becomes spontaneous reaction at high temperatures. In a study by Fathi et al, the removal of hexavalent chromium from water with magnetized functionalized nano graphene was investigated. The positive ΔS and ΔH values are in agreement with the research but the ΔG is inconsistent and positive and indicates a non-spontaneous reaction (28). In a study, Hosseini et al (22) investigated the removal of nickel and chromium from aqueous solutions using copper oxide nanoparticles. Based on thermodynamic studies, they found that Ni and Cr adsorption process was endothermic. The positivity of ∆H values validates this fact and based on it, the increase in temperature causes an increase in maximum adsorption capacity. The positivity of ∆S values signifies an increase in the disorder on the solid-liquid surface during the adsorption process (21).
3.6. Comparison of the Removal Percentages in Previous Studies
As mentioned before, the highest adsorption rate occurred at the concentration of 5 mg/L and the highest removal percentage was obtained at the concentration of 200 mg/L, which were 1896.3 mg/g and 98.8%, respectively. Other studies compared the removal percentages. Based on the comparison made in Table 4 between the removal percentages obtained in previous studies, we conclude that the modified graphene oxide adsorbent also has a high removal percentage. Therefore, it is crucial to develop new adsorbents with specific active sites as well as high surface areas to ensure high selectivity and high adsorption capacity for the removal of Pb from contaminated water.
Table 4.
Comparison of Removal Percentages in Previous Studies
|
Adsorbent
|
Pollution
|
Removal Percentage
|
References
|
| Granulated graphene oxide nano particles |
4-chlorophenol |
58% |
29 |
| Iron(III) hydroxide/graphene oxide nano composite |
Pb |
98.83% |
4 |
| Graphene oxide |
Malathion toxin |
99. 8% |
30 |
| Nanocomposites on graphene oxide |
Sulfate |
84% |
31 |
| Chitosan graphene oxide composite |
Aniline |
93% |
32 |
| Chitosan graphene oxide composite |
Chlorpyriphos |
93% |
33 |
| This study |
Pb |
98.8% |
- |
4. Conclusion
The parameters of pH, adsorbent amount, contact time, temperature, and initial concentration of Pb in the discontinuous system had a statistically significant effect on the adsorption process (P > 0.05). The highest adsorption occurred at the concentration of 5 mg/L and the highest removal percentage was obtained at the concentration of 200 mg/L, which were 1896.3 mg/g and 98.8%, respectively. In investigation of equilibrium isotherms, Freundlich model was more in agreement with the experimental data. It can be concluded that the adsorbent surface is multilayered, non-uniform, and heterogeneous due to the adsorption of the material on the adsorbent. Concerning the adsorption kinetics, the pseudo-second order model fitted the experimental data well, indicating that there was a chemical equilibrium between the adsorbed material and the adsorbent. Thermodynamic studies showed that the process is spontaneous (negative ΔG), endothermic (ΔH positive), and irregular (positive ΔS). The modified graphene oxide was used for the removal of Pb from aquatic environment due to its simple and inexpensive method of preparation. One of the advantages of using graphene oxide nanoparticles is its high adsorption capacity and specific surface area and potential, and melamine-modified graphene oxide is also a suitable adsorbent for the removal of heavy metals such as Pb due to its high adsorption capacity.
Conflict of Interest Disclosures
The authors declare that they have no conflict of interests.
Acknowledgements
This article is a part of a dissertation entitled “Pb Removal from Aqueous Solutions Using Modified Nano Graphene Oxide” which was approved by Gorgan University of Agricultural Sciences and Natural Resources.
References
- Valipour M, Singh VP. Global experiences on wastewater irrigation: challenges and prospects. In: Maheshwari B, Thoradeniya B, Singh VP, eds. Balanced Urban Development: Options and Strategies for Liveable Cities. Cham: Springer; 2016. p. 289-327. 10.1007/978-3-319-28112-4_18.
- Georgescu A-M, Nardou F, Zichil V, Nistor ID. Adsorption of lead(II) ions from aqueous solutions onto Cr-pillared clays. Appl Clay Sci 2018; 152:44-50. doi: 10.1016/j.clay.2017.10.031 [Crossref] [ Google Scholar]
- Pawar RR, Lalhmunsiama Lalhmunsiama, Bajaj HC, Lee SM. Activated bentonite as a low-cost adsorbent for the removal of Cu(II) and Pb(II) from aqueous solutions: batch and column studies. J Ind Eng Chem 2016; 34:213-23. doi: 10.1016/j.jiec.2015.11.014 [Crossref] [ Google Scholar]
- Sheshmani SH, Arab fashapoyeh M, Amini R. Iron (iii) hydroxide/graphene oxide nano composite and investigation of lead adsorption. J Appl Res Chem 2013; 6(4):17-23. [ Google Scholar]
- Malkoc E, Nuhoglu Y. Investigations of nickel(II) removal from aqueous solutions using tea factory waste. J Hazard Mater 2005; 127(1-3):120-8. doi: 10.1016/j.jhazmat.2005.06.030 [Crossref] [ Google Scholar]
- Fan L, Luo C, Sun M, Li X, Qiu H. Highly selective adsorption of lead ions by water-dispersible magnetic chitosan/graphene oxide composites. Colloids Surf B Biointerfaces 2013; 103:523-9. doi: 10.1016/j.colsurfb.2012.11.006 [Crossref] [ Google Scholar]
- Cui L, Wang Y, Gao L, Hu L, Yan L, Wei Q. EDTA functionalized magnetic graphene oxide for removal of Pb(II), Hg(II) and Cu(II) in water treatment: Adsorption mechanism and separation property. Chem Eng J 2015; 281:1-10. doi: 10.1016/j.cej.2015.06.043 [Crossref] [ Google Scholar]
- Danesh N, Hosseini M, Ghorbani M, Marjani A. Fabrication, characterization and physical properties of a novel magnetite graphene oxide/Lauric acid nanoparticles modified by ethylenediaminetetraacetic acid and its applications as an adsorbent for the removal of Pb(II) ions. Synthetic Metals 2016; 220:508-23. doi: 10.1016/j.synthmet.2016.07.025 [Crossref] [ Google Scholar]
- Azade Ranjbar A, Asemi Zavareh SR. Investigation of heavy metal removal methods (arsenic, lead, chromium, mercury, cadmium) by iron nanoparticles and graphene oxide. International Congress of Architecture, Tourism and Tourist; 2017.
- Zolfaghri N, Tehrani RM, Hooshyar F. Efficiency of magnetic halloysite nanotube/graphene oxide nanocomposite (M-HNT/GO) for removal of zinc ions from aqueous solutions. Journal of Water and Wastewater 2018; 29(1):81-93. [ Google Scholar]
- Kiani Z, Mirzaei M. Removal of Phosphate from Water Through Adsorption onto Graphene Oxide Nanoparticles. J Environ Sci Technol 2019; 21(2):71-82. doi: 10.22034/jest.2019.13950 [Crossref] [ Google Scholar]
- Gharebeiglou M, Izadkhah MS, Erfan-Niya H, Entezami AA. Improving the mechanical and thermal properties of chemically modified graphene oxide/polypropylene nanocomposite. Modares Mechanical Engineering Journal 2016; 16(8):196-206. [ Google Scholar]
- Rezaei H. Biosorption of chromium by using Spirulina sp. Arab J Chem 2016; 9(6):846-53. doi: 10.1016/j.arabjc.2013.11.008 [Crossref] [ Google Scholar]
- Kakavandi B, Jonidi AJ, Rezaei RK, Nasseri S, Ameri A, Esrafily A. Synthesis and properties of Fe3O4-activated carbon magnetic nanoparticles for removal of aniline from aqueous solution: equilibrium, kinetic and thermodynamic studies. Iranian J Environ Health Sci Eng 2013; 10(1):19. doi: 10.1186/1735-2746-10-19 [Crossref] [ Google Scholar]
- Jamali HA, Dindarloo K, Nikpey A. Optimization of metal working fluids treatment using Ferric chloride by application of response surface methodology (RSM). Journal of Preventive Medicine 2015; 2(1):10-20. [ Google Scholar]
- Mahvi AH, Heibati B. Removal efficiency of azo dyes from textile effluent using activated carbon made from walnut wood and determination of isotherms of Acid Red18. J Health 2010; 1(3):7-15. [ Google Scholar]
- Iram M, Guo C, Guan Y, Ishfaq A, Liu H. Adsorption and magnetic removal of neutral red dye from aqueous solution using Fe3O4 hollow nanospheres. J Hazard Mater 2010; 181(1-3):1039-50. doi: 10.1016/j.jhazmat.2010.05.119 [Crossref] [ Google Scholar]
- Wang X, Guo Y, Yang L, Han M, Zhao J, Cheng X. Nanomaterials as sorbents to remove heavy metal ions in wastewater treatment. J Environ Anal Toxicol 2012; 2(7):154-8. doi: 10.4172/2161-0525.1000154 [Crossref] [ Google Scholar]
- Yakout SM, Elsherif E. Batch kinetics, isotherm and thermodynamic studies of adsorption of strontium from aqueous solutions onto low cost rice-straw based carbons. Carbon Sci Technol 2010; 3(1):144-53. [ Google Scholar]
- Andersson KI, Eriksson M, Norgren M. Removal of lignin from wastewater generated by mechanical pulping using activated charcoal and fly ash: adsorption isotherms and thermodynamics. Ind Eng Chem Res 2011; 50(13):7722-32. doi: 10.1021/ie200378s [Crossref] [ Google Scholar]
- Abdel Salam M, Mokhtar M, Basahel SN, Al-Thabaiti SA, Obaid AY. Removal of chlorophenol from aqueous solutions by multi-walled carbon nanotubes: kinetic and thermodynamic studies. J Alloys Compd 2010; 500(1):87-92. doi: 10.1016/j.jallcom.2010.03.217 [Crossref] [ Google Scholar]
- Hosseini R, Sayadi MH, Shekari H. Adsorption of nickel and chromium from aqueous solutions using copper oxide nanoparticles: adsorption isotherms, kinetic modeling, and thermodynamic studies. Avicenna J Environ Health Eng 2019; 6(2):66-74. doi: 10.34172/ajehe.2019.09 [Crossref] [ Google Scholar]
- Zhang L, Zeng Y, Cheng Z. Removal of heavy metal ions using chitosan and modified chitosan: a review. J Mol Liq 2016; 214:175-91. doi: 10.1016/j.molliq.2015.12.013 [Crossref] [ Google Scholar]
- Chen S, Yue Q, Gao B, Xu X. Equilibrium and kinetic adsorption study of the adsorptive removal of Cr(VI) using modified wheat residue. J Colloid Interface Sci 2010; 349(1):256-64. doi: 10.1016/j.jcis.2010.05.057 [Crossref] [ Google Scholar]
- Mahmydy H, Tabatabai Ghamsheh S. Investigation of Cadmium Removal by Adsorption with Graphene Adsorbent. First National Conference on the Development of the Knowledge Base of the Oil, Gas and Petrochemical Industries; Mahshahr; 2013. p. 7. [Persian].
- Eslami A, Yazdanbakhsh AR, Daraei H, Sofi Karimi F. Removal of 4-chlorophenol from aqueous solutions using graphene oxide nanoporous adsorbent. Journal of Water and Wastewater 2015; 26(1):19-26. [ Google Scholar]
- Momeni M, Bahre Bar F, Bahre Bar F. Effect of mixing time on adsorption percentage of Pb by adsorbent using graphene adsorbent. 4th National Congress of Biology and Natural Sciences of Iran; Tehran; 2017. p. 13. [Persian].
- Fathi S, Rezaei Kalantary R, Rashidi A, Karbasi A. Removal of hexavalent chromium from water by functionalized magnetic nano porous graphene (NPG/Fe3O4@ COOH). J Environ Stud 2017; 43(1):135-48. doi: 10.22059/jes.2017.62067.[Persian] [Crossref] [ Google Scholar]
- Eslami A, Moheb A, Mehralian M, Khashij M. Removal of 4-chlorophenol from synthetic wastewater by the granulated graphene oxide nano particles. Tolooebehdasht 2016; 15(3):209-20. [ Google Scholar]
- Rashidifard M, Amiri M. Efficiency evaluation of the graphene oxide in adsorption of malathion toxin from aqueous media. Environment and Water Engineering 2019; 5(2):137-47. doi: 10.22034/jewe.2019.157974.1294.[Persian] [Crossref] [ Google Scholar]
- Birooni R, Mirzaei M. Sulfate adsorption on iron nanocomposites on graphene oxide and activated carbon beds. Journal of Water and Wastewater 2017; 27(6):24-32. [ Google Scholar]
- Azadbakht F, Rezaei Kalantary R, Esrafili A, Shojaeyan S, Yegane Badi M, Gholami M. Efficiency assesment of chitosan graphene oxide composite in aniline removal from aqueous solutions. J Environ Health Eng 2018; 6(2):133-48. doi: 10.29252/jehe.6.2.133.[Persian] [Crossref] [ Google Scholar]
- Amiri M, Rezaei Kalantary R, Kermani M, yeganeh m, Gholami M. Investigation of chlorpyriphos removal using chitosan graphene oxide composite form aquatic solution: study of kinetics, isotherms and thermodynamics. Sci J Kurdistan Univ Med Sci 2019; 24(2):119-38. doi: 10.29252/sjku.24.2.119.[Persian] [Crossref] [ Google Scholar]